Deck 17: Fiscal Policy, Deficits, and Debt
Full screen (f)
Question
Question
Question
Question
EXTERNAL COSTS WITH FIXED-PRODUCTION TECHNOLOGY Review the situation illustrated in Exhibit 1 in this chapter. If the government sets the price of electricity at the socially optimal level, why is the net gain equal to triangle abc , even though consumers now pay a higher price for electricity? What would the net gain be if the government set the price above the optimal level? 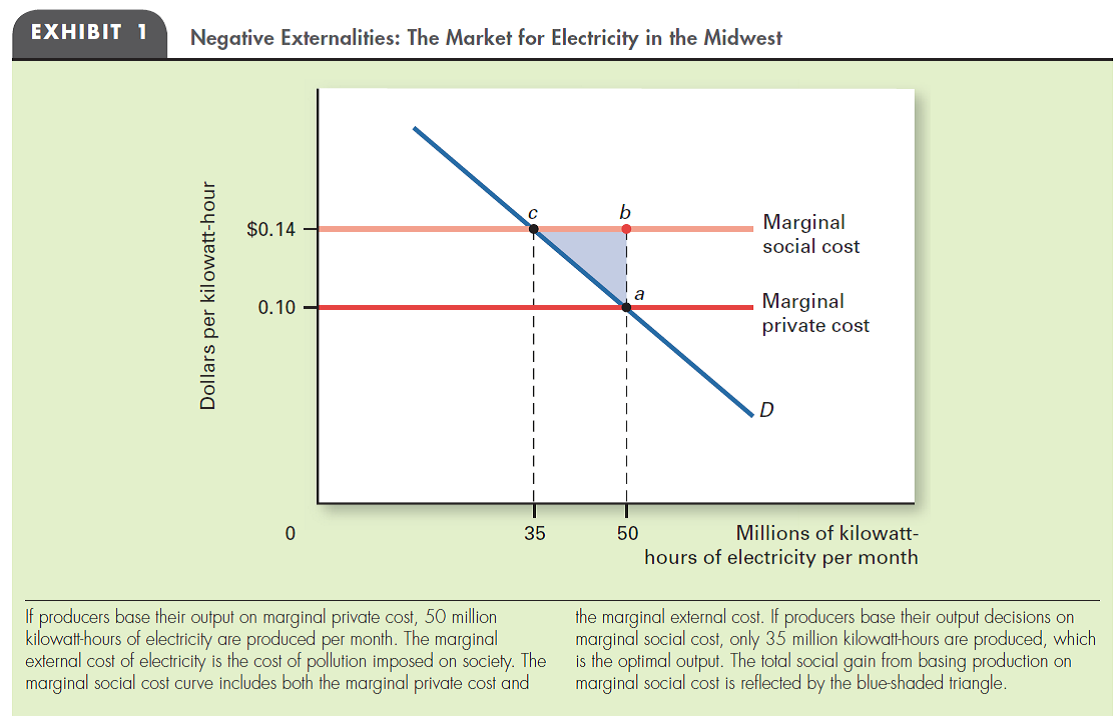
Question
(External Costs) Use the data in the table below to answer the following questions.
a. What is the marginal external cost of production?
b. What level is produced if there is no regulation of the externality?
c. What level should be produced to achieve economic efficiency?
d. Calculate the dollar value of the net gain to society from correcting the externality.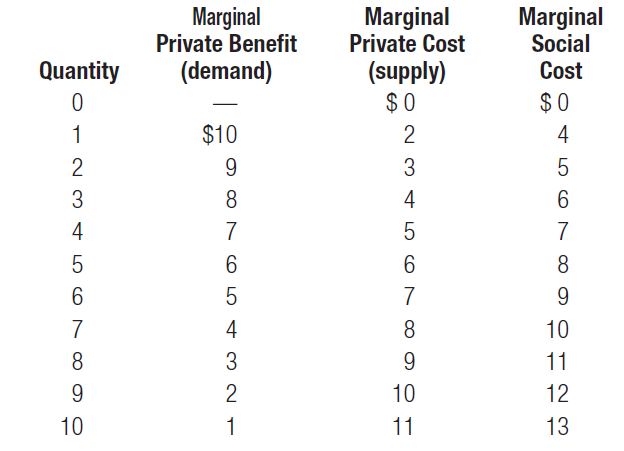
a. What is the marginal external cost of production?
b. What level is produced if there is no regulation of the externality?
c. What level should be produced to achieve economic efficiency?
d. Calculate the dollar value of the net gain to society from correcting the externality.
Question
Question
(Market for Pollution Rights) The following graph shows the market for pollution rights.
a. If there are no restrictions on pollution, what amount is discharged?
b. What is the quantity supplied and the quantity demanded if the government restricts the amount of discharge to Q* but gives the permits away?
c. Where is market equilibrium if the government sells the permits? Illustrate this on the graph.
d. What happens to market equilibrium if the gvernment reduces the amount of discharge permitted to Q**? Illustrate this on the graph.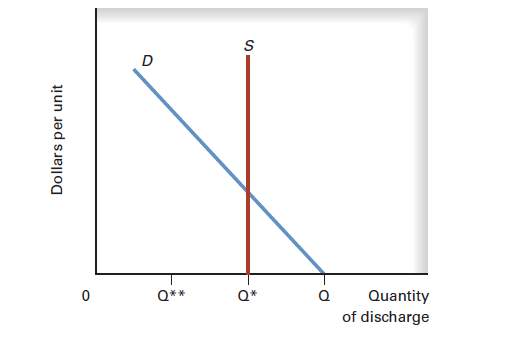
Question
Question

Unlock Deck
Sign up to unlock the cards in this deck!
Unlock Deck
Unlock Deck
1/9
Play
Full screen (f)
Deck 17: Fiscal Policy, Deficits, and Debt
1
EXTERNALITIES Complete each of the following sentences:
a. Resources that are available only in a fixed amount are _______ resources.
b. The possibility that a open-access resource is used until the marginal value of additional use equals zero is known as the _______.
c. Resources for which periodic use can be continued indefinitely are known as _______ resources.
Exhaustible resources:
Exhaustible resources are those resources which are available at fixed quantity.
Common pool resources:
Common pool resources refer to those renewable resources which can be accessed by everyone and it cannot be stopped to use those resources by any means.
Common pool problem:
Common pool problem refers to the use of common pool resources till the marginal social cost is equal to marginal social benefits.
Renewable resources:
Renewable resources refer to the resources which can be reproduced and available over a period of time.
a. Fixed amount of resources:
Resources that are available only in a fixed amount are exhaustible resources.
b. Open-across resource:
The possibility that an open-access resource is used until the marginal value of additional use equals zero is known as the common pool problem.
c. Periodic use of resource:
Resources for which periodic use can be continued indefinitely are known as renewable resources.
2
RESOLVING THE COMMON-POOL PROBLEM Why have authorities found it so difficult to regulate the fishing catch in the open ocean to allow for a sustainable yield?
Common pool resources:
Common pool resources refer to those renewable resources which can be accessed by everyone and it cannot be stopped to use those resources by any means.
Fish is a renewable resource which is available for everyone. Fish has its renewable capacity. If the fisher catches a huge amount of fishes, then its renewable capacity decreases and the fish becomes a scarce resource.
There is no system available to control fishing, since the ocean is so large. It is not possible to enact law or property rights to catch the fish. Hence, it is difficult to regulate fishing in the ocean.
3
NEGATIVE EXTERNALITIES Suppose you wish to reduce a negative externality by imposing a tax on the activity that creates it. When the amount of the externality produced per unit of output increases as output increases, the correct tax can be determined by using a demand-supply diagram; show this. Assume that the marginal private cost curve slopes upward.
Marginal private cost:
Marginal private cost refers to the additional cost incurred in producing one more additional good.
Marginal external cost:
Marginal external cost refers to the additional cost of pollution incurred due to producing one more additional good. Marginal social cost:
Marginal social cost is the addition of marginal private cost and marginal external cost.
Diagram for marginal cost and marginal benefit:
The below diagram illustrates the marginal private cost, marginal social cost, and marginal benefit at the different levels of output: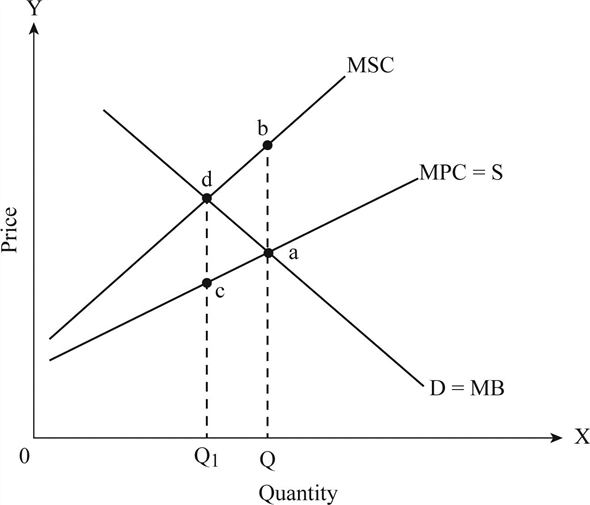 Figure - 1
In the above diagram, X axis measures the quantity of output and Y axis measures price. MSC curve represents marginal social cost and MPC curve represents marginal private cost which is equal to supply. MB represents marginal benefits which is equal to demand.
Marginal private cost and marginal social cost increase as output increases. Since marginal external cost is the difference between marginal private cost and marginal social cost, it also increases as output increases.
The demand and supply intersect at point a. The equilibrium output is Q. At this level of output, the external cost is ab. To reduce the externality, output is determined at point where the marginal social cost intersects the marginal benefits at point d. This is the economically efficient level of output. The external cost at this level is cd. The external cost of cd is less than ab. Hence, in this situation, the correct tax amount to make the externality zero is cd, which is equal to the amount of externality.
Marginal private cost refers to the additional cost incurred in producing one more additional good.
Marginal external cost:
Marginal external cost refers to the additional cost of pollution incurred due to producing one more additional good. Marginal social cost:
Marginal social cost is the addition of marginal private cost and marginal external cost.
Diagram for marginal cost and marginal benefit:
The below diagram illustrates the marginal private cost, marginal social cost, and marginal benefit at the different levels of output:
Figure - 1In the above diagram, X axis measures the quantity of output and Y axis measures price. MSC curve represents marginal social cost and MPC curve represents marginal private cost which is equal to supply. MB represents marginal benefits which is equal to demand.
Marginal private cost and marginal social cost increase as output increases. Since marginal external cost is the difference between marginal private cost and marginal social cost, it also increases as output increases.
The demand and supply intersect at point a. The equilibrium output is Q. At this level of output, the external cost is ab. To reduce the externality, output is determined at point
where the marginal social cost intersects the marginal benefits at point d. This is the economically efficient level of output. The external cost at this level is cd. The external cost of cd is less than ab. Hence, in this situation, the correct tax amount to make the externality zero is cd, which is equal to the amount of externality. 4
EXTERNAL COSTS WITH FIXED-PRODUCTION TECHNOLOGY Review the situation illustrated in Exhibit 1 in this chapter. If the government sets the price of electricity at the socially optimal level, why is the net gain equal to triangle abc , even though consumers now pay a higher price for electricity? What would the net gain be if the government set the price above the optimal level?
Unlock Deck
Unlock for access to all 9 flashcards in this deck.
Unlock Deck
k this deck
5
(External Costs) Use the data in the table below to answer the following questions.
a. What is the marginal external cost of production?
b. What level is produced if there is no regulation of the externality?
c. What level should be produced to achieve economic efficiency?
d. Calculate the dollar value of the net gain to society from correcting the externality.
a. What is the marginal external cost of production?
b. What level is produced if there is no regulation of the externality?
c. What level should be produced to achieve economic efficiency?
d. Calculate the dollar value of the net gain to society from correcting the externality.
Unlock Deck
Unlock for access to all 9 flashcards in this deck.
Unlock Deck
k this deck
6
EXTERNAL COSTS WITH VARIABLE TECHNOLOGY Think of an industry that pollutes the water and has access to variable technology for reducing that pollution. Graphically illustrate and explain the impact of each of the following, other things constant, on the optimal level of water quality for a given rate of output:
a. New evidence is discovered about a greater risk of cancer from water pollution.
b. The cost of pollution-control equipment increases.
c. A technological improvement reduces the cost of pollution control.
a. New evidence is discovered about a greater risk of cancer from water pollution.
b. The cost of pollution-control equipment increases.
c. A technological improvement reduces the cost of pollution control.
Unlock Deck
Unlock for access to all 9 flashcards in this deck.
Unlock Deck
k this deck
7
(Market for Pollution Rights) The following graph shows the market for pollution rights.
a. If there are no restrictions on pollution, what amount is discharged?
b. What is the quantity supplied and the quantity demanded if the government restricts the amount of discharge to Q* but gives the permits away?
c. Where is market equilibrium if the government sells the permits? Illustrate this on the graph.
d. What happens to market equilibrium if the gvernment reduces the amount of discharge permitted to Q**? Illustrate this on the graph.
a. If there are no restrictions on pollution, what amount is discharged?
b. What is the quantity supplied and the quantity demanded if the government restricts the amount of discharge to Q* but gives the permits away?
c. Where is market equilibrium if the government sells the permits? Illustrate this on the graph.
d. What happens to market equilibrium if the gvernment reduces the amount of discharge permitted to Q**? Illustrate this on the graph.
Unlock Deck
Unlock for access to all 9 flashcards in this deck.
Unlock Deck
k this deck
8
ENVIRONMENTAL PROTECTION Four federal laws and subsequent amendments underpin U.S. environmental protection. Identify these four laws.
Unlock Deck
Unlock for access to all 9 flashcards in this deck.
Unlock Deck
k this deck
9
POSITIVE EXTERNALITIES The value of a home depends in part on how attractive other homes and yards in the neighborhood are. How do local zoning ordinances try to promote land uses that generate external benefits for neighbors?
Unlock Deck
Unlock for access to all 9 flashcards in this deck.
Unlock Deck
k this deck
Unlock Deck
Unlock for access to all 9 flashcards in this deck.


