Deck 18: Poverty and Redistribution
Full screen (f)
Question
(Distribution of Household Income) Look at the graph below. How would you explain the shift of the U.S. income distribution in the last two decades?
Share of Aggregate Household Income by Quintile 1980-2013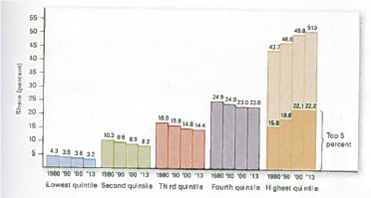
Share of Aggregate Household Income by Quintile 1980-2013
Question
(Lorenz Curve) What is a Lorenz curve? What does the Lorenz curve below illustrate? 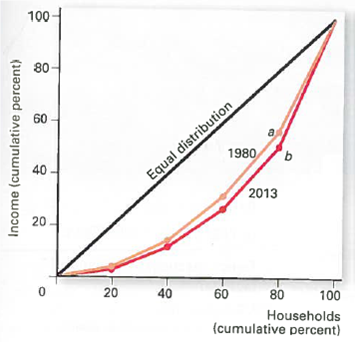
Question
Question
Question
Question
Question
Question
Question

Unlock Deck
Sign up to unlock the cards in this deck!
Unlock Deck
Unlock Deck
1/9
Play
Full screen (f)
Deck 18: Poverty and Redistribution
1
(Distribution of Household Income) Look at the graph below. How would you explain the shift of the U.S. income distribution in the last two decades?
Share of Aggregate Household Income by Quintile 1980-2013
Share of Aggregate Household Income by Quintile 1980-2013
In recent decades (from 1980s onward), the share of income earning by the top fifth has increased, and the share earning by the bottom fifth has declined. The richest fifth's share of income increase from 43.7percent in 1980 to 51.1 percent in 2012. The foremost contributor to the larger share of income earning by the highest group has been the growth of two-earner households in that top group.
Note that in the top quantile, almost three out of the four households have two or more than two people working. A major contributor to the smallest share earned by the lowest group has been the growth of single-parents household in the bottom group.
Because of significant reduction in the major marginal tax rates (in 1981 and 1986), high-income people had no incentive to engage in avoidance of tax, so their reported income increased. This boosted the share of reported income earned by the richest 5 percent of the households.
2
(Lorenz Curve) What is a Lorenz curve? What does the Lorenz curve below illustrate?
The Lorenz curve is a method or way of showing the percentage of total income earned by any given percentage of households when households are grouped from smallest to largest based on income. It is a curve that displays the variance of distribution of income from a level of perfect equality. An example of such Lorenz curve is given in Figure A-1. 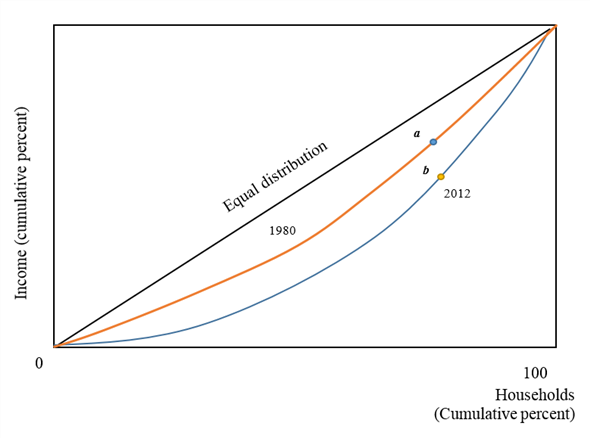 Figure A-1
Point ' a' exhibits that the bottom 80 percent of households received 56.3 percent of total income in the year 1980. Point ' b' displays the share of the total income going to the bottom 80 percent of households was lower in 2012 than in 1980. The Lorenz curve would be a straight line if income were evenly distributed across households.
Figure A-1Point ' a' exhibits that the bottom 80 percent of households received 56.3 percent of total income in the year 1980. Point ' b' displays the share of the total income going to the bottom 80 percent of households was lower in 2012 than in 1980. The Lorenz curve would be a straight line if income were evenly distributed across households.
3
(Poverty Rates Over Time) During what period since 1960 did the U.S. poverty rate fall the most? Why? Which age group has shown the most decline in poverty rates since 1960 and why?
The biggest decline in the poverty rate occurred before 1970, where the poverty rate dropped from 22.4 percent in 1959 to 12.1 percent in 1969. The main reason for such drop is a decline in unemployment and an increase in the income assistance.
During that period, the number of poor people plummeted from almost 40 million to 24 million. After declining from 1994 to 2000, poverty rate rose because of national recession.
In 1959, elderly were the poorest age group. Poverty among them declined to 9.1 percent, well below the rate of 13.7 percent of the age group of 18-64 years of age. This decline in poverty, among the elderly, resulted from the praiseworthy growth of Social Security and Medicare.
4
OFFICIAL POVERTY LEVEL Although the poverty rate among single mothers has decreased since 1960, the number of poor children from such families has more than doubled. Explain.
Unlock Deck
Unlock for access to all 9 flashcards in this deck.
Unlock Deck
k this deck
5
INCOME DIFFERENCES List some reasons why household incomes differ. Which factors are the most important?
Unlock Deck
Unlock for access to all 9 flashcards in this deck.
Unlock Deck
k this deck
6
OFFICIAL POVERTY LEVEL How does the U.S. Department of Agriculture calculate the official poverty level? What government assistance programs does the Census Bureau consider when calculating household income? What programs are ignored?
Unlock Deck
Unlock for access to all 9 flashcards in this deck.
Unlock Deck
k this deck
7
POVERTY AND AGE Poverty among the elderly fell dramatically between 1959 and 1974 and has continued to decline. However, poverty among that portion of the U.S. population that is less than 18 years old is no lower today than in the 1970s. Why have the experiences of these two age groups differed?
Unlock Deck
Unlock for access to all 9 flashcards in this deck.
Unlock Deck
k this deck
8
DISINCENTIVES How does the implicit tax on earned income (in the form of lost benefits from government assistance programs as earned income increases) affect work incentives? How do some people avoid the implicit tax?
Unlock Deck
Unlock for access to all 9 flashcards in this deck.
Unlock Deck
k this deck
9
WELFARE REFORM What has happened to the number of people on welfare since 1994? What best explains the change over time?
Unlock Deck
Unlock for access to all 9 flashcards in this deck.
Unlock Deck
k this deck
Unlock Deck
Unlock for access to all 9 flashcards in this deck.


