Deck 13: Supply Chain Quality Management
Full screen (f)
Question
An owner of a Bronze's Gym recently performed a gap analysis with the SERVQUAL model. The survey was limited to the five PZ…B service quality dimensions. After administering 75 expectations surveys to potential customers and 75 surveys to customers, the owner computed the following means: 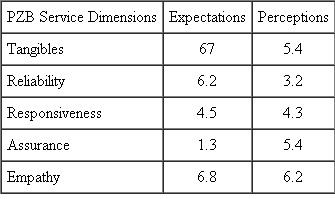 Compute simple differences and make recommendations to management.
Compute simple differences and make recommendations to management. Question
For the data in Problem, create a scatter plot to see if there is a relationship between overtime hours and days absent.
Develop a histogram for the following array of data: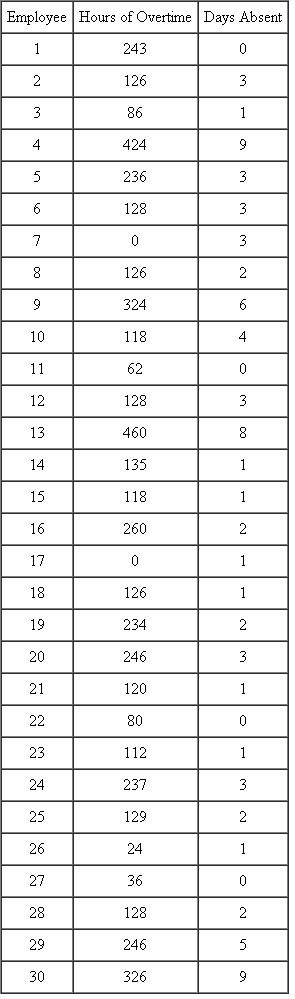
Develop a histogram for the following array of data:
Question
Question
Question
Question
For the following data, develop a Pareto analysis. The letters A, B, C, and D are problems that occur in a process. Which cause should you focus on first? 
Question
Question
Question
Question
Question
Question
Question
Question
Question
Question
Question
Question
Question
Question
Question
Question
Question
The following check sheet has the following data: 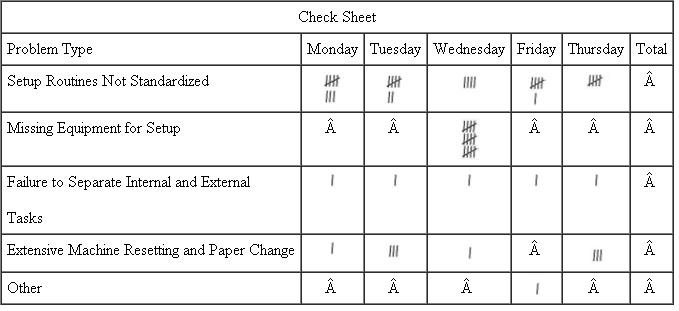 What do you recommend?
What do you recommend? Question
Question
Question
Question
Question
Question
Question
Develop a histogram for the following array of data: 
Question
Question

Unlock Deck
Sign up to unlock the cards in this deck!
Unlock Deck
Unlock Deck
1/32
Play
Full screen (f)
Deck 13: Supply Chain Quality Management
1
An owner of a Bronze's Gym recently performed a gap analysis with the SERVQUAL model. The survey was limited to the five PZ…B service quality dimensions. After administering 75 expectations surveys to potential customers and 75 surveys to customers, the owner computed the following means: Compute simple differences and make recommendations to management.
Compute simple differences and make recommendations to management.SERVQUAL:
SERVQUAL is a tool of service quality. It is the survey, which is used to perform the gap analysis in service industry. When the expectation of the customer is closely aligned with perceived service, then the satisfaction of the customer is high.
It is given that the service dimensions of the service industry and the survey results based on expectation of the customer and the perceived service.
Analyze the survey results:
The recommendation can be made to the management by doing some differences. The simple differencing is as follows:
Tangibles:
Differences between the expected service and perceived service can be computed by subtracting the perceptions from expectation. Thus, the difference between expected and perceived service is
  .
.
Reliability:
Differences between the expected service and perceived service can be computed by subtracting the perceptions from expectation. Thus, the difference between expected and perceived service is
  .
.
Responsiveness:
Differences between the expected service and perceived service can be computed by subtracting the perceptions from expectation. Thus, the difference between expected and perceived service is
  .
.
Assurance:
Differences between the expected service and perceived service can be computed by subtracting the perceptions from expectation. Thus, the difference between expected and perceived service is
  .
.
Empathy:
Differences between the expected service and perceived service can be computed by subtracting the perceptions from expectation. Thus, the difference between expected and perceived service is
  0
0
.
Hence, the management should concentrate more on service reliability. Since, it has the maximum difference, as it does not meet the customer expectation.
SERVQUAL is a tool of service quality. It is the survey, which is used to perform the gap analysis in service industry. When the expectation of the customer is closely aligned with perceived service, then the satisfaction of the customer is high.
It is given that the service dimensions of the service industry and the survey results based on expectation of the customer and the perceived service.
Analyze the survey results:
The recommendation can be made to the management by doing some differences. The simple differencing is as follows:
Tangibles:
Differences between the expected service and perceived service can be computed by subtracting the perceptions from expectation.
Thus, the difference between expected and perceived service is .Reliability:
Differences between the expected service and perceived service can be computed by subtracting the perceptions from expectation.
Thus, the difference between expected and perceived service is .Responsiveness:
Differences between the expected service and perceived service can be computed by subtracting the perceptions from expectation.
Thus, the difference between expected and perceived service is .Assurance:
Differences between the expected service and perceived service can be computed by subtracting the perceptions from expectation.
Thus, the difference between expected and perceived service is .Empathy:
Differences between the expected service and perceived service can be computed by subtracting the perceptions from expectation.
Thus, the difference between expected and perceived service is 0.
Hence, the management should concentrate more on service reliability. Since, it has the maximum difference, as it does not meet the customer expectation.
2
For the data in Problem, create a scatter plot to see if there is a relationship between overtime hours and days absent.
Develop a histogram for the following array of data:
Develop a histogram for the following array of data:
Scatter plot:
Scatter plot is the tool of quality. The relationship between the variables is represented in the graphical form.
It is given that the array of data and it is required to develop the scatter plot.
Develop the scatter plot:
It is given that employee number with the hours of overtime worked with the days absent.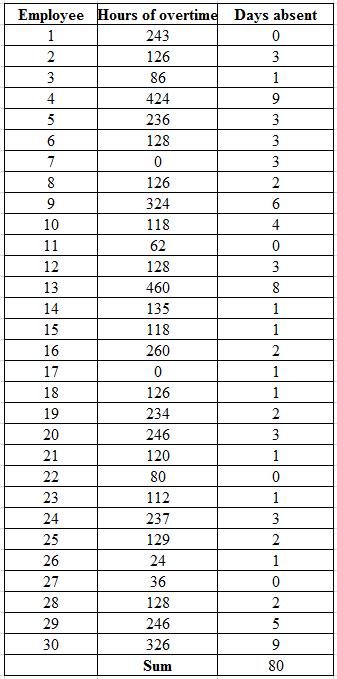 Scatter plot:
Scatter plot for the above data is as follows: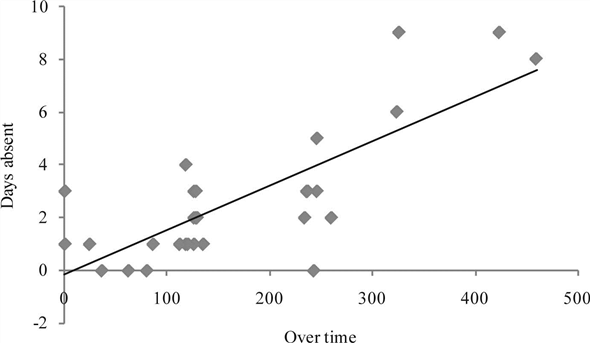
Scatter plot is the tool of quality. The relationship between the variables is represented in the graphical form.
It is given that the array of data and it is required to develop the scatter plot.
Develop the scatter plot:
It is given that employee number with the hours of overtime worked with the days absent.
Scatter plot: Scatter plot for the above data is as follows:
3
What has Toyota done to improve/get worse since this book was written?
Introduction:
Company T faced a crisis due to the fallout of accelerators and many lives were in danger. The problem arose due to cost reductions, which lead to low quality of products. These fallouts and damaged products impaired the reputation of Company T.
The following are the ways by which Company T improved:
Company T used a lean approach for its production system to improve its benchmark. Company T started to use supply chain operations to form a synchronized and integrated system, which will improve the company status. The company managed both strategies and tactics to build an excellent system.
Company T used the supply chain operation in order to get efficiency and balance by focusing on the velocity, visibility, variability, and variety of the product. This supply chain operation used by Company T helped the company to design and manage the improvement of the product.
Conclusion:
Company T has improved itself by using supply chain operation effectively in its production. The company improved itself slowly. However, with the help of lean approach and supply chain operation, company has efficiently developed their reputation with the introduction of improved products.
4
You notice that Deming's point 10 mentions eliminating slogans such as "Zero Defect." However, Crosby's ninth step is to hold a "Zero Defects Day." These points are in disagreement. Who is correct? Why?
Unlock Deck
Unlock for access to all 32 flashcards in this deck.
Unlock Deck
k this deck
5
Hundreds of thousands of firms have implemented ISO 9000. Visit a company near your campus and interview a quality manager. Find answers to the following questions:
How often are you audited?
How often are you audited?
Unlock Deck
Unlock for access to all 32 flashcards in this deck.
Unlock Deck
k this deck
6
For the following data, develop a Pareto analysis. The letters A, B, C, and D are problems that occur in a process. Which cause should you focus on first?
Unlock Deck
Unlock for access to all 32 flashcards in this deck.
Unlock Deck
k this deck
7
In this chapter, we discussed benchmarking and ISO 9000. They are very different approaches to driving improvement in a firm. With a team, reflect on these approaches and try to determine under which conditions you might choose one approach over the other. Consider the following questions to gel started:
Which approach is better for a more mature company?
Which approach is better for a more mature company?
Unlock Deck
Unlock for access to all 32 flashcards in this deck.
Unlock Deck
k this deck
8
Joseph Juran's approach is more strategy based than other approaches. Is it a better approach than Demings? Why or why not?
Unlock Deck
Unlock for access to all 32 flashcards in this deck.
Unlock Deck
k this deck
9
Develop a process map for the following processes:
a. Buying a car
b. Completing a research paper for a class
c- Developing a new course at a university (interview a professor for these steps)
a. Buying a car
b. Completing a research paper for a class
c- Developing a new course at a university (interview a professor for these steps)
Unlock Deck
Unlock for access to all 32 flashcards in this deck.
Unlock Deck
k this deck
10
Create a fishbone diagram to help determine the underly-ing causes for doing poorly in a supply chain and opera-tions class at your university.
Unlock Deck
Unlock for access to all 32 flashcards in this deck.
Unlock Deck
k this deck
11
Looking al Table 13.1, why do you think that Toyota has gotten so much bad press? Do you agree with Toyota that it has been treated unfairly by the press?
Unlock Deck
Unlock for access to all 32 flashcards in this deck.
Unlock Deck
k this deck
12
How does the definition of supply chain quality management differ from the American Society for Quality's definition of quality? Is it helpful to have a definition for supply chain quality management? Why or why not?
Unlock Deck
Unlock for access to all 32 flashcards in this deck.
Unlock Deck
k this deck
13
Hundreds of thousands of firms have implemented ISO 9000. Visit a company near your campus and interview a quality manager. Find answers to the following questions:
How has ISO iniuenced the way that you do business?
How has ISO iniuenced the way that you do business?
Unlock Deck
Unlock for access to all 32 flashcards in this deck.
Unlock Deck
k this deck
14
What is your feeling about the quality of products from China? In your opinion, what steps should the Chinese government take to ameliorate this problem?
Unlock Deck
Unlock for access to all 32 flashcards in this deck.
Unlock Deck
k this deck
15
In this chapter, we discussed benchmarking and ISO 9000. They are very different approaches to driving improvement in a firm. With a team, reflect on these approaches and try to determine under which conditions you might choose one approach over the other. Consider the following questions to gel started:
How would these approaches be useful for a firm that is globalizing?
How would these approaches be useful for a firm that is globalizing?
Unlock Deck
Unlock for access to all 32 flashcards in this deck.
Unlock Deck
k this deck
16
In your mind, who is more at fault for the leaded paint in Fisher-Price toys? Is it Mattel/Fisher-Price, the supplier, or someone else? Is it fair that this problem is seen as a "China" problem by some?
Unlock Deck
Unlock for access to all 32 flashcards in this deck.
Unlock Deck
k this deck
17
For the Problem 2 processes, perform a value analysis to determine which steps are value-added and which are wasteful steps.
Unlock Deck
Unlock for access to all 32 flashcards in this deck.
Unlock Deck
k this deck
18
ISO 9000 refers to a quality management system. What is a quality management system?
Unlock Deck
Unlock for access to all 32 flashcards in this deck.
Unlock Deck
k this deck
19
How do the dimensions of quality help communicate effectively about organizational improvement?
Unlock Deck
Unlock for access to all 32 flashcards in this deck.
Unlock Deck
k this deck
20
Is ISO 9000 a good model for improvement, or is it responsible for the "bureaucratization of quality." Explain.
Unlock Deck
Unlock for access to all 32 flashcards in this deck.
Unlock Deck
k this deck
21
Hundreds of thousands of firms have implemented ISO 9000. Visit a company near your campus and interview a quality manager. Find answers to the following questions:
Is ISO a good model for improvement, or is it too bureaucratic (a bunch of paperwork)?
Is ISO a good model for improvement, or is it too bureaucratic (a bunch of paperwork)?
Unlock Deck
Unlock for access to all 32 flashcards in this deck.
Unlock Deck
k this deck
22
How does customer contact make service quality difficult to manage? Give examples.
Unlock Deck
Unlock for access to all 32 flashcards in this deck.
Unlock Deck
k this deck
23
The following check sheet has the following data: What do you recommend?
What do you recommend? Unlock Deck
Unlock for access to all 32 flashcards in this deck.
Unlock Deck
k this deck
24
Do you agree with the NIST definition of customer-driven excellence in the chapter? Can an overemphasis on customer-driven excellence make a company too reactive instead of proactive? Explain.
Unlock Deck
Unlock for access to all 32 flashcards in this deck.
Unlock Deck
k this deck
25
Although most of us are familiar with major public universities like Michigan. Ohio State, Florida State, and UCLA, we are typically unfamiliar with corporate universities such as Motorola Solutions, Intel University, and the AT…T Learning Center. Corporate universities are a fairly new concept, created to serve the needs of a particular company's employees and other stakeholders.
The term corporate university has been adopted by firms that have significantly upgraded their training and development activities by creating learning centers within their corporations. These learning centers are typically designed to prioritize a firm's training initiatives and to quickly share with a firm's employees the skills, techniques, and best practices that are necessary to remain competitive. For example, when a new quality tool or technique is developed, it is often the responsibility of a firm's corporate university to develop a plan to equip the firm's employees with the skills necessary to quickly incorporate the new tool or techniques into their work areas.
The following is a brief description of two corporate universities. After reading these descriptions, ask yourself the following rhetorical question: Are these corporations well-equipped to teach their employees the tools of quality?
Motorola Solutions: Motorola Solutions began in 1981 as the Motorola Training and Education Center. During the 1980s, the purpose of the university was to help Motorola strengthen its training efforts and build a quality-focused corporate culture. Through the years, the university has grown in both size and stature and now has a staff of more than 400 employees and seven facilities across the world. The stated objectives of Motorola Solutions are as follows:
• To provide training and education to all Motorola employees.
• To prepare Motorola employees to be best in class in their industries.
• To serve as a catalyst for change and continuous improvement to position Motorola Corporation for the future.
• To provide added value to Motorola in the marketing and distribution of products throughout the world.
To accomplish these objectives. Motorola Solutions does many things. For exam-ple, each of the company's employees is required to take a minimum of 40 hours a year of job-relevant training and education. The university also provides its employees con-sulting services in a number of areas, including benchmarking, cycle-time reduction, quality improvement processes, and statistical tools and problem-solving techniques.
One unique aspect of Motorola Solutions is that it reaches beyond the Motorola Corporation. The university provides training and certification programs for Motorola suppliers and also provides consulting services and training for other corporations on a fee basis.
Sears University: Sears University was established in 1994 with the ambitious goal of becoming an intricate part of the company's turnaround efforts. The university was opened with the idea of offering a wide selection of formal training and self-study courses for Sears' employees. In its first year of operation, approximately 10,000 of the company's employees participated in formal programs ranging from one day to one week in duration. Another 4000 employees completed self-study courses each month.
In addition to offering training programs in areas such as merchandising, opera-tions, customer service, and human resources management, Sears University also pro-vides the company's employees programs designed to help them function as change agents and strategic leaders within the corporation. For example, participants in financial management training programs use computer-based simulations to model to the effect of various financial strategies on business unit performance. Particular attention is paid to trying to help employees see the company's operations from the customer's perspective. The courses are taught by seasoned line managers along with professional facilitators and Sears University personnel.
Questions
1. Are corporate universities a good idea? If so, why or why not?
2. In what ways can a corporate university do a better job of teaching a firm's employees the "tools of quality" than traditional training programs?
Unlock Deck
Unlock for access to all 32 flashcards in this deck.
Unlock Deck
k this deck
26
Do you agree with the PZ…B service quality dimensions? Can you think of other dimensions in services?
Unlock Deck
Unlock for access to all 32 flashcards in this deck.
Unlock Deck
k this deck
27
Why do you think Toyota has come to the point where it is now in crisis due to the braking problem? How can it overcome this problem?
Unlock Deck
Unlock for access to all 32 flashcards in this deck.
Unlock Deck
k this deck
28
Hundreds of thousands of firms have implemented ISO 9000. Visit a company near your campus and interview a quality manager. Find answers to the following questions:
How has ISO influenced how you interact with your suppliers?
Report your findings to the class. See if you can identify common themes from different members of class.
How has ISO influenced how you interact with your suppliers?
Report your findings to the class. See if you can identify common themes from different members of class.
Unlock Deck
Unlock for access to all 32 flashcards in this deck.
Unlock Deck
k this deck
29
Hundreds of thousands of firms have implemented ISO 9000. Visit a company near your campus and interview a quality manager. Find answers to the following questions:
How long have you been ISO registered?
How long have you been ISO registered?
Unlock Deck
Unlock for access to all 32 flashcards in this deck.
Unlock Deck
k this deck
30
Develop a histogram for the following array of data:
Unlock Deck
Unlock for access to all 32 flashcards in this deck.
Unlock Deck
k this deck
31
In this chapter, we discussed benchmarking and ISO 9000. They are very different approaches to driving improvement in a firm. With a team, reflect on these approaches and try to determine under which conditions you might choose one approach over the other. Consider the following questions to gel started:
Which approach is better for an early-stage startup business?
Which approach is better for an early-stage startup business?
Unlock Deck
Unlock for access to all 32 flashcards in this deck.
Unlock Deck
k this deck
32
Might any of Demings 14 points be debatable in certain circumstances?
Unlock Deck
Unlock for access to all 32 flashcards in this deck.
Unlock Deck
k this deck
Unlock Deck
Unlock for access to all 32 flashcards in this deck.


