Deck 30: Supply and Demand
Full screen (f)
Question
Question
Question
Question
Question
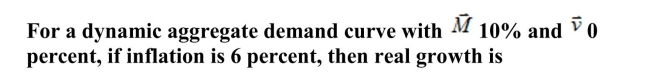
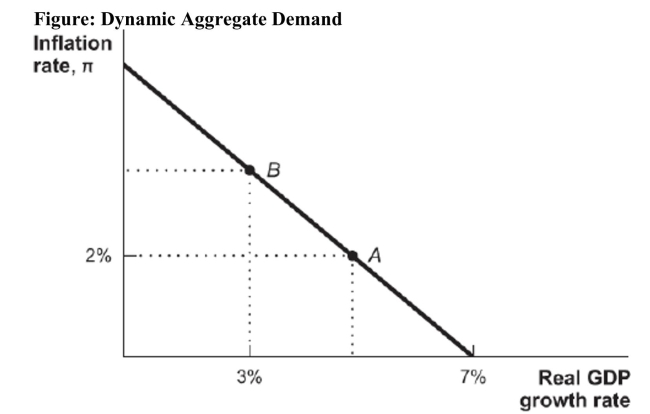 Reference: Ref 13-1 (Figure: Dynamic Aggregate Demand) Point A on this dynamic aggregate demand curve represents a real GDP growth rate of
A) 5 percent.
B) 7 percent.
C) 3 percent.
D) 2 percent.
Question
Question
Question
Question
Question
Question
A) -6 percent.
B) -4 percent.
C) 4 percent.
D) 16 percent.
Question
Question
Question
Question
Question
Figure: Dynamic Aggregate Demand 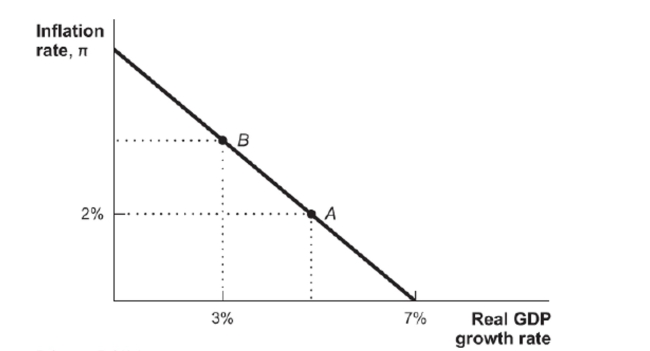 Reference: Ref 13-1 (Figure: Dynamic Aggregate Demand) Point B on this dynamic aggregate demand curve represents an inflation rate of
A) 5 percent.
B) 4 percent.
C) 3 percent.
D) 7 percent.
Reference: Ref 13-1 (Figure: Dynamic Aggregate Demand) Point B on this dynamic aggregate demand curve represents an inflation rate ofA) 5 percent.
B) 4 percent.
C) 3 percent.
D) 7 percent.
Question
Question
Question
Question
Question
(Figure: Dynamic Aggregate Demand Model) Figure: Dynamic Aggregate Demand Model  According to this dynamic aggregate demand model, the Solow growth rate is
A) 12 percent.
B) 3 percent.
C) 4 percent.
D) 8 percent.
According to this dynamic aggregate demand model, the Solow growth rate isA) 12 percent.
B) 3 percent.
C) 4 percent.
D) 8 percent.
Question
Question
Question
Question
Question
Question
Question
Question
Figure: Solow Growth Curves Reference: Ref 13-2 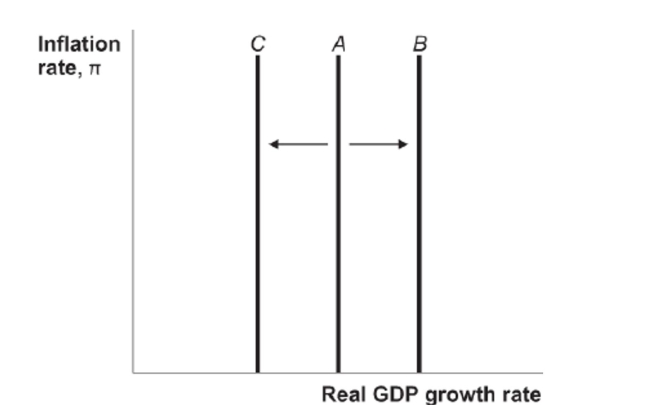 (Figure: Solow Growth Curves) Which of the following answer choices can explain the shift of the Solow growth curve from A to C in the figure?
A) development of new technology
B) an increase in the nation's factors of production
C) negative supply shock
D) increase in oil supply
(Figure: Solow Growth Curves) Which of the following answer choices can explain the shift of the Solow growth curve from A to C in the figure?A) development of new technology
B) an increase in the nation's factors of production
C) negative supply shock
D) increase in oil supply
Question
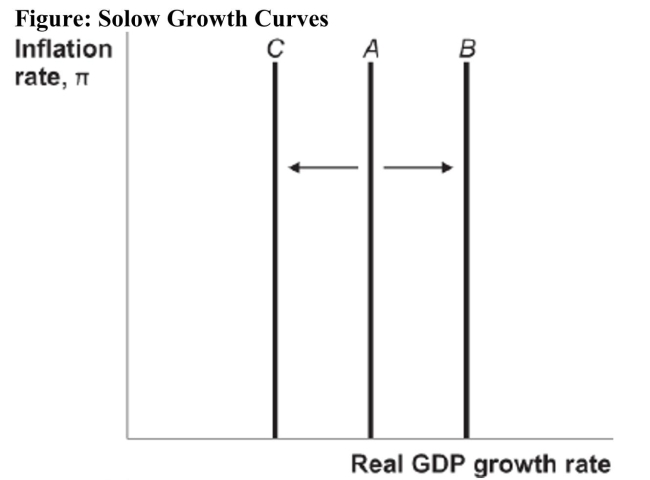 Reference: Ref 13-2 (Figure: Solow Growth Curves) Which of the following choices can explain the shift of the Solow growth curve from A to B in the figure?
A) development of new technology
B) war
C) negative supply shock
D) oil crisis
Question
Question
Question
Question
Question
Question
Question
Question
Question
Question
Question
Question
Question
Question
Question
Question
Question
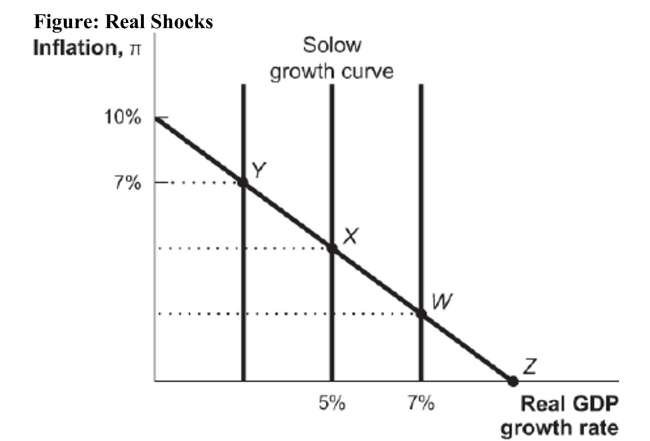 Reference: Ref 13-3 (Figure: Real Shocks) From point X in the accompanying dynamic aggregate demand model, a negative supply shock that still lets the economy grow will change the inflation rate to
A) 3 percent.
B) 7 percent.
C) 5 percent.
D) 10 percent.
Question
Question
Question
Question
Question
Question
Question
Question
Figure: Real Shocks 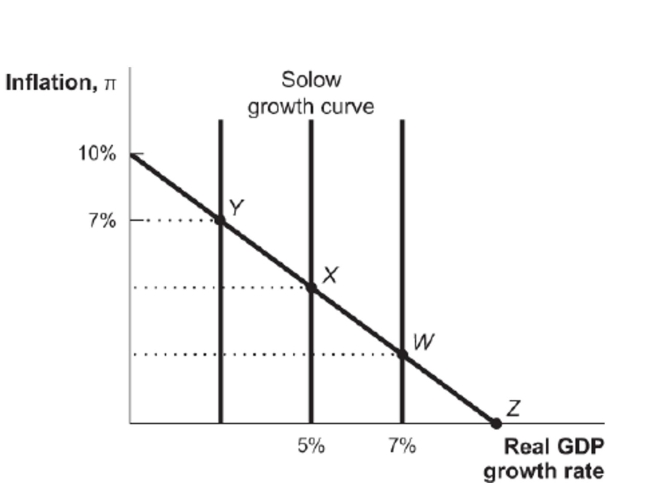 Reference: Ref 13-3 (Figure: Real Shocks) From Point X in the accompanying dynamic aggregate demand model, a negative real shock will cause the economy to move to Point
A) W.
B) X.
C) Y.
D) Z.
Reference: Ref 13-3 (Figure: Real Shocks) From Point X in the accompanying dynamic aggregate demand model, a negative real shock will cause the economy to move to PointA) W.
B) X.
C) Y.
D) Z.
Question
Question
Question
Question
Question
Question
Question
Question
Question
Question
Question
Question
Question
Question
Question
(Figure: Real Output Shock) 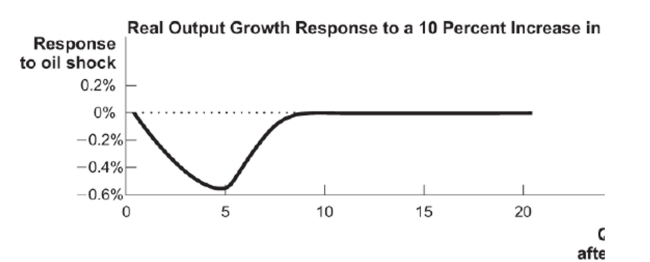 This figure shows how real output growth reacts to a shock of a 10 percent increase in the price of new oil. How long does it take for the economy to return to normal?
A) five quarters
B) five years
C) ten years
D) two and a half years
This figure shows how real output growth reacts to a shock of a 10 percent increase in the price of new oil. How long does it take for the economy to return to normal?A) five quarters
B) five years
C) ten years
D) two and a half years
Question
Question
Question
Question
Question
1271Figure: Oil Market 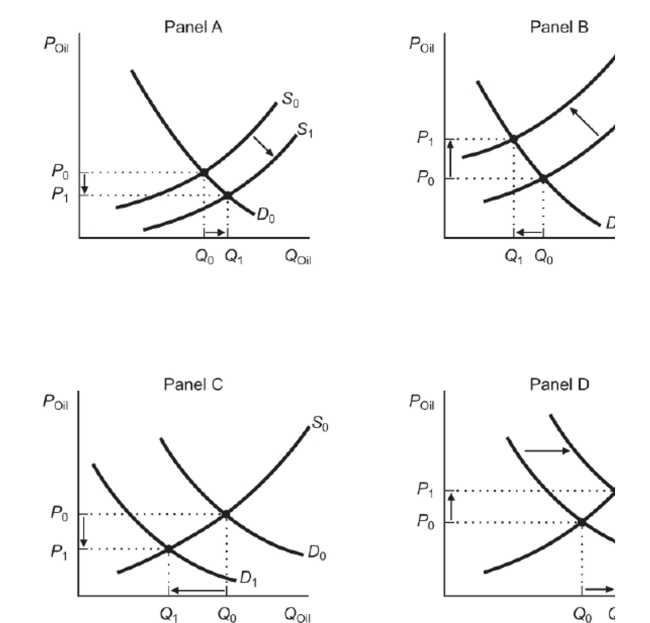 Reference: Ref 13-4 (Figure: Oil Market) Consider the world market for oil represented in the figure. Which of the panels correctly depicts what happened in the market for oil during the 1973 OPEC oil crisis?
A) Panel A
B) Panel B
C) Panel C
D) Panel D
Reference: Ref 13-4 (Figure: Oil Market) Consider the world market for oil represented in the figure. Which of the panels correctly depicts what happened in the market for oil during the 1973 OPEC oil crisis?A) Panel A
B) Panel B
C) Panel C
D) Panel D
Question
Question
Question
Question
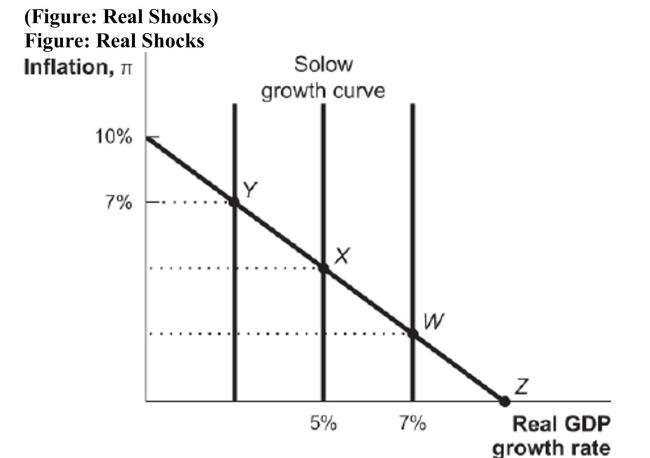 From point X in the accompanying dynamic aggregate demand model, an increase in the supply of oil will cause the economy to move to point
A) W.
B) X.
C) Y.
D) Z.
Question

Unlock Deck
Sign up to unlock the cards in this deck!
Unlock Deck
Unlock Deck
1/183
Play
Full screen (f)
Deck 30: Supply and Demand
1
The aggregate demand curve shows all the combinations of ______ that are consistent with a specified rate of spending growth.
A) employment rates and price levels
B) inflation and real GDP growth rates
C) production shocks and flexible prices
D) money velocity and money supply
A) employment rates and price levels
B) inflation and real GDP growth rates
C) production shocks and flexible prices
D) money velocity and money supply
B
2
Which of the curves listed below is part of the dynamic AD-AS model?
A) the dynamic aggregate demand curve
B) the short-run aggregate supply curve
C) the Solow growth curve
D) Each of these curves is part of the model.
A) the dynamic aggregate demand curve
B) the short-run aggregate supply curve
C) the Solow growth curve
D) Each of these curves is part of the model.
D
3
Business fluctuations are variations in
A) real income (GDP) around its trend growth rate.
B) inflation around its trend growth rate.
C) the unemployment rate around its trend growth rate.
D) mortgage defaults around their trend growth rate.
A) real income (GDP) around its trend growth rate.
B) inflation around its trend growth rate.
C) the unemployment rate around its trend growth rate.
D) mortgage defaults around their trend growth rate.
A
4
Variation of real GDP around the normal growth rate are called
A) business fluctuations.
B) recessions.
C) inflation variations.
D) Solow growth rates.
A) business fluctuations.
B) recessions.
C) inflation variations.
D) Solow growth rates.
Unlock Deck
Unlock for access to all 183 flashcards in this deck.
Unlock Deck
k this deck
5
Reference: Ref 13-1 (Figure: Dynamic Aggregate Demand) Point A on this dynamic aggregate demand curve represents a real GDP growth rate ofA) 5 percent.
B) 7 percent.
C) 3 percent.
D) 2 percent.
Unlock Deck
Unlock for access to all 183 flashcards in this deck.
Unlock Deck
k this deck
6
If the growth rate of money is 3 percent, and the growth rate of velocity is 1 percent, the growth rate of nominal GDP is
A) 4 percent.
B) 1 percent.
C) 0 percent.
D) 2 percent.
A) 4 percent.
B) 1 percent.
C) 0 percent.
D) 2 percent.
Unlock Deck
Unlock for access to all 183 flashcards in this deck.
Unlock Deck
k this deck
7
A recession is defined as a widespread decline in
A) real income (GDP).
B) inflation.
C) unemployment.
D) mortgage defaults.
A) real income (GDP).
B) inflation.
C) unemployment.
D) mortgage defaults.
Unlock Deck
Unlock for access to all 183 flashcards in this deck.
Unlock Deck
k this deck
8
Politicians and especially the general public worry about recessions because of
A) changes in the Solow growth rate.
B) inflation.
C) unemployment.
D) Each of these answers is correct.
A) changes in the Solow growth rate.
B) inflation.
C) unemployment.
D) Each of these answers is correct.
Unlock Deck
Unlock for access to all 183 flashcards in this deck.
Unlock Deck
k this deck
9
During a recession
A) labor is not fully utilized.
B) capital is not fully utilized.
C) land is not fully utilized.
D) Each of these answers is correct.
A) labor is not fully utilized.
B) capital is not fully utilized.
C) land is not fully utilized.
D) Each of these answers is correct.
Unlock Deck
Unlock for access to all 183 flashcards in this deck.
Unlock Deck
k this deck
10
If spending in an economy increases by 3 percent and real GDP increases by 1 percent, the result will be
A) a recession.
B) inflation.
C) a positive supply shock.
D) war.
A) a recession.
B) inflation.
C) a positive supply shock.
D) war.
Unlock Deck
Unlock for access to all 183 flashcards in this deck.
Unlock Deck
k this deck
11
A) -6 percent.
B) -4 percent.
C) 4 percent.
D) 16 percent.
Unlock Deck
Unlock for access to all 183 flashcards in this deck.
Unlock Deck
k this deck
12
The combination of inflation and real growth consistent with a specific rate of spending growth is called the
A) aggregate demand curve.
B) short-run aggregate supply curve.
C) Solow growth curve.
D) endowment curve.
A) aggregate demand curve.
B) short-run aggregate supply curve.
C) Solow growth curve.
D) endowment curve.
Unlock Deck
Unlock for access to all 183 flashcards in this deck.
Unlock Deck
k this deck
13
The average annual rate of growth of real GDP in the United States has fluctuated around ____ for the last 50 years.
A) 1 percent
B) 3 percent
C) 5 percent
D) -1 percent
A) 1 percent
B) 3 percent
C) 5 percent
D) -1 percent
Unlock Deck
Unlock for access to all 183 flashcards in this deck.
Unlock Deck
k this deck
14
Which of the following combinations would be on an aggregate demand curve with a spending growth rate of 6 percent?
A) inflation rate of 3 percent, real growth rate of 6 percent
B) inflation rate of 6 percent, real growth rate of 3 percent
C) inflation rate of 2 percent, real growth rate of 8 percent
D) inflation rate of 8 percent, real growth rate of -2 percent
A) inflation rate of 3 percent, real growth rate of 6 percent
B) inflation rate of 6 percent, real growth rate of 3 percent
C) inflation rate of 2 percent, real growth rate of 8 percent
D) inflation rate of 8 percent, real growth rate of -2 percent
Unlock Deck
Unlock for access to all 183 flashcards in this deck.
Unlock Deck
k this deck
15
The term business fluctuations refers to
A) the different stages of a product cycle.
B) changes in the prices of goods and services over time.
C) movement in real GDP around its long-term trend.
D) the trend in real GDP over a long period of time.
A) the different stages of a product cycle.
B) changes in the prices of goods and services over time.
C) movement in real GDP around its long-term trend.
D) the trend in real GDP over a long period of time.
Unlock Deck
Unlock for access to all 183 flashcards in this deck.
Unlock Deck
k this deck
16
Figure: Dynamic Aggregate Demand Reference: Ref 13-1 (Figure: Dynamic Aggregate Demand) Point B on this dynamic aggregate demand curve represents an inflation rate of
A) 5 percent.
B) 4 percent.
C) 3 percent.
D) 7 percent.
Reference: Ref 13-1 (Figure: Dynamic Aggregate Demand) Point B on this dynamic aggregate demand curve represents an inflation rate ofA) 5 percent.
B) 4 percent.
C) 3 percent.
D) 7 percent.
Unlock Deck
Unlock for access to all 183 flashcards in this deck.
Unlock Deck
k this deck
17
According to the quantity theory of money, if both the growth rate of the money supply and the velocity of money are fixed, then a higher inflation rate means
A) a higher real growth rate.
B) no change in the real growth rate.
C) a lower real growth rate.
D) a higher or lower real growth rate, depending on the specific growth rate of the money supply.
A) a higher real growth rate.
B) no change in the real growth rate.
C) a lower real growth rate.
D) a higher or lower real growth rate, depending on the specific growth rate of the money supply.
Unlock Deck
Unlock for access to all 183 flashcards in this deck.
Unlock Deck
k this deck
18
If both the growth rate and the velocity of the money supply are fixed, then a higher inflation rate will cause
A) an upward movement along the dynamic AD curve.
B) a downward movement along the dynamic AD curve.
C) a shift of the dynamic AD curve to the left.
D) a shift of the dynamic AD curve to the right.
A) an upward movement along the dynamic AD curve.
B) a downward movement along the dynamic AD curve.
C) a shift of the dynamic AD curve to the left.
D) a shift of the dynamic AD curve to the right.
Unlock Deck
Unlock for access to all 183 flashcards in this deck.
Unlock Deck
k this deck
19
If spending growth is 3 percent, and real GDP growth is 2 percent, what is the inflation rate?
A) 3 percent
B) 5 percent
C) 1 percent
D) 2 percent
A) 3 percent
B) 5 percent
C) 1 percent
D) 2 percent
Unlock Deck
Unlock for access to all 183 flashcards in this deck.
Unlock Deck
k this deck
20
If spending growth is 6 percent and inflation is also 6 percent, this means that
A) real GDP did not increase.
B) economic growth was 12 percent.
C) more money is chasing an increased number of goods.
D) a positive supply shock occurred.
A) real GDP did not increase.
B) economic growth was 12 percent.
C) more money is chasing an increased number of goods.
D) a positive supply shock occurred.
Unlock Deck
Unlock for access to all 183 flashcards in this deck.
Unlock Deck
k this deck
21
(Figure: Dynamic Aggregate Demand Model) Figure: Dynamic Aggregate Demand Model According to this dynamic aggregate demand model, the Solow growth rate is
A) 12 percent.
B) 3 percent.
C) 4 percent.
D) 8 percent.
According to this dynamic aggregate demand model, the Solow growth rate isA) 12 percent.
B) 3 percent.
C) 4 percent.
D) 8 percent.
Unlock Deck
Unlock for access to all 183 flashcards in this deck.
Unlock Deck
k this deck
22
The dynamic aggregate demand curve shows a relationship between real GDP growth and the
A) actual inflation rate.
B) expected inflation rate.
C) long-run inflation rate.
D) None of the answers is correct.
A) actual inflation rate.
B) expected inflation rate.
C) long-run inflation rate.
D) None of the answers is correct.
Unlock Deck
Unlock for access to all 183 flashcards in this deck.
Unlock Deck
k this deck
23
The Solow growth rate is the economy's
A) actual growth rate.
B) potential growth rate.
C) expansionary growth rate.
D) recessionary growth rate.
A) actual growth rate.
B) potential growth rate.
C) expansionary growth rate.
D) recessionary growth rate.
Unlock Deck
Unlock for access to all 183 flashcards in this deck.
Unlock Deck
k this deck
24
A real shock causes
A) a shift of the dynamic aggregate demand curve.
B) a shift of both the Solow growth curve and the dynamic aggregate demand curve.
C) a shift of the Solow growth curve.
D) a movement along the Solow growth curve.
A) a shift of the dynamic aggregate demand curve.
B) a shift of both the Solow growth curve and the dynamic aggregate demand curve.
C) a shift of the Solow growth curve.
D) a movement along the Solow growth curve.
Unlock Deck
Unlock for access to all 183 flashcards in this deck.
Unlock Deck
k this deck
25
Suppose both the growth rate of the money supply and the velocity of money are fixed, then an increase in the growth rate of exports will cause
A) an upward movement along the dynamic AD curve.
B) a downward movement along the dynamic AD curve.
C) a shift of the dynamic AD curve to the left.
D) a shift of the dynamic AD curve to the right.
A) an upward movement along the dynamic AD curve.
B) a downward movement along the dynamic AD curve.
C) a shift of the dynamic AD curve to the left.
D) a shift of the dynamic AD curve to the right.
Unlock Deck
Unlock for access to all 183 flashcards in this deck.
Unlock Deck
k this deck
26
The Solow growth rate is the rate of economic growth that occurs when
A) inflation is moderate.
B) prices and wages are sticky.
C) prices and wages are flexible.
D) the money supply is growing.
A) inflation is moderate.
B) prices and wages are sticky.
C) prices and wages are flexible.
D) the money supply is growing.
Unlock Deck
Unlock for access to all 183 flashcards in this deck.
Unlock Deck
k this deck
27
The Solow growth rate occurs when I. prices are flexible. II. all real factors of production are utilized. III. there is money illusion.
A) I and II only
B) II and III only
C) I and III only
D) I, II, and III
A) I and II only
B) II and III only
C) I and III only
D) I, II, and III
Unlock Deck
Unlock for access to all 183 flashcards in this deck.
Unlock Deck
k this deck
28
In a diagram with the inflation rate on the vertical axis and the real growth rate on the horizontal axis, the Solow growth curve is
A) upward sloping.
B) downward sloping.
C) a vertical line at the Solow growth rate.
D) a horizontal line at the zero inflation rate.
A) upward sloping.
B) downward sloping.
C) a vertical line at the Solow growth rate.
D) a horizontal line at the zero inflation rate.
Unlock Deck
Unlock for access to all 183 flashcards in this deck.
Unlock Deck
k this deck
29
Figure: Solow Growth Curves Reference: Ref 13-2 (Figure: Solow Growth Curves) Which of the following answer choices can explain the shift of the Solow growth curve from A to C in the figure?
A) development of new technology
B) an increase in the nation's factors of production
C) negative supply shock
D) increase in oil supply
(Figure: Solow Growth Curves) Which of the following answer choices can explain the shift of the Solow growth curve from A to C in the figure?A) development of new technology
B) an increase in the nation's factors of production
C) negative supply shock
D) increase in oil supply
Unlock Deck
Unlock for access to all 183 flashcards in this deck.
Unlock Deck
k this deck
30
Reference: Ref 13-2 (Figure: Solow Growth Curves) Which of the following choices can explain the shift of the Solow growth curve from A to B in the figure?A) development of new technology
B) war
C) negative supply shock
D) oil crisis
Unlock Deck
Unlock for access to all 183 flashcards in this deck.
Unlock Deck
k this deck
31
The Solow growth curve is represented by a vertical line at the Solow growth rate because I. it does not depend on the rate of inflation. II. there is an underlying assumption of strong money neutrality. III. it does not depend on the stock of factors of production.
A) I only
B) I and II only
C) II and III only
D) I and III only
A) I only
B) I and II only
C) II and III only
D) I and III only
Unlock Deck
Unlock for access to all 183 flashcards in this deck.
Unlock Deck
k this deck
32
The dynamic aggregate demand curve is
A) upward sloping.
B) downward sloping.
C) a vertical line.
D) a horizontal line.
A) upward sloping.
B) downward sloping.
C) a vertical line.
D) a horizontal line.
Unlock Deck
Unlock for access to all 183 flashcards in this deck.
Unlock Deck
k this deck
33
An increase in spending growth will cause the dynamic aggregate demand curve to
A) shift inward.
B) shift outwarB.
C) not shift at all.
D) shift randomly.
A) shift inward.
B) shift outwarB.
C) not shift at all.
D) shift randomly.
Unlock Deck
Unlock for access to all 183 flashcards in this deck.
Unlock Deck
k this deck
34
The Solow growth curve is
A) upward sloping.
B) downward sloping.
C) a vertical line.
D) a horizontal line.
A) upward sloping.
B) downward sloping.
C) a vertical line.
D) a horizontal line.
Unlock Deck
Unlock for access to all 183 flashcards in this deck.
Unlock Deck
k this deck
35
A major hurricane hitting the East Coast of the United States is an example of a
A) real shock.
B) geographic distress.
C) GDP deflator.
D) productivity neutralizing event.
A) real shock.
B) geographic distress.
C) GDP deflator.
D) productivity neutralizing event.
Unlock Deck
Unlock for access to all 183 flashcards in this deck.
Unlock Deck
k this deck
36
An increase in inflation will cause the Solow growth curve to
A) shift inward.
B) shift outward.
C) not shift at all.
D) shift randomly.
A) shift inward.
B) shift outward.
C) not shift at all.
D) shift randomly.
Unlock Deck
Unlock for access to all 183 flashcards in this deck.
Unlock Deck
k this deck
37
If prices are perfectly flexible, the economy will always be growing
A) at its potential rate.
B) above its potential rate.
C) below its potential rate.
D) near its potential rate.
A) at its potential rate.
B) above its potential rate.
C) below its potential rate.
D) near its potential rate.
Unlock Deck
Unlock for access to all 183 flashcards in this deck.
Unlock Deck
k this deck
38
When inflation is 4 percent and the real GDP growth rate is 2 percent, what is the aggregate demand curve spending growth rate?
A) -2 percent
B) 2 percent
C) 6 percent
D) 8 percent
A) -2 percent
B) 2 percent
C) 6 percent
D) 8 percent
Unlock Deck
Unlock for access to all 183 flashcards in this deck.
Unlock Deck
k this deck
39
Holding everything else constant, an increase in the growth rate of the money supply will cause the dynamic aggregate demand curve to
A) shift inward.
B) shift outward.
C) not shift at all.
D) shift randomly.
A) shift inward.
B) shift outward.
C) not shift at all.
D) shift randomly.
Unlock Deck
Unlock for access to all 183 flashcards in this deck.
Unlock Deck
k this deck
40
Other things held constant, an increase in the velocity of money will cause the dynamic aggregate demand curve to
A) shift inward.
B) shift outward.
C) not shift at all.
D) shift randomly.
A) shift inward.
B) shift outward.
C) not shift at all.
D) shift randomly.
Unlock Deck
Unlock for access to all 183 flashcards in this deck.
Unlock Deck
k this deck
41
A negative real shock causes the Solow growth curve to shift
A) up.
B) down.
C) left.
D) right.
A) up.
B) down.
C) left.
D) right.
Unlock Deck
Unlock for access to all 183 flashcards in this deck.
Unlock Deck
k this deck
42
How has the role of agricultural production changed in the Indian economy?
A) It has become a greater part of GDP, due to technological advances.
B) It has remained about 40 percent of GDP, but has doubled in yield.
C) It has fallen to about 20 percent of GDP due to economic diversification.
D) It is now only 1 percent of GDP.
A) It has become a greater part of GDP, due to technological advances.
B) It has remained about 40 percent of GDP, but has doubled in yield.
C) It has fallen to about 20 percent of GDP due to economic diversification.
D) It is now only 1 percent of GDP.
Unlock Deck
Unlock for access to all 183 flashcards in this deck.
Unlock Deck
k this deck
43
Using the AD and Solow growth curve model, the internet revolution of the 1990s caused
A) both real growth and inflation to increase.
B) both real growth and inflation to decrease.
C) real growth to increase and inflation to decrease.
D) real growth to decrease and inflation to increase.
A) both real growth and inflation to increase.
B) both real growth and inflation to decrease.
C) real growth to increase and inflation to decrease.
D) real growth to decrease and inflation to increase.
Unlock Deck
Unlock for access to all 183 flashcards in this deck.
Unlock Deck
k this deck
44
What portion of GDP does agriculture in the United States currently generate?
A) around 1 percent
B) 10 percent
C) 20 percent
D) over 40 percent
A) around 1 percent
B) 10 percent
C) 20 percent
D) over 40 percent
Unlock Deck
Unlock for access to all 183 flashcards in this deck.
Unlock Deck
k this deck
45
A hurricane that damages buildings and roadways in the Gulf Coast is considered a
A) positive shock to the economy.
B) negative shock to the economy.
C) negative transmission mechanism.
D) positive transmission mechanism.
A) positive shock to the economy.
B) negative shock to the economy.
C) negative transmission mechanism.
D) positive transmission mechanism.
Unlock Deck
Unlock for access to all 183 flashcards in this deck.
Unlock Deck
k this deck
46
Which of the following most likely causes a shift of the Solow growth curve to the right?
A) an increase in the money supply
B) a decrease in tax revenues
C) an increase in crop production due to more rainfall
D) an increase in oil prices due to a fire in a major oil refinery
A) an increase in the money supply
B) a decrease in tax revenues
C) an increase in crop production due to more rainfall
D) an increase in oil prices due to a fire in a major oil refinery
Unlock Deck
Unlock for access to all 183 flashcards in this deck.
Unlock Deck
k this deck
47
Reference: Ref 13-3 (Figure: Real Shocks) From point X in the accompanying dynamic aggregate demand model, a negative supply shock that still lets the economy grow will change the inflation rate toA) 3 percent.
B) 7 percent.
C) 5 percent.
D) 10 percent.
Unlock Deck
Unlock for access to all 183 flashcards in this deck.
Unlock Deck
k this deck
48
Which of the following can shift the Solow growth curve?
A) wars
B) increases in technology
C) strikes
D) Each of these answers is correct.
A) wars
B) increases in technology
C) strikes
D) Each of these answers is correct.
Unlock Deck
Unlock for access to all 183 flashcards in this deck.
Unlock Deck
k this deck
49
Since 1980, shocks to rainfall are becoming less economically important for India's GDP. Which of the following explains why this is the case?
A) Agriculture is becoming a smaller part of the India's GDP.
B) India no longer produces agricultural items, but has shifted all those resources to producing Bollywood movies.
C) Rainfall patterns have changed, causing fewer disruptions.
D) Each of these answers is correct.
A) Agriculture is becoming a smaller part of the India's GDP.
B) India no longer produces agricultural items, but has shifted all those resources to producing Bollywood movies.
C) Rainfall patterns have changed, causing fewer disruptions.
D) Each of these answers is correct.
Unlock Deck
Unlock for access to all 183 flashcards in this deck.
Unlock Deck
k this deck
50
Solow growth rates fluctuate over time because of
A) real shocks.
B) changes in the rate of inflation.
C) monetary shocks.
D) Each of these answers is correct.
A) real shocks.
B) changes in the rate of inflation.
C) monetary shocks.
D) Each of these answers is correct.
Unlock Deck
Unlock for access to all 183 flashcards in this deck.
Unlock Deck
k this deck
51
A real shock is any shock that increases or decreases the growth rate of
A) nominal GDP.
B) real GDP.
C) potential GDP.
D) All of the answers are correct.
A) nominal GDP.
B) real GDP.
C) potential GDP.
D) All of the answers are correct.
Unlock Deck
Unlock for access to all 183 flashcards in this deck.
Unlock Deck
k this deck
52
A decrease in oil prices is an example of
A) a negative productivity shock.
B) a positive productivity shock.
C) a neutral productivity shock.
D) a deflationary productivity shock.
A) a negative productivity shock.
B) a positive productivity shock.
C) a neutral productivity shock.
D) a deflationary productivity shock.
Unlock Deck
Unlock for access to all 183 flashcards in this deck.
Unlock Deck
k this deck
53
Historically, rainfall shocks in India correlate well with
A) agricultural output and real GDP.
B) inflation and employment.
C) prices and aggregate demand.
D) money velocity and money supply.
A) agricultural output and real GDP.
B) inflation and employment.
C) prices and aggregate demand.
D) money velocity and money supply.
Unlock Deck
Unlock for access to all 183 flashcards in this deck.
Unlock Deck
k this deck
54
What are some different transmission mechanisms through which negative agricultural shocks affect India's GDP? I. Declines in agricultural output reduce GDP. II. A fall in agricultural output causes lower incomes for farmers who consume fewer goods and services causing GDP to fall even further. III. Declines in the agricultural sector cause declines in the purchases of agricultural equipment.
A) I only
B) I and II only
C) II and III only
D) I, II, and III
A) I only
B) I and II only
C) II and III only
D) I, II, and III
Unlock Deck
Unlock for access to all 183 flashcards in this deck.
Unlock Deck
k this deck
55
Figure: Real Shocks Reference: Ref 13-3 (Figure: Real Shocks) From Point X in the accompanying dynamic aggregate demand model, a negative real shock will cause the economy to move to Point
A) W.
B) X.
C) Y.
D) Z.
Reference: Ref 13-3 (Figure: Real Shocks) From Point X in the accompanying dynamic aggregate demand model, a negative real shock will cause the economy to move to PointA) W.
B) X.
C) Y.
D) Z.
Unlock Deck
Unlock for access to all 183 flashcards in this deck.
Unlock Deck
k this deck
56
A negative real shock causes
A) a lower inflation rate and a lower real growth rate.
B) a lower inflation rate and a higher real growth rate.
C) a higher inflation rate and a lower real growth rate.
D) a higher inflation rate and a higher real growth rate.
A) a lower inflation rate and a lower real growth rate.
B) a lower inflation rate and a higher real growth rate.
C) a higher inflation rate and a lower real growth rate.
D) a higher inflation rate and a higher real growth rate.
Unlock Deck
Unlock for access to all 183 flashcards in this deck.
Unlock Deck
k this deck
57
All of the following are examples of shocks EXCEPT
A) an increase in sales tax revenues due to population growth.
B) a major decline in the price of oil due to the discovery of new oil reserves in Alaska.
C) a drought in California that reduces the supply of crops.
D) a strike in the airline industry.
A) an increase in sales tax revenues due to population growth.
B) a major decline in the price of oil due to the discovery of new oil reserves in Alaska.
C) a drought in California that reduces the supply of crops.
D) a strike in the airline industry.
Unlock Deck
Unlock for access to all 183 flashcards in this deck.
Unlock Deck
k this deck
58
A positive real shock causes a shift of the
A) Solow growth curve to the right.
B) Solow growth curve to the left.
C) aggregate demand curve to the right.
D) aggregate demand curve to the left.
A) Solow growth curve to the right.
B) Solow growth curve to the left.
C) aggregate demand curve to the right.
D) aggregate demand curve to the left.
Unlock Deck
Unlock for access to all 183 flashcards in this deck.
Unlock Deck
k this deck
59
Beginning from an equilibrium in an AD-Solow growth curve model, a negative supply shock will cause
A) both real growth and inflation to increase.
B) both real growth and inflation to decrease.
C) real growth to increase and inflation to decrease.
D) real growth to decrease and inflation to increase.
A) both real growth and inflation to increase.
B) both real growth and inflation to decrease.
C) real growth to increase and inflation to decrease.
D) real growth to decrease and inflation to increase.
Unlock Deck
Unlock for access to all 183 flashcards in this deck.
Unlock Deck
k this deck
60
Which of the following is a shock that could shift the Solow growth curve?
A) productivity shock
B) negative supply shock
C) real shock
D) All of the answers are correct.
A) productivity shock
B) negative supply shock
C) real shock
D) All of the answers are correct.
Unlock Deck
Unlock for access to all 183 flashcards in this deck.
Unlock Deck
k this deck
61
The increase in oil prices that took place during the mid-2000s were driven mainly by
A) decreases in supply.
B) increases in demand.
C) increases in both supply and demand.
D) increases in supply and decreases in demand.
A) decreases in supply.
B) increases in demand.
C) increases in both supply and demand.
D) increases in supply and decreases in demand.
Unlock Deck
Unlock for access to all 183 flashcards in this deck.
Unlock Deck
k this deck
62
Why have oil shocks become less economically important for the United States in recent years?
A) American producers are now more energy efficient.
B) Negative oil shocks have been tempered by positive productivity shocks, such as improvements in technology.
C) The Federal Reserve has become better at responding to oil shocks.
D) Each of these answers is correct.
A) American producers are now more energy efficient.
B) Negative oil shocks have been tempered by positive productivity shocks, such as improvements in technology.
C) The Federal Reserve has become better at responding to oil shocks.
D) Each of these answers is correct.
Unlock Deck
Unlock for access to all 183 flashcards in this deck.
Unlock Deck
k this deck
63
Incorrect
B) Oil consumption has stayed steady, but GDP has more than doubled since 1970.
C) Spikes in oil prices will not lead to as severe recessions in the United States today as they did in the 1970s.
D) America is still purchasing 1.3 barrels of oil per $1,000 of GDP and saving the remainder for the future.
Unlock Deck
Unlock for access to all 183 flashcards in this deck.
Unlock Deck
k this deck
64
Which of the following does NOT represent a shock that can affect GDP?
A) productivity shocks
B) weather shocks
C) changes in the portion of income that consumers save as a whole
D) None of the answers represents such a shock.
A) productivity shocks
B) weather shocks
C) changes in the portion of income that consumers save as a whole
D) None of the answers represents such a shock.
Unlock Deck
Unlock for access to all 183 flashcards in this deck.
Unlock Deck
k this deck
65
In 1970 1.3 barrels of oil produced $1,000 of GDP. In 2004 it took only 0.64 barrels of oil. What implications does this have for economic fluctuations in the United States today?
Unlock Deck
Unlock for access to all 183 flashcards in this deck.
Unlock Deck
k this deck
66
A reduction in the supply of oil is a real shock because it
A) makes gasoline more expensive for consumers.
B) raises the profits of oil producers.
C) makes labor and capital less productive.
D) reduces the amount of oil consumption.
A) makes gasoline more expensive for consumers.
B) raises the profits of oil producers.
C) makes labor and capital less productive.
D) reduces the amount of oil consumption.
Unlock Deck
Unlock for access to all 183 flashcards in this deck.
Unlock Deck
k this deck
67
An economy can overcome a large negative oil shock faster if what occurs?
A) technological advancement
B) additional rainfall
C) monetary authorities react very little
D) None of the answers is correct.
A) technological advancement
B) additional rainfall
C) monetary authorities react very little
D) None of the answers is correct.
Unlock Deck
Unlock for access to all 183 flashcards in this deck.
Unlock Deck
k this deck
68
Productivity in a manufacturing economy could be significantly affected by
A) a rainfall shock.
B) a weather shock.
C) an oil shock.
D) None of the answers is correct.
A) a rainfall shock.
B) a weather shock.
C) an oil shock.
D) None of the answers is correct.
Unlock Deck
Unlock for access to all 183 flashcards in this deck.
Unlock Deck
k this deck
69
The first oil shock to have a large impact on the U.S. economy came in
A) 1973.
B) 1977.
C) 2005.
D) 2007.
A) 1973.
B) 1977.
C) 2005.
D) 2007.
Unlock Deck
Unlock for access to all 183 flashcards in this deck.
Unlock Deck
k this deck
70
(Figure: Real Output Shock) This figure shows how real output growth reacts to a shock of a 10 percent increase in the price of new oil. How long does it take for the economy to return to normal?
A) five quarters
B) five years
C) ten years
D) two and a half years
This figure shows how real output growth reacts to a shock of a 10 percent increase in the price of new oil. How long does it take for the economy to return to normal?A) five quarters
B) five years
C) ten years
D) two and a half years
Unlock Deck
Unlock for access to all 183 flashcards in this deck.
Unlock Deck
k this deck
71
When did the first oil shock occur in the United States?
A) 1946
B) 1970
C) 1973
D) 1981
A) 1946
B) 1970
C) 1973
D) 1981
Unlock Deck
Unlock for access to all 183 flashcards in this deck.
Unlock Deck
k this deck
72
The increase in real oil prices since 2002 did not immediately cause a U.S. recession. Which of the following is NOT a reason for this?
A) More fuel-efficient cars meant the United States consumed much less oil than in previous decades.
B) The price increases were mainly due to increased demand and were expected.
C) Positive technology shocks balanced the negative oil shocks.
D) The Federal Reserve was able to counteract some aspects of the negative oil shocks.
Unlock Deck
Unlock for access to all 183 flashcards in this deck.
Unlock Deck
k this deck
73
The five most recent U.S. recessions
A) preceded positive oil price shocks.
B) were preceded by negative oil price shocks.
C) were not related to oil price shocks.
D) were milder because of oil price shocks.
A) preceded positive oil price shocks.
B) were preceded by negative oil price shocks.
C) were not related to oil price shocks.
D) were milder because of oil price shocks.
Unlock Deck
Unlock for access to all 183 flashcards in this deck.
Unlock Deck
k this deck
74
In response to a negative oil price shock, real GDP growth:
A) rises and never returns to its initial level.
B) falls and never returns to its initial level.
C) first rises and then falls back to its initial level.
D) first falls and then rises back to its initial level.
A) rises and never returns to its initial level.
B) falls and never returns to its initial level.
C) first rises and then falls back to its initial level.
D) first falls and then rises back to its initial level.
Unlock Deck
Unlock for access to all 183 flashcards in this deck.
Unlock Deck
k this deck
75
1271Figure: Oil Market Reference: Ref 13-4 (Figure: Oil Market) Consider the world market for oil represented in the figure. Which of the panels correctly depicts what happened in the market for oil during the 1973 OPEC oil crisis?
A) Panel A
B) Panel B
C) Panel C
D) Panel D
Reference: Ref 13-4 (Figure: Oil Market) Consider the world market for oil represented in the figure. Which of the panels correctly depicts what happened in the market for oil during the 1973 OPEC oil crisis?A) Panel A
B) Panel B
C) Panel C
D) Panel D
Unlock Deck
Unlock for access to all 183 flashcards in this deck.
Unlock Deck
k this deck
76
High oil prices tend to
A) increase the demand for some products and reduce the demand for others.
B) increase the demand for all products.
C) reduce the demand for all products.
D) shift the economy's AD curve outward.
A) increase the demand for some products and reduce the demand for others.
B) increase the demand for all products.
C) reduce the demand for all products.
D) shift the economy's AD curve outward.
Unlock Deck
Unlock for access to all 183 flashcards in this deck.
Unlock Deck
k this deck
77
When a war breaks out in the Middle East and causes an oil shock, what makes the shock so costly to deal with?
A) There is uncertainty on how long the war will last.
B) The economic shock is unexpected.
C) Many countries experience the shock at the same time.
D) Agricultural productivity plummets.
A) There is uncertainty on how long the war will last.
B) The economic shock is unexpected.
C) Many countries experience the shock at the same time.
D) Agricultural productivity plummets.
Unlock Deck
Unlock for access to all 183 flashcards in this deck.
Unlock Deck
k this deck
78
How has the price of oil generally been related to recessions in the United States?
A) Falling oil prices have produced a recession either in the next quarter or at the same time as the price fall.
B) Rising oil prices for at least two years have produced a recession.
C) If oil prices rise and fall within a year there will be a recession.
D) Rising oil prices have produced a recession either concurrently or quickly thereafter.
Unlock Deck
Unlock for access to all 183 flashcards in this deck.
Unlock Deck
k this deck
79
From point X in the accompanying dynamic aggregate demand model, an increase in the supply of oil will cause the economy to move to pointA) W.
B) X.
C) Y.
D) Z.
Unlock Deck
Unlock for access to all 183 flashcards in this deck.
Unlock Deck
k this deck
80
Which of the following best describes some of the profound effects of the 1973 oil crisis on the U.S. economy? I. Consumer preferences moved away from big cars and towards smaller cars. II. Employment in car manufacturing firms increased significantly. III. Although oil prices rose, gasoline prices fell since the two are substitutes.
A) I only
B) I and II only
C) II and III only
D) I, II, and III
A) I only
B) I and II only
C) II and III only
D) I, II, and III
Unlock Deck
Unlock for access to all 183 flashcards in this deck.
Unlock Deck
k this deck
Unlock Deck
Unlock for access to all 183 flashcards in this deck.


