Deck 2: Thinking Like an Economist
Full screen (f)
Question
Question
Question
Question
Question
Question
Question
Question
Question
Question
Question
Question
Question
Question
Question
Graph 2-1
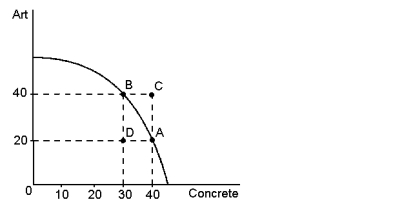
Refer to Graph 2-1. In the graph shown, points A, B and C represent feasible or attainable outcomes for society.
Refer to Graph 2-1. In the graph shown, points A, B and C represent feasible or attainable outcomes for society.
Question
Graph 2-1
Refer to Graph 2-1. In the graph shown, points A, B and D represent efficient outcomes for society.
Refer to Graph 2-1. In the graph shown, points A, B and D represent efficient outcomes for society.
Question
Question
Question
Question
Question
Graph 2-1
Refer to Graph 2-1. In the graph shown, the opportunity cost to the economy of moving from point A to point B is 20 units of concrete.
Refer to Graph 2-1. In the graph shown, the opportunity cost to the economy of moving from point A to point B is 20 units of concrete.
Question
Question
Question
Question
Question
Question
Question
Question
Question
Question
Question
Question
Question
Question
Question
Graph 2-1
Refer to Graph 2-1. In the graph shown, the opportunity cost of more art increases as more art is produced.
Refer to Graph 2-1. In the graph shown, the opportunity cost of more art increases as more art is produced.
Question
Question
Graph 2-1
Refer to Graph 2-1. In the graph shown, the opportunity cost of moving from point D to point B is 20 pieces of art.
Refer to Graph 2-1. In the graph shown, the opportunity cost of moving from point D to point B is 20 pieces of art.
Question
Question
Question
Graph 2-2
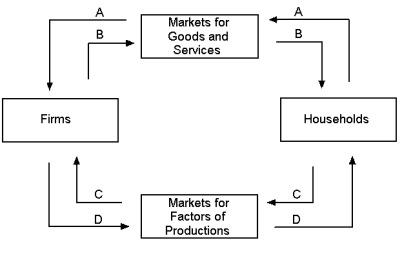
Refer to Graph 2-2. In the circular-flow diagram shown, which arrow shows the flow of income payments?
A) A
B) B
C) C
D) D
Refer to Graph 2-2. In the circular-flow diagram shown, which arrow shows the flow of income payments?
A) A
B) B
C) C
D) D
Question
Question
Question
Graph 2-2
Refer to Graph 2-2. In the circular-flow diagram shown, which arrow shows the flow of the inputs for production?
A) A
B) B
C) C
D) D
Refer to Graph 2-2. In the circular-flow diagram shown, which arrow shows the flow of the inputs for production?
A) A
B) B
C) C
D) D
Question
Question
Question
Question
Question
Question
Question
Graph 2-2
Refer to Graph 2-2. In the circular-flow diagram shown, which arrow shows the flow of spending by households?
A) A
B) B
C) C
D) D
Refer to Graph 2-2. In the circular-flow diagram shown, which arrow shows the flow of spending by households?
A) A
B) B
C) C
D) D
Question
Question
Question
Question
Question
Question
Question
Question
Graph 2-2
Refer to Graph 2-2. In the circular-flow diagram shown, which arrow shows the flow of goods and services?
A) A
B) B
C) C
D) D
Refer to Graph 2-2. In the circular-flow diagram shown, which arrow shows the flow of goods and services?
A) A
B) B
C) C
D) D
Question
Question
Graph 2-3
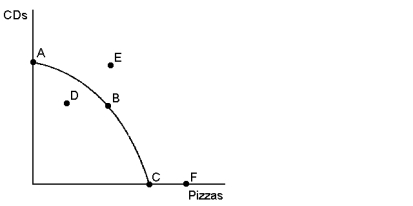
Refer to Graph 2-3. On the production possibilities frontier shown, at which point or points is the economy inefficient?
A) A, B, C
B) E, F
C) B
D) D
Refer to Graph 2-3. On the production possibilities frontier shown, at which point or points is the economy inefficient?
A) A, B, C
B) E, F
C) B
D) D
Question
Graph 2-3
Refer to Graph 2-3. On the production possibilities frontier shown, what does point F represent?
A) an infeasible production point
B) the amount of pizzas that would be produced if the economy only produced pizzas
C) an inefficient outcome
D) the outcome if nothing were to be produced
Refer to Graph 2-3. On the production possibilities frontier shown, what does point F represent?
A) an infeasible production point
B) the amount of pizzas that would be produced if the economy only produced pizzas
C) an inefficient outcome
D) the outcome if nothing were to be produced
Question
Graph 2-4
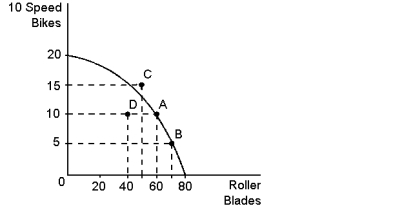
Refer to Graph 2-4. On the production possibilities frontier shown, the opportunity cost to the economy of getting 10 additional roller blades by moving from point A to point B is:
A) 15 bikes
B) 10 bikes
C) five bikes
D) impossible to know without knowing the cost of the resources used to produce the additional roller blades
Question
Graph 2-4
Refer to Graph 2-4. On the production possibilities frontier shown, the opportunity cost of getting five additional bikes by moving from point A to point C is:
A) 15 roller blades
B) 10 roller blades
C) five roller blades
D) it is impossible for the economy to move from point A to point C
Refer to Graph 2-4. On the production possibilities frontier shown, the opportunity cost of getting five additional bikes by moving from point A to point C is:
A) 15 roller blades
B) 10 roller blades
C) five roller blades
D) it is impossible for the economy to move from point A to point C
Question
Graph 2-6
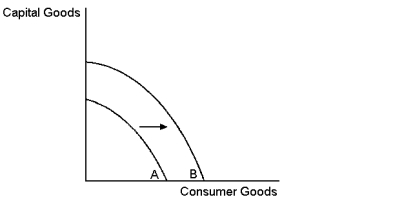
Refer to Graph 2-6. In the graph shown, the movement from frontier A to B can best be described as:
A) economic growth
B) a disaster for society
C) an improvement in income distribution
D) an improvement in the allocation of resources
Refer to Graph 2-6. In the graph shown, the movement from frontier A to B can best be described as:
A) economic growth
B) a disaster for society
C) an improvement in income distribution
D) an improvement in the allocation of resources
Question
Graph 2-4
Refer to Graph 2-4. On the production possibilities frontier shown, the opportunity cost of moving from point A to point D is:
A) five bikes and 40 roller blades
B) zero bikes and 20 roller blades
C) five bikes and 20 roller blades
D) zero bikes and 40 roller blades
Refer to Graph 2-4. On the production possibilities frontier shown, the opportunity cost of moving from point A to point D is:
A) five bikes and 40 roller blades
B) zero bikes and 20 roller blades
C) five bikes and 20 roller blades
D) zero bikes and 40 roller blades
Question
Table 2-1

Refer to Table 2-1. What is the opportunity cost to Poland of increasing the production of Vodka from 430 to 850?
A) 140 kg potatoes
B) 500 kg potatoes
C) 400 kg potatoes
D) 300 kg potatoes
Refer to Table 2-1. What is the opportunity cost to Poland of increasing the production of Vodka from 430 to 850?
A) 140 kg potatoes
B) 500 kg potatoes
C) 400 kg potatoes
D) 300 kg potatoes
Question
Table 2-1
Refer to Table 2-1. What is the opportunity cost of increasing the production of potatoes from 900 kg to 1200 kg?
A) 255l vodka
B) 200l vodka
C) 150l vodka
D) 175l vodka
Refer to Table 2-1. What is the opportunity cost of increasing the production of potatoes from 900 kg to 1200 kg?
A) 255l vodka
B) 200l vodka
C) 150l vodka
D) 175l vodka
Question
Table 2-1
Refer to Table 2-1. What is the most accurate statement about the opportunity cost of producing an additional 25 litres of vodka in Poland?
A) the opportunity cost of an additional 25 litres of vodka is 30kg of potatoes
B) the opportunity cost of an additional 25 litres of vodka changes depending on how many potatoes are produced
C) it is impossible to determine the opportunity cost of an additional 25 litres of vodka
D) the opportunity cost of an additional 25 litres of vodka increases as more potatoes are produced
Question
Graph 2-6
Refer to Graph 2-6. According to the graph, the shift of the production possibilities frontier from frontier A to frontier B was most likely caused by which of the following?
A) an improvement in the technology of producing capital goods
B) an improvement in the technology of producing consumer goods
C) a general improvement in technology
D) a reduction in the availability of resources
Question
Question
Graph 2-3
Refer to Graph 2-3. On the production possibilities frontier shown, at which point or points is the economy efficient?
A) A, B, C
B) A, C, F
C) E
D) D
Refer to Graph 2-3. On the production possibilities frontier shown, at which point or points is the economy efficient?
A) A, B, C
B) A, C, F
C) E
D) D
Question
Question
Graph 2-7
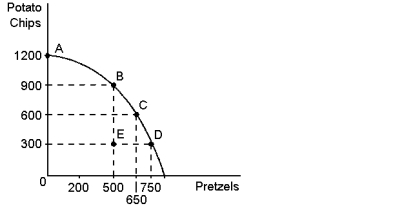
Refer to Graph 2-7. What is the opportunity cost to society of the movement from point C to point B, given the production possibilities frontier shown?
A) 650 pretzels
B) 500 pretzels
C) 300 pretzels
D) 150 pretzels
Refer to Graph 2-7. What is the opportunity cost to society of the movement from point C to point B, given the production possibilities frontier shown?
A) 650 pretzels
B) 500 pretzels
C) 300 pretzels
D) 150 pretzels
Question
Question
Graph 2-3
Refer to Graph 2-3. On the production possibilities frontier shown, which point represents the maximum possible production of CDs?
A) A
B) B
C) C
D) D
Refer to Graph 2-3. On the production possibilities frontier shown, which point represents the maximum possible production of CDs?
A) A
B) B
C) C
D) D
Question
Graph 2-5

Refer to Graph 2-5. In the production possibilities frontier shown, the shift of the frontier from A to B was most likely caused by which of the following?
A) more capital available in the economy
B) more labour available in the economy
C) a general technological breakthrough
D) technological improvement in the production of clothing
Question
Graph 2-7
Refer to Graph 2-7. In the production possibilities frontier shown, what is the opportunity cost to society of moving from point C to point E?
A) 150 pretzels
B) 300 potato chips
C) both A and B
D) zero
Refer to Graph 2-7. In the production possibilities frontier shown, what is the opportunity cost to society of moving from point C to point E?
A) 150 pretzels
B) 300 potato chips
C) both A and B
D) zero
Question
Graph 2-7
Refer to Graph 2-7. In the production possibilities frontier unemployment most likely caused a movement from:
A) A to B
B) B to D
C) C to D
D) C to E
Refer to Graph 2-7. In the production possibilities frontier unemployment most likely caused a movement from:
A) A to B
B) B to D
C) C to D
D) C to E
Question
Graph 2-3
Refer to Graph 2-3. On the production possibilities frontier shown, at which point or points is it possible for this economy to produce?
A) A, B, C, D
B) A, B, C, F
C) A, B, C, D, E, F
D) D
Refer to Graph 2-3. On the production possibilities frontier shown, at which point or points is it possible for this economy to produce?
A) A, B, C, D
B) A, B, C, F
C) A, B, C, D, E, F
D) D

Unlock Deck
Sign up to unlock the cards in this deck!
Unlock Deck
Unlock Deck
1/103
Play
Full screen (f)
Deck 2: Thinking Like an Economist
1
The efficient production points for the production possibilities frontier, all lie on the actual frontier itself.
True
2
An economy is being efficient if it is impossible to produce more of one good without producing less of another.
True
3
In a circular-flow diagram, one loop shows the flow of real goods and services and the other loop shows the corresponding flow of dollars.
True
4
Most economic theories have been developed and tested by using controlled experiments.
Unlock Deck
Unlock for access to all 103 flashcards in this deck.
Unlock Deck
k this deck
5
Any point inside the production possibilities frontier is an efficient one.
Unlock Deck
Unlock for access to all 103 flashcards in this deck.
Unlock Deck
k this deck
6
A circular-flow diagram is a simple, equation-based model of how an economy is organised.
Unlock Deck
Unlock for access to all 103 flashcards in this deck.
Unlock Deck
k this deck
7
Both scientists and economists make assumptions to simplify their analysis.
Unlock Deck
Unlock for access to all 103 flashcards in this deck.
Unlock Deck
k this deck
8
In the circular-flow diagram, the only return households get from supplying factors of production to firms are wages.
Unlock Deck
Unlock for access to all 103 flashcards in this deck.
Unlock Deck
k this deck
9
In a circular-flow diagram, spending on goods and services flows from households to firms and income flows from firms to households.
Unlock Deck
Unlock for access to all 103 flashcards in this deck.
Unlock Deck
k this deck
10
All scientific models, including economic models, simplify reality in order to improve our understanding of it.
Unlock Deck
Unlock for access to all 103 flashcards in this deck.
Unlock Deck
k this deck
11
The difference between natural scientists and economists is that natural scientists do not use simplifying assumptions in their models.
Unlock Deck
Unlock for access to all 103 flashcards in this deck.
Unlock Deck
k this deck
12
Understanding how an economic system works is aided by the use of many complex and rigorous, true assumptions.
Unlock Deck
Unlock for access to all 103 flashcards in this deck.
Unlock Deck
k this deck
13
Scientific models are designed to simplify reality because they are built with simplifying assumptions.
Unlock Deck
Unlock for access to all 103 flashcards in this deck.
Unlock Deck
k this deck
14
The art in scientific thinking is in deciding which assumptions to make.
Unlock Deck
Unlock for access to all 103 flashcards in this deck.
Unlock Deck
k this deck
15
Graph 2-1
Refer to Graph 2-1. In the graph shown, points A, B and C represent feasible or attainable outcomes for society.
Refer to Graph 2-1. In the graph shown, points A, B and C represent feasible or attainable outcomes for society.
Unlock Deck
Unlock for access to all 103 flashcards in this deck.
Unlock Deck
k this deck
16
Graph 2-1
Refer to Graph 2-1. In the graph shown, points A, B and D represent efficient outcomes for society.
Refer to Graph 2-1. In the graph shown, points A, B and D represent efficient outcomes for society.
Unlock Deck
Unlock for access to all 103 flashcards in this deck.
Unlock Deck
k this deck
17
In a simple circular-flow diagram, the two types of markets in which households and firms interact are the markets for goods and services and the markets for factors of production.
Unlock Deck
Unlock for access to all 103 flashcards in this deck.
Unlock Deck
k this deck
18
The production possibilities frontier illustrates that it is not possible for an economy to produce an output that is outside the frontier.
Unlock Deck
Unlock for access to all 103 flashcards in this deck.
Unlock Deck
k this deck
19
A production possibilities frontier is a graph that shows the various combinations of outputs the economy can possibly produce, given its factors of production and technology.
Unlock Deck
Unlock for access to all 103 flashcards in this deck.
Unlock Deck
k this deck
20
In the circular-flow model, the markets for goods and services, as in the markets for the factors of production, households are buyers and firms are sellers.
Unlock Deck
Unlock for access to all 103 flashcards in this deck.
Unlock Deck
k this deck
21
Graph 2-1
Refer to Graph 2-1. In the graph shown, the opportunity cost to the economy of moving from point A to point B is 20 units of concrete.
Refer to Graph 2-1. In the graph shown, the opportunity cost to the economy of moving from point A to point B is 20 units of concrete.
Unlock Deck
Unlock for access to all 103 flashcards in this deck.
Unlock Deck
k this deck
22
According to John Maynard Keynes, an economist should only give advice based on disinterested observations.
Unlock Deck
Unlock for access to all 103 flashcards in this deck.
Unlock Deck
k this deck
23
The circular-flow diagram and the production possibilities frontier both illustrate opportunity cost, economic growth and efficiency.
Unlock Deck
Unlock for access to all 103 flashcards in this deck.
Unlock Deck
k this deck
24
Inflation is a microeconomic issue because it affects what households decide to buy.
Unlock Deck
Unlock for access to all 103 flashcards in this deck.
Unlock Deck
k this deck
25
Consider the statement 'banning the export of live parrots from Australia has resulted in the black market price for cockatoos rising and an increase in poaching'. This is an example of a normative statement.
Unlock Deck
Unlock for access to all 103 flashcards in this deck.
Unlock Deck
k this deck
26
If computers become easier to produce because of technological improvements, then producing more computers will mean a larger trade-off in the production of other goods.
Unlock Deck
Unlock for access to all 103 flashcards in this deck.
Unlock Deck
k this deck
27
Microeconomics is the study of decision making at the level of the individual household and firm, while macroeconomics is the study of the economy as a whole.
Unlock Deck
Unlock for access to all 103 flashcards in this deck.
Unlock Deck
k this deck
28
Which of the following does economics NOT attempt to do?
A) study the past to learn lessons for the future
B) devise theories, collect data, then analyse the data to test the theories
C) use assumptions to make the world easier to understand
D) conduct laboratory experiments that exactly replicate the real world
A) study the past to learn lessons for the future
B) devise theories, collect data, then analyse the data to test the theories
C) use assumptions to make the world easier to understand
D) conduct laboratory experiments that exactly replicate the real world
Unlock Deck
Unlock for access to all 103 flashcards in this deck.
Unlock Deck
k this deck
29
Normative statements are essentially value judgements about the issue being considered.
Unlock Deck
Unlock for access to all 103 flashcards in this deck.
Unlock Deck
k this deck
30
Given a two-good production possibilities frontier, an increase in the economy's productivity will cause the frontier to shift outward.
Unlock Deck
Unlock for access to all 103 flashcards in this deck.
Unlock Deck
k this deck
31
Assumptions are sometimes necessary because:
A) controlled experiments need to reflect the way things happen in real life
B) there are often many factors in an analysis and it helps to focus our thinking
C) every model is different and that must be explained clearly
D) short-term effects differ from long-term effects
A) controlled experiments need to reflect the way things happen in real life
B) there are often many factors in an analysis and it helps to focus our thinking
C) every model is different and that must be explained clearly
D) short-term effects differ from long-term effects
Unlock Deck
Unlock for access to all 103 flashcards in this deck.
Unlock Deck
k this deck
32
Australia harvests five to seven million kangaroos a year. Consider the statement 'Australia would be better off if the harvest of kangaroos was banned'. This is an example of a normative statement.
Unlock Deck
Unlock for access to all 103 flashcards in this deck.
Unlock Deck
k this deck
33
Sometimes economists who have the same positive views about how the economy works give conflicting advice on policy because they have different values.
Unlock Deck
Unlock for access to all 103 flashcards in this deck.
Unlock Deck
k this deck
34
Treating everyone equitably is a common value shared by all economists.
Unlock Deck
Unlock for access to all 103 flashcards in this deck.
Unlock Deck
k this deck
35
The scientific method can best be defined as:
A) the use of modern laboratory equipment to discover scientific laws
B) the careful design of controlled experiments to test theories about how the world works
C) the unbiased development of and testing of theories about how the world works
D) the selective search for evidence that supports preconceived theories of how the world works
Unlock Deck
Unlock for access to all 103 flashcards in this deck.
Unlock Deck
k this deck
36
Graph 2-1
Refer to Graph 2-1. In the graph shown, the opportunity cost of more art increases as more art is produced.
Refer to Graph 2-1. In the graph shown, the opportunity cost of more art increases as more art is produced.
Unlock Deck
Unlock for access to all 103 flashcards in this deck.
Unlock Deck
k this deck
37
Normative statements describe how the world is, while positive statements prescribe how the world should be.
Unlock Deck
Unlock for access to all 103 flashcards in this deck.
Unlock Deck
k this deck
38
Graph 2-1
Refer to Graph 2-1. In the graph shown, the opportunity cost of moving from point D to point B is 20 pieces of art.
Refer to Graph 2-1. In the graph shown, the opportunity cost of moving from point D to point B is 20 pieces of art.
Unlock Deck
Unlock for access to all 103 flashcards in this deck.
Unlock Deck
k this deck
39
Economists try to avoid looking at history in case it will unduly influence their judgment.
Unlock Deck
Unlock for access to all 103 flashcards in this deck.
Unlock Deck
k this deck
40
The parameters chosen by economists may be a reason why differences of judgements result from the same issue.
Unlock Deck
Unlock for access to all 103 flashcards in this deck.
Unlock Deck
k this deck
41
Graph 2-2
Refer to Graph 2-2. In the circular-flow diagram shown, which arrow shows the flow of income payments?
A) A
B) B
C) C
D) D
Refer to Graph 2-2. In the circular-flow diagram shown, which arrow shows the flow of income payments?
A) A
B) B
C) C
D) D
Unlock Deck
Unlock for access to all 103 flashcards in this deck.
Unlock Deck
k this deck
42
The production possibilities frontier is a:
A) graph that shows the various combinations of output the economy can possibly produce, given the available resources and technology
B) graph that shows the various combinations of resources the economy can possibly produce, given the available output
C) graph that shows the various combinations of concrete the economy can possibly produce, given the available agricultural land
D) graph that shows the various combinations of wheat the economy can possibly produce, given the available cement
Unlock Deck
Unlock for access to all 103 flashcards in this deck.
Unlock Deck
k this deck
43
In a circular-flow diagram:
A) households sell goods and services to the factors of production
B) firms incur wages, rent and profit from households
C) the factors of production are bought by the firms and sold by households
D) firms sell goods and services as well as factors of production
A) households sell goods and services to the factors of production
B) firms incur wages, rent and profit from households
C) the factors of production are bought by the firms and sold by households
D) firms sell goods and services as well as factors of production
Unlock Deck
Unlock for access to all 103 flashcards in this deck.
Unlock Deck
k this deck
44
Graph 2-2
Refer to Graph 2-2. In the circular-flow diagram shown, which arrow shows the flow of the inputs for production?
A) A
B) B
C) C
D) D
Refer to Graph 2-2. In the circular-flow diagram shown, which arrow shows the flow of the inputs for production?
A) A
B) B
C) C
D) D
Unlock Deck
Unlock for access to all 103 flashcards in this deck.
Unlock Deck
k this deck
45
The rationale for using assumptions in economics is:
A) it avoids having to collect any data
B) it is a useful way to ensure models are as realistic as possible
C) because economics is not a science
D) that it makes the world easier to understand
A) it avoids having to collect any data
B) it is a useful way to ensure models are as realistic as possible
C) because economics is not a science
D) that it makes the world easier to understand
Unlock Deck
Unlock for access to all 103 flashcards in this deck.
Unlock Deck
k this deck
46
Economists use models in order to:
A) develop insights into how the economy works
B) develop insights into mathematical theorems
C) make economics hard for students to understand
D) help businesses decide what investments will be profitable
A) develop insights into how the economy works
B) develop insights into mathematical theorems
C) make economics hard for students to understand
D) help businesses decide what investments will be profitable
Unlock Deck
Unlock for access to all 103 flashcards in this deck.
Unlock Deck
k this deck
47
If an economist develops a theory about international trade based on the assumption that there are only two countries and two goods:
A) the theory can be useful only in situations involving two countries and two goods
B) it is a total waste of time, since the actual world has many countries trading many goods
C) the theory can help explain trade involving many countries and many goods
D) the theory can be useful in the classroom, but has no use in the real world
Unlock Deck
Unlock for access to all 103 flashcards in this deck.
Unlock Deck
k this deck
48
If Lauren builds a circular-flow diagram including markets for goods and services, markets for factors of production and firms, will the model be able to accurately represent a simple economy?
A) No, it is missing the government
B) No, it is missing international trade
C) No, it is missing households
D) Yes, it includes all the key actors
A) No, it is missing the government
B) No, it is missing international trade
C) No, it is missing households
D) Yes, it includes all the key actors
Unlock Deck
Unlock for access to all 103 flashcards in this deck.
Unlock Deck
k this deck
49
Which of the following is the most accurate statement about economic models?
A) economic models attempt to mirror reality as closely as possible
B) economic models are useful, but should not be used for policymaking
C) economic models cannot be used in the real world because they omit details
D) economic models omit many details to allow us to see what is important
A) economic models attempt to mirror reality as closely as possible
B) economic models are useful, but should not be used for policymaking
C) economic models cannot be used in the real world because they omit details
D) economic models omit many details to allow us to see what is important
Unlock Deck
Unlock for access to all 103 flashcards in this deck.
Unlock Deck
k this deck
50
An economic outcome is said to be efficient if the economy is:
A) using all of the resources it has available, which means producing on the production possibilities frontier
B) conserving resources and not using all it has, which means producing on the production possibilities frontier
C) using all of the resources it has available, which means producing inside the production possibilities frontier
D) conserving resources and not using all it has, which means producing inside the production possibilities frontier
Unlock Deck
Unlock for access to all 103 flashcards in this deck.
Unlock Deck
k this deck
51
Graph 2-2
Refer to Graph 2-2. In the circular-flow diagram shown, which arrow shows the flow of spending by households?
A) A
B) B
C) C
D) D
Refer to Graph 2-2. In the circular-flow diagram shown, which arrow shows the flow of spending by households?
A) A
B) B
C) C
D) D
Unlock Deck
Unlock for access to all 103 flashcards in this deck.
Unlock Deck
k this deck
52
In constructing models, economists must:
A) employ simplifying assumptions
B) include as much detail as possible
C) exclude as much detail as possible
D) employ simplifying presumptions
A) employ simplifying assumptions
B) include as much detail as possible
C) exclude as much detail as possible
D) employ simplifying presumptions
Unlock Deck
Unlock for access to all 103 flashcards in this deck.
Unlock Deck
k this deck
53
The art of scientific thinking involves:
A) deciding which assumptions to make
B) understanding every scientific discipline
C) knowing which presumptions to make
D) being able to mathematically express natural forces
A) deciding which assumptions to make
B) understanding every scientific discipline
C) knowing which presumptions to make
D) being able to mathematically express natural forces
Unlock Deck
Unlock for access to all 103 flashcards in this deck.
Unlock Deck
k this deck
54
The circular-flow diagram is a type of simple model that:
A) illustrates the carbon-cycle in forestry economic models
B) illustrates how an economy is organised between key sectors
C) shows how fish stocks grow and replenish from harvest
D) shows the money flows that are managed by the banking system
A) illustrates the carbon-cycle in forestry economic models
B) illustrates how an economy is organised between key sectors
C) shows how fish stocks grow and replenish from harvest
D) shows the money flows that are managed by the banking system
Unlock Deck
Unlock for access to all 103 flashcards in this deck.
Unlock Deck
k this deck
55
Data to test economic theories generally come from:
A) laboratory experiments undertaken in strict, controlled conditions
B) personal introspection
C) public opinion surveys
D) observations from previous episodes of economic change
A) laboratory experiments undertaken in strict, controlled conditions
B) personal introspection
C) public opinion surveys
D) observations from previous episodes of economic change
Unlock Deck
Unlock for access to all 103 flashcards in this deck.
Unlock Deck
k this deck
56
The circular flow diagram illustrates the:
A) flow of goods and services from households to firms
B) flow of spending on goods and services from households to firms
C) flow of factors of production from firms to households
D) flow of spending on goods and services flows from firms to households
A) flow of goods and services from households to firms
B) flow of spending on goods and services from households to firms
C) flow of factors of production from firms to households
D) flow of spending on goods and services flows from firms to households
Unlock Deck
Unlock for access to all 103 flashcards in this deck.
Unlock Deck
k this deck
57
In the circular-flow diagram:
A) firms are sellers in the resource market and the product market
B) households are sellers in the resource market
C) firms are buyers in the product market
D) spending on goods and services flow from firms to households
A) firms are sellers in the resource market and the product market
B) households are sellers in the resource market
C) firms are buyers in the product market
D) spending on goods and services flow from firms to households
Unlock Deck
Unlock for access to all 103 flashcards in this deck.
Unlock Deck
k this deck
58
Factors of production are:
A) inputs into the production process
B) weather, social and political conditions that affect production
C) the physical relationships between economic inputs and outputs
D) the mathematical calculations firms make to determine production
A) inputs into the production process
B) weather, social and political conditions that affect production
C) the physical relationships between economic inputs and outputs
D) the mathematical calculations firms make to determine production
Unlock Deck
Unlock for access to all 103 flashcards in this deck.
Unlock Deck
k this deck
59
Graph 2-2
Refer to Graph 2-2. In the circular-flow diagram shown, which arrow shows the flow of goods and services?
A) A
B) B
C) C
D) D
Refer to Graph 2-2. In the circular-flow diagram shown, which arrow shows the flow of goods and services?
A) A
B) B
C) C
D) D
Unlock Deck
Unlock for access to all 103 flashcards in this deck.
Unlock Deck
k this deck
60
The foundation stones from which economic models are built are:
A) economic policies
B) presumptions
C) assumptions
D) statistical forecasts
A) economic policies
B) presumptions
C) assumptions
D) statistical forecasts
Unlock Deck
Unlock for access to all 103 flashcards in this deck.
Unlock Deck
k this deck
61
Graph 2-3
Refer to Graph 2-3. On the production possibilities frontier shown, at which point or points is the economy inefficient?
A) A, B, C
B) E, F
C) B
D) D
Refer to Graph 2-3. On the production possibilities frontier shown, at which point or points is the economy inefficient?
A) A, B, C
B) E, F
C) B
D) D
Unlock Deck
Unlock for access to all 103 flashcards in this deck.
Unlock Deck
k this deck
62
Graph 2-3
Refer to Graph 2-3. On the production possibilities frontier shown, what does point F represent?
A) an infeasible production point
B) the amount of pizzas that would be produced if the economy only produced pizzas
C) an inefficient outcome
D) the outcome if nothing were to be produced
Refer to Graph 2-3. On the production possibilities frontier shown, what does point F represent?
A) an infeasible production point
B) the amount of pizzas that would be produced if the economy only produced pizzas
C) an inefficient outcome
D) the outcome if nothing were to be produced
Unlock Deck
Unlock for access to all 103 flashcards in this deck.
Unlock Deck
k this deck
63
Graph 2-4
Refer to Graph 2-4. On the production possibilities frontier shown, the opportunity cost to the economy of getting 10 additional roller blades by moving from point A to point B is:
A) 15 bikes
B) 10 bikes
C) five bikes
D) impossible to know without knowing the cost of the resources used to produce the additional roller blades
Unlock Deck
Unlock for access to all 103 flashcards in this deck.
Unlock Deck
k this deck
64
Graph 2-4
Refer to Graph 2-4. On the production possibilities frontier shown, the opportunity cost of getting five additional bikes by moving from point A to point C is:
A) 15 roller blades
B) 10 roller blades
C) five roller blades
D) it is impossible for the economy to move from point A to point C
Refer to Graph 2-4. On the production possibilities frontier shown, the opportunity cost of getting five additional bikes by moving from point A to point C is:
A) 15 roller blades
B) 10 roller blades
C) five roller blades
D) it is impossible for the economy to move from point A to point C
Unlock Deck
Unlock for access to all 103 flashcards in this deck.
Unlock Deck
k this deck
65
Graph 2-6
Refer to Graph 2-6. In the graph shown, the movement from frontier A to B can best be described as:
A) economic growth
B) a disaster for society
C) an improvement in income distribution
D) an improvement in the allocation of resources
Refer to Graph 2-6. In the graph shown, the movement from frontier A to B can best be described as:
A) economic growth
B) a disaster for society
C) an improvement in income distribution
D) an improvement in the allocation of resources
Unlock Deck
Unlock for access to all 103 flashcards in this deck.
Unlock Deck
k this deck
66
Graph 2-4
Refer to Graph 2-4. On the production possibilities frontier shown, the opportunity cost of moving from point A to point D is:
A) five bikes and 40 roller blades
B) zero bikes and 20 roller blades
C) five bikes and 20 roller blades
D) zero bikes and 40 roller blades
Refer to Graph 2-4. On the production possibilities frontier shown, the opportunity cost of moving from point A to point D is:
A) five bikes and 40 roller blades
B) zero bikes and 20 roller blades
C) five bikes and 20 roller blades
D) zero bikes and 40 roller blades
Unlock Deck
Unlock for access to all 103 flashcards in this deck.
Unlock Deck
k this deck
67
Table 2-1
Refer to Table 2-1. What is the opportunity cost to Poland of increasing the production of Vodka from 430 to 850?
A) 140 kg potatoes
B) 500 kg potatoes
C) 400 kg potatoes
D) 300 kg potatoes
Refer to Table 2-1. What is the opportunity cost to Poland of increasing the production of Vodka from 430 to 850?
A) 140 kg potatoes
B) 500 kg potatoes
C) 400 kg potatoes
D) 300 kg potatoes
Unlock Deck
Unlock for access to all 103 flashcards in this deck.
Unlock Deck
k this deck
68
Table 2-1
Refer to Table 2-1. What is the opportunity cost of increasing the production of potatoes from 900 kg to 1200 kg?
A) 255l vodka
B) 200l vodka
C) 150l vodka
D) 175l vodka
Refer to Table 2-1. What is the opportunity cost of increasing the production of potatoes from 900 kg to 1200 kg?
A) 255l vodka
B) 200l vodka
C) 150l vodka
D) 175l vodka
Unlock Deck
Unlock for access to all 103 flashcards in this deck.
Unlock Deck
k this deck
69
Table 2-1
Refer to Table 2-1. What is the most accurate statement about the opportunity cost of producing an additional 25 litres of vodka in Poland?
A) the opportunity cost of an additional 25 litres of vodka is 30kg of potatoes
B) the opportunity cost of an additional 25 litres of vodka changes depending on how many potatoes are produced
C) it is impossible to determine the opportunity cost of an additional 25 litres of vodka
D) the opportunity cost of an additional 25 litres of vodka increases as more potatoes are produced
Unlock Deck
Unlock for access to all 103 flashcards in this deck.
Unlock Deck
k this deck
70
Graph 2-6
Refer to Graph 2-6. According to the graph, the shift of the production possibilities frontier from frontier A to frontier B was most likely caused by which of the following?
A) an improvement in the technology of producing capital goods
B) an improvement in the technology of producing consumer goods
C) a general improvement in technology
D) a reduction in the availability of resources
Unlock Deck
Unlock for access to all 103 flashcards in this deck.
Unlock Deck
k this deck
71
In the production possibilities frontier model, production is inefficient if the production point is:
A) inside the frontier
B) outside the frontier
C) on or outside the frontier
D) on or inside the frontier
A) inside the frontier
B) outside the frontier
C) on or outside the frontier
D) on or inside the frontier
Unlock Deck
Unlock for access to all 103 flashcards in this deck.
Unlock Deck
k this deck
72
Graph 2-3
Refer to Graph 2-3. On the production possibilities frontier shown, at which point or points is the economy efficient?
A) A, B, C
B) A, C, F
C) E
D) D
Refer to Graph 2-3. On the production possibilities frontier shown, at which point or points is the economy efficient?
A) A, B, C
B) A, C, F
C) E
D) D
Unlock Deck
Unlock for access to all 103 flashcards in this deck.
Unlock Deck
k this deck
73
Microeconomics approaches the study of economics from the viewpoint of:
A) consumer behaviour
B) the labour market
C) government taxation and spending policies
D) the entire economy
A) consumer behaviour
B) the labour market
C) government taxation and spending policies
D) the entire economy
Unlock Deck
Unlock for access to all 103 flashcards in this deck.
Unlock Deck
k this deck
74
Graph 2-7
Refer to Graph 2-7. What is the opportunity cost to society of the movement from point C to point B, given the production possibilities frontier shown?
A) 650 pretzels
B) 500 pretzels
C) 300 pretzels
D) 150 pretzels
Refer to Graph 2-7. What is the opportunity cost to society of the movement from point C to point B, given the production possibilities frontier shown?
A) 650 pretzels
B) 500 pretzels
C) 300 pretzels
D) 150 pretzels
Unlock Deck
Unlock for access to all 103 flashcards in this deck.
Unlock Deck
k this deck
75
An economy is said to be efficient if it is:
A) possible to produce more of all goods
B) possible to produce more of one good without producing less of another
C) not possible to produce more of one good without producing less of another
D) not possible to produce more of one good at any cost
A) possible to produce more of all goods
B) possible to produce more of one good without producing less of another
C) not possible to produce more of one good without producing less of another
D) not possible to produce more of one good at any cost
Unlock Deck
Unlock for access to all 103 flashcards in this deck.
Unlock Deck
k this deck
76
Graph 2-3
Refer to Graph 2-3. On the production possibilities frontier shown, which point represents the maximum possible production of CDs?
A) A
B) B
C) C
D) D
Refer to Graph 2-3. On the production possibilities frontier shown, which point represents the maximum possible production of CDs?
A) A
B) B
C) C
D) D
Unlock Deck
Unlock for access to all 103 flashcards in this deck.
Unlock Deck
k this deck
77
Graph 2-5
Refer to Graph 2-5. In the production possibilities frontier shown, the shift of the frontier from A to B was most likely caused by which of the following?
A) more capital available in the economy
B) more labour available in the economy
C) a general technological breakthrough
D) technological improvement in the production of clothing
Unlock Deck
Unlock for access to all 103 flashcards in this deck.
Unlock Deck
k this deck
78
Graph 2-7
Refer to Graph 2-7. In the production possibilities frontier shown, what is the opportunity cost to society of moving from point C to point E?
A) 150 pretzels
B) 300 potato chips
C) both A and B
D) zero
Refer to Graph 2-7. In the production possibilities frontier shown, what is the opportunity cost to society of moving from point C to point E?
A) 150 pretzels
B) 300 potato chips
C) both A and B
D) zero
Unlock Deck
Unlock for access to all 103 flashcards in this deck.
Unlock Deck
k this deck
79
Graph 2-7
Refer to Graph 2-7. In the production possibilities frontier unemployment most likely caused a movement from:
A) A to B
B) B to D
C) C to D
D) C to E
Refer to Graph 2-7. In the production possibilities frontier unemployment most likely caused a movement from:
A) A to B
B) B to D
C) C to D
D) C to E
Unlock Deck
Unlock for access to all 103 flashcards in this deck.
Unlock Deck
k this deck
80
Graph 2-3
Refer to Graph 2-3. On the production possibilities frontier shown, at which point or points is it possible for this economy to produce?
A) A, B, C, D
B) A, B, C, F
C) A, B, C, D, E, F
D) D
Refer to Graph 2-3. On the production possibilities frontier shown, at which point or points is it possible for this economy to produce?
A) A, B, C, D
B) A, B, C, F
C) A, B, C, D, E, F
D) D
Unlock Deck
Unlock for access to all 103 flashcards in this deck.
Unlock Deck
k this deck
Unlock Deck
Unlock for access to all 103 flashcards in this deck.


