Deck 4: How Do Test Users Interpret Test Scores
Full screen (f)
Question
Question
Question
Question
Question
Question
Question
Question
Question
Question
Question
Question
Question
Question
Question
Question
Question
Question
Question
Question
Question
Question
Question
Question
Question
Question
Question
Question
Question
Question
Question
Question
Question
Question
Question
Question
Question
Question
Question
What type of distribution is shown below? 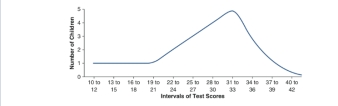
A) evenly distributed distribution
B) positively skewed distribution
C) negatively skewed distribution
D) peaked distribution
A) evenly distributed distribution
B) positively skewed distribution
C) negatively skewed distribution
D) peaked distribution
Question
Question
Question
Question
Question
Question
Question
Question
Question
Question
Question
Question
Question
Question
Question
Question
Question
Question

Unlock Deck
Sign up to unlock the cards in this deck!
Unlock Deck
Unlock Deck
1/57
Play
Full screen (f)
Deck 4: How Do Test Users Interpret Test Scores
1
Which one of the following levels of measurement involves assigning numbers to rank-order data, the distance between the numbers is judged to be equal, and there is no absolute zero point?
A) nominal scale
B) ordinal scale
C) interval scale
D) ratio scale
A) nominal scale
B) ordinal scale
C) interval scale
D) ratio scale
C
2
Which one of the following statements about the characteristics of a normal probability distribution is FALSE?
A) Most test scores cluster or fall near the middle of the distribution, forming what we refer to as the average or the central tendency.
B) Most people will score near the middle of the distribution, making the center of the distribution the highest point.
C) The curve can continue to infinity, and therefore the right and left tails of the curve will never touch the baseline.
D) Approximately 68.2% of the population will score between the mean and 1 standard deviation.
D
3
What is a drawback of the interval scale?
A) We cannot calculate a mean and standard deviation.
B) We cannot interpret test scores on an interval scale.
C) The scale cannot be used for psychological tests.
D) The scale doesn't have a true zero point.
A) We cannot calculate a mean and standard deviation.
B) We cannot interpret test scores on an interval scale.
C) The scale cannot be used for psychological tests.
D) The scale doesn't have a true zero point.
D
4
Categorical data and frequency tables would be associated with what type of data?
A) equal interval
B) ratio
C) nominal
D) ordinal
A) equal interval
B) ratio
C) nominal
D) ordinal
Unlock Deck
Unlock for access to all 57 flashcards in this deck.
Unlock Deck
k this deck
5
Which one of the following levels of measurement involves assigning numbers to rank-order data and the distance between the numbers can vary?
A) nominal scale
B) ordinal scale
C) interval scale
D) ratio scale
A) nominal scale
B) ordinal scale
C) interval scale
D) ratio scale
Unlock Deck
Unlock for access to all 57 flashcards in this deck.
Unlock Deck
k this deck
6
What level of measurement has a true zero point indicating absence of the construct being measured?
A) nominal scale
B) ordinal scale
C) interval scale
D) ratio scale
A) nominal scale
B) ordinal scale
C) interval scale
D) ratio scale
Unlock Deck
Unlock for access to all 57 flashcards in this deck.
Unlock Deck
k this deck
7
John lectures to his Tests and Measurements class on nominal scales, ordinal scales, interval scales, and ratio scales. What is he lecturing about?
A) scale levels
B) levels of measurement
C) measurement scales
D) norm types
A) scale levels
B) levels of measurement
C) measurement scales
D) norm types
Unlock Deck
Unlock for access to all 57 flashcards in this deck.
Unlock Deck
k this deck
8
Which one of the following levels of measurement involves assigning numbers to represent categories of data only?
A) nominal scale
B) ordinal scale
C) interval scale
D) ratio scale
A) nominal scale
B) ordinal scale
C) interval scale
D) ratio scale
Unlock Deck
Unlock for access to all 57 flashcards in this deck.
Unlock Deck
k this deck
9
In a normal distribution, what percent of test takers will score between the mean and 1 standard deviation above the mean?
A) 2.1%
B) 13.6%
C) 34.1%
D) 50%
A) 2.1%
B) 13.6%
C) 34.1%
D) 50%
Unlock Deck
Unlock for access to all 57 flashcards in this deck.
Unlock Deck
k this deck
10
On histograms, the horizontal axis represents ______, and the vertical axis represents ______.
A) the frequency that a score occurred; all possible class intervals
B) the scores of people who took the test; the frequency that the score occurred
C) all possible values of some variable; the number of people who scored each value
D) the means of all test scores; the standard deviations of all test scores
Unlock Deck
Unlock for access to all 57 flashcards in this deck.
Unlock Deck
k this deck
11
In a normal distribution, what percent of test takers will score between 2 and 3 standard deviations below the mean?
A) 2.1%
B) 13.6%
C) 34.1%
D) 50%
A) 2.1%
B) 13.6%
C) 34.1%
D) 50%
Unlock Deck
Unlock for access to all 57 flashcards in this deck.
Unlock Deck
k this deck
12
If Julio assigns 0 to indicate women and 1 to indicate men, he is using a(n) ______.
A) equal interval scale
B) ratio scale
C) nominal scale
D) ordinal scale
A) equal interval scale
B) ratio scale
C) nominal scale
D) ordinal scale
Unlock Deck
Unlock for access to all 57 flashcards in this deck.
Unlock Deck
k this deck
13
In psychological testing, it is common to summarize distributions of test scores by showing an orderly arrangement of test scores using ______.
A) histograms
B) graphs
C) diagrams
D) charts
A) histograms
B) graphs
C) diagrams
D) charts
Unlock Deck
Unlock for access to all 57 flashcards in this deck.
Unlock Deck
k this deck
14
What are raw scores?
A) points on an interval or ratio scale
B) the most basic scores calculated from a test
C) the correct answer to a test question
D) numbers assigned to a norm group
A) points on an interval or ratio scale
B) the most basic scores calculated from a test
C) the correct answer to a test question
D) numbers assigned to a norm group
Unlock Deck
Unlock for access to all 57 flashcards in this deck.
Unlock Deck
k this deck
15
Age equivalents, grade equivalents, and percentile scores all represent what type of scale?
A) ordinal scale
B) nominal scale
C) ratio scale
D) interval scale
A) ordinal scale
B) nominal scale
C) ratio scale
D) interval scale
Unlock Deck
Unlock for access to all 57 flashcards in this deck.
Unlock Deck
k this deck
16
The Fahrenheit and Celsius temperature scales are both ______.
A) ordinal scales
B) interval scales
C) ratio scales
D) nominal scales
A) ordinal scales
B) interval scales
C) ratio scales
D) nominal scales
Unlock Deck
Unlock for access to all 57 flashcards in this deck.
Unlock Deck
k this deck
17
An ordinal scale indicates an individual's or object's value based on what?
A) its relationship to others in the group
B) its mean and standard deviation
C) the number of times that value occurs
D) the number the administrator assigns to it
A) its relationship to others in the group
B) its mean and standard deviation
C) the number of times that value occurs
D) the number the administrator assigns to it
Unlock Deck
Unlock for access to all 57 flashcards in this deck.
Unlock Deck
k this deck
18
Most distributions of human traits, from height and weight to aptitudes and personality characteristics, would form a normal curve if ______.
A) scientists had the resources to measure everything
B) our measurement instruments were more accurate
C) we measured everything using ratio scales
D) we gathered data from the entire population
A) scientists had the resources to measure everything
B) our measurement instruments were more accurate
C) we measured everything using ratio scales
D) we gathered data from the entire population
Unlock Deck
Unlock for access to all 57 flashcards in this deck.
Unlock Deck
k this deck
19
Which one of the following statement about raw scores is TRUE?
A) They are very useful for interpreting test scores.
B) They tell us much about how an individual has performed on a test.
C) They are useful for making comparisons between individual test takers.
D) They require statistical techniques in order to interpret them.
A) They are very useful for interpreting test scores.
B) They tell us much about how an individual has performed on a test.
C) They are useful for making comparisons between individual test takers.
D) They require statistical techniques in order to interpret them.
Unlock Deck
Unlock for access to all 57 flashcards in this deck.
Unlock Deck
k this deck
20
Juanita asks children to line up in order of their height, placing the shortest child first and the tallest child last. She then assigns the first child "1," the second a "2," and so on. What type of scale is Juanita using?
A) ratio scale
B) ordinal scale
C) nominal scale
D) equal interval scale
A) ratio scale
B) ordinal scale
C) nominal scale
D) equal interval scale
Unlock Deck
Unlock for access to all 57 flashcards in this deck.
Unlock Deck
k this deck
21
What is the median?
A) the middle score in a distribution
B) the averages of all scores in a distribution
C) the most frequently occurring score in a distribution
D) a descriptive statistic that describes variability
A) the middle score in a distribution
B) the averages of all scores in a distribution
C) the most frequently occurring score in a distribution
D) a descriptive statistic that describes variability
Unlock Deck
Unlock for access to all 57 flashcards in this deck.
Unlock Deck
k this deck
22
What are outliers?
A) the lowest and the highest scores in a distribution of scores
B) the high and low scores that cause a distribution of scores to be inverted
C) a few values that are significantly higher or lower than most values in a distribution
D) test takers who earn scores that are very different from other test takers
Unlock Deck
Unlock for access to all 57 flashcards in this deck.
Unlock Deck
k this deck
23
In a normal distribution, what percent of test takers will score between 1 standard deviation below and 1 standard deviation above the mean?
A) 2.1%
B) 13.6%
C) 34.1%
D) 68.2%
A) 2.1%
B) 13.6%
C) 34.1%
D) 68.2%
Unlock Deck
Unlock for access to all 57 flashcards in this deck.
Unlock Deck
k this deck
24
The highest score in a distribution minus the lowest score in a distribution is called the ______.
A) standard deviation
B) range
C) variance
D) mode
A) standard deviation
B) range
C) variance
D) mode
Unlock Deck
Unlock for access to all 57 flashcards in this deck.
Unlock Deck
k this deck
25
The correlation coefficient is represented by ______.
A) R
B) C
C) SD
D) X
A) R
B) C
C) SD
D) X
Unlock Deck
Unlock for access to all 57 flashcards in this deck.
Unlock Deck
k this deck
26
Which one of the following statement about the mean is FALSE?
A) The mean and the arithmetic average are the same.
B) The mean, the median, and the mode are the same.
C) The mean is a common measure of central tendency.
D) The mean describes a middle point in a set of scores.
A) The mean and the arithmetic average are the same.
B) The mean, the median, and the mode are the same.
C) The mean is a common measure of central tendency.
D) The mean describes a middle point in a set of scores.
Unlock Deck
Unlock for access to all 57 flashcards in this deck.
Unlock Deck
k this deck
27
Which one of the following would you calculate to better understand the middle of a distribution of test scores?
A) measures of variability
B) measures of central tendency
C) measures of relationship
D) descriptive statistics
A) measures of variability
B) measures of central tendency
C) measures of relationship
D) descriptive statistics
Unlock Deck
Unlock for access to all 57 flashcards in this deck.
Unlock Deck
k this deck
28
Which one of the following is TRUE when dealing with skewed distributions?
A) The median and the mode would be more informative than the mean.
B) The mode and the mean would be a more informative than the median.
C) The mean would be more informative than the mode and the median.
D) The median would be more informative than the mean and the mode.
A) The median and the mode would be more informative than the mean.
B) The mode and the mean would be a more informative than the median.
C) The mean would be more informative than the mode and the median.
D) The median would be more informative than the mean and the mode.
Unlock Deck
Unlock for access to all 57 flashcards in this deck.
Unlock Deck
k this deck
29
Joanna wishes to describe the middle point in a distribution. Which statistic should she calculate?
A) mode
B) standard deviation
C) median
D) mean
A) mode
B) standard deviation
C) median
D) mean
Unlock Deck
Unlock for access to all 57 flashcards in this deck.
Unlock Deck
k this deck
30
We take the square root of the ______ to find the ______.
A) standard deviation; variance
B) variance; standard deviation
C) mean; mode
D) mean; standard deviation
A) standard deviation; variance
B) variance; standard deviation
C) mean; mode
D) mean; standard deviation
Unlock Deck
Unlock for access to all 57 flashcards in this deck.
Unlock Deck
k this deck
31
What group of statistics is NOT a group we generally rely on to interpret test scores?
A) measures of relationship
B) measures of multivariate statistics
C) measures of variability
D) measures of central tendency
A) measures of relationship
B) measures of multivariate statistics
C) measures of variability
D) measures of central tendency
Unlock Deck
Unlock for access to all 57 flashcards in this deck.
Unlock Deck
k this deck
32
Which one of the following is TRUE when a distribution of scores is symmetric?
A) The mean, mode, and median will be the same.
B) The mean will be greater than the median and the mode.
C) The mode will be less than the mean and the median.
D) The median will be different from the median and the mode.
A) The mean, mode, and median will be the same.
B) The mean will be greater than the median and the mode.
C) The mode will be less than the mean and the median.
D) The median will be different from the median and the mode.
Unlock Deck
Unlock for access to all 57 flashcards in this deck.
Unlock Deck
k this deck
33
What do measures of variability represent?
A) the middle of a distribution
B) the probability the mean falls in the center of the distribution
C) statistics that vary from one distribution to another
D) how spread out a group of scores is
A) the middle of a distribution
B) the probability the mean falls in the center of the distribution
C) statistics that vary from one distribution to another
D) how spread out a group of scores is
Unlock Deck
Unlock for access to all 57 flashcards in this deck.
Unlock Deck
k this deck
34
If test scores differed significantly from the mean, you would expect a ______.
A) small range
B) small variance
C) large variance
D) large median
A) small range
B) small variance
C) large variance
D) large median
Unlock Deck
Unlock for access to all 57 flashcards in this deck.
Unlock Deck
k this deck
35
What are three common measures of central tendency?
A) mean, the median, and the mode
B) mean, the median, and the standard deviation
C) median, the standard deviation, and the variance
D) variance, the median, and the mode
A) mean, the median, and the mode
B) mean, the median, and the standard deviation
C) median, the standard deviation, and the variance
D) variance, the median, and the mode
Unlock Deck
Unlock for access to all 57 flashcards in this deck.
Unlock Deck
k this deck
36
Which one of the following is TRUE about descriptive statistics?
A) They are relatively unimportant for interpreting test scores.
B) They are rarely used to describe test scores.
C) They summarize a distribution of test scores using numbers.
D) They are useful only for ratio scales.
A) They are relatively unimportant for interpreting test scores.
B) They are rarely used to describe test scores.
C) They summarize a distribution of test scores using numbers.
D) They are useful only for ratio scales.
Unlock Deck
Unlock for access to all 57 flashcards in this deck.
Unlock Deck
k this deck
37
What statistic do we typically use to describe the relationship between two or more distributions of scores?
A) mode
B) variance
C) standard deviation
D) correlation coefficient
A) mode
B) variance
C) standard deviation
D) correlation coefficient
Unlock Deck
Unlock for access to all 57 flashcards in this deck.
Unlock Deck
k this deck
38
What type of distribution is skewed to the right with more low scores than high scores?
A) evenly distributed distribution
B) positively skewed distribution
C) negatively skewed distribution
D) peaked distribution
A) evenly distributed distribution
B) positively skewed distribution
C) negatively skewed distribution
D) peaked distribution
Unlock Deck
Unlock for access to all 57 flashcards in this deck.
Unlock Deck
k this deck
39
What type of distribution is shown below?
A) evenly distributed distribution
B) positively skewed distribution
C) negatively skewed distribution
D) peaked distribution
A) evenly distributed distribution
B) positively skewed distribution
C) negatively skewed distribution
D) peaked distribution
Unlock Deck
Unlock for access to all 57 flashcards in this deck.
Unlock Deck
k this deck
40
How would you calculate the mode of a distribution of scores?
A) add all scores and divide by the number of scores
B) arrange all scores from lowest to highest and find the middle score
C) order scores and see which score occurs most often
D) use a z score to locate the center of the distribution
A) add all scores and divide by the number of scores
B) arrange all scores from lowest to highest and find the middle score
C) order scores and see which score occurs most often
D) use a z score to locate the center of the distribution
Unlock Deck
Unlock for access to all 57 flashcards in this deck.
Unlock Deck
k this deck
41
What type of standard score is expressed in whole numbers from 1 to 9?
A) percentiles
B) standard deviation units
C) stanines
D) z scores
A) percentiles
B) standard deviation units
C) stanines
D) z scores
Unlock Deck
Unlock for access to all 57 flashcards in this deck.
Unlock Deck
k this deck
42
The process of comparing an individual's test score to a norm group is referred to as ______.
A) standard scoring
B) norm-based interpretation
C) transformation of scores
D) statistical analysis
A) standard scoring
B) norm-based interpretation
C) transformation of scores
D) statistical analysis
Unlock Deck
Unlock for access to all 57 flashcards in this deck.
Unlock Deck
k this deck
43
Rashid's raw score was 42 and his z score was 3. What statement about Rashid's performance on the test is TRUE?
A) He scored lower than most people on the test.
B) He scored higher than most people on the test.
C) He scores were about average.
D) Not enough information is given to answer the question.
A) He scored lower than most people on the test.
B) He scored higher than most people on the test.
C) He scores were about average.
D) Not enough information is given to answer the question.
Unlock Deck
Unlock for access to all 57 flashcards in this deck.
Unlock Deck
k this deck
44
Draw and describe the characteristics of the normal curve. Include a description of the different types of distribution.
Unlock Deck
Unlock for access to all 57 flashcards in this deck.
Unlock Deck
k this deck
45
The scores on Dr. Katz's tests always had a mean of 50 and a standard deviation of 10. What statement best explains this phenomenon?
A) The same descriptive statistics for each test is a coincidence.
B) Dr. Katz grades his tests using a normal curve.
C) Dr. Katz converts his students' raw scores to z scores.
D) Dr. Katz converts his students' raw scores to T scores.
A) The same descriptive statistics for each test is a coincidence.
B) Dr. Katz grades his tests using a normal curve.
C) Dr. Katz converts his students' raw scores to z scores.
D) Dr. Katz converts his students' raw scores to T scores.
Unlock Deck
Unlock for access to all 57 flashcards in this deck.
Unlock Deck
k this deck
46
What provides us with a standard against which we can compare individual test scores?
A) z scores
B) norms
C) percentiles
D) descriptive statistics
A) z scores
B) norms
C) percentiles
D) descriptive statistics
Unlock Deck
Unlock for access to all 57 flashcards in this deck.
Unlock Deck
k this deck
47
What are norms and what purpose do they serve?
Unlock Deck
Unlock for access to all 57 flashcards in this deck.
Unlock Deck
k this deck
48
If Pierre earns a raw score of 20 and the score corresponds to a percentile rank of 60, we can say that Pierre scored equal to or ______ of the test takers in the norm group.
A) higher than 60%
B) lower than 60%
C) higher than 20%
D) lower than 20%
A) higher than 60%
B) lower than 60%
C) higher than 20%
D) lower than 20%
Unlock Deck
Unlock for access to all 57 flashcards in this deck.
Unlock Deck
k this deck
49
Explain the purpose of a norm group. What are some things you would need to consider, and why, when selecting a norm group for a norm-based test?
Unlock Deck
Unlock for access to all 57 flashcards in this deck.
Unlock Deck
k this deck
50
How would we calculate a test taker's score as a percentage?
A) divide the test taker's raw score by the total possible score
B) add all test takers' scores and divide by the number of scores
C) take the square root of the test standard deviation
D) divide the highest score by the test taker's raw score
A) divide the test taker's raw score by the total possible score
B) add all test takers' scores and divide by the number of scores
C) take the square root of the test standard deviation
D) divide the highest score by the test taker's raw score
Unlock Deck
Unlock for access to all 57 flashcards in this deck.
Unlock Deck
k this deck
51
What do standard deviation units refer to?
A) how many standard deviations an individual score falls away from the mean
B) the standard deviation of a group of test scores
C) the strength and direction of a relationship between two distributions
D) the location of the middle of a distribution
A) how many standard deviations an individual score falls away from the mean
B) the standard deviation of a group of test scores
C) the strength and direction of a relationship between two distributions
D) the location of the middle of a distribution
Unlock Deck
Unlock for access to all 57 flashcards in this deck.
Unlock Deck
k this deck
52
The mean of a distribution of test scores will always have a z score of ______.
A) 0
B) 1
C) 33%
D) 68%
A) 0
B) 1
C) 33%
D) 68%
Unlock Deck
Unlock for access to all 57 flashcards in this deck.
Unlock Deck
k this deck
53
Describe and explain the descriptive statistics that we use to describe a distribution of scores.
Unlock Deck
Unlock for access to all 57 flashcards in this deck.
Unlock Deck
k this deck
54
Which one of the following would we use in the denominator of the standard deviation formula when calculating the standard deviation of a population of test scores?
A) n − 1
B) n + 1
C) N
D) N −1
A) n − 1
B) n + 1
C) N
D) N −1
Unlock Deck
Unlock for access to all 57 flashcards in this deck.
Unlock Deck
k this deck
55
Kevin is an 8-year-old Black student who lives and goes to school in Los Angeles, CA. What norm group would be most appropriate for interpreting Kevin's score on a standardized educational test?
A) elementary students in the United States
B) 8-year-old students in California
C) elementary students in California
D) Black elementary students in Los Angeles, CA
A) elementary students in the United States
B) 8-year-old students in California
C) elementary students in California
D) Black elementary students in Los Angeles, CA
Unlock Deck
Unlock for access to all 57 flashcards in this deck.
Unlock Deck
k this deck
56
Why is it important to understand levels of measurement, and what are the different levels of measurement? Define and provide an example of each level of measurement.
Unlock Deck
Unlock for access to all 57 flashcards in this deck.
Unlock Deck
k this deck
57
The mean of a normal distribution always has a percentile of ______.
A) 0
B) 10
C) 50
D) 100
A) 0
B) 10
C) 50
D) 100
Unlock Deck
Unlock for access to all 57 flashcards in this deck.
Unlock Deck
k this deck
Unlock Deck
Unlock for access to all 57 flashcards in this deck.


