Deck 4: Using the Derivative
Full screen (f)
Question
If  for
for  , what is
  ?
?
A)
B)
C)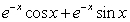
D)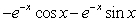
for , what is ?A)
B)
C)
D)
Question
Estimate the inflection points of  if the following graph is the graph of
A. B.
B.  C.
C.  List inflection points in increasing order of x-coordinates; separate each point with a comma.
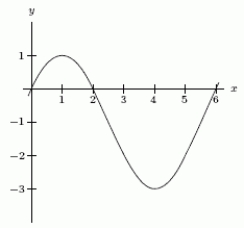
if the following graph is the graph ofA.
B. C. List inflection points in increasing order of x-coordinates; separate each point with a comma. Question
Given the curve 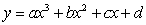 , with
  , find the relation between the parameters a, b, and c that will ensure that the curve has no turning points.
, with , find the relation between the parameters a, b, and c that will ensure that the curve has no turning points. Question
Find all of the critical points of  . List them from smallest to largest, separated by commas.
. List them from smallest to largest, separated by commas. Question
For  and
and  , find the value(s) of x for which
A has a local minimum.
B has a local maximum.
C. has a global minimum.
D. has a global maximum.
List the value(s) from smallest to largest, separated by commas.
and , find the value(s) of x for whichA
has a local minimum.B
has a local maximum.C.
has a global minimum.D.
has a global maximum.List the value(s) from smallest to largest, separated by commas.
Question
The following figure is a graph of a derivative function,  . Indicate on the graph the x-values that are critical points and label each as a local maximum, a local minimum, or neither.
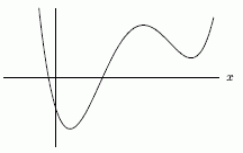
. Indicate on the graph the x-values that are critical points and label each as a local maximum, a local minimum, or neither. Question
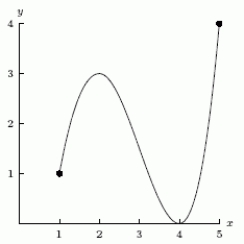
The point x=1 on the following closed graph corresponds to
A)a local minimum
B)a local maximum
C)neither a maximum nor a minimum
D)a local and global minimum
E)a local and global maximum
A)a local minimum
B)a local maximum
C)neither a maximum nor a minimum
D)a local and global minimum
E)a local and global maximum
Question
For  and
and  , which of the following statements are true?
A) has global maxima at
  and
and

B) has a global minima at
  and
and

C) has a global maximum at
D) has a global minimum at
and , which of the following statements are true?A)
has global maxima at andB)
has a global minima at andC)
has a global maximum at D)
has a global minimum at Question
Question
Sketch a graph of a function such that  at x = -1,
  > 0 when x< -1,
  > 0 when x > -1.
at x = -1, > 0 when x< -1, > 0 when x > -1. Question
The following figure represents the function f, with  ,
,  and
and  A. Determine the first two positive x-intercepts of f. Separate them by a comma.
B. What must the value of a be so that ?
?
C. If , calculate
  .
. 
, and A. Determine the first two positive x-intercepts of f. Separate them by a comma.B. What must the value of a be so that
?C. If
, calculate . Question
The graph of the function 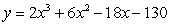 is:
is:
A. increasing and concave up on what interval?
B. increasing and concave down on what interval?
C. decreasing and concave upon what interval?
D. decreasing and concave down on what interval?
is:A. increasing and concave up on what interval?
B. increasing and concave down on what interval?
C. decreasing and concave upon what interval?
D. decreasing and concave down on what interval?
Question
Find a value of a such that the function  has a critical point at
  .
.
has a critical point at . Question
A brick is heated in an oven and taken out to cool off after a certain time. The temperature T of the brick at any time t is given by  for
for  , with T in degrees Celsius and t in minutes. What is the temperature of the brick when it is placed in the oven (to the nearest degree)?
for , with T in degrees Celsius and t in minutes. What is the temperature of the brick when it is placed in the oven (to the nearest degree)? Question
For which interval(s) is the function 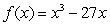 decreasing?
A) -9 or 9
B)-9 9
9
C)-9 0
0
D)0 9
9
E)-10 < x < 10
decreasing?A)
-9 or 9 B)-9
9C)-9
0D)0
9E)-10 < x < 10
Question
A stone is thrown vertically upward so that its height, measured in feet, after t seconds is given by 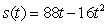 . What is the maximum height of the stone (in feet)?
. What is the maximum height of the stone (in feet)? Question
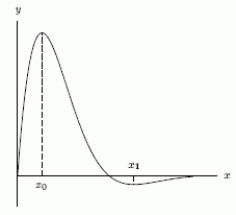
The distance, s, traveled by a runner in a 20 mile race is given in the following figure, where time, t, is in hours. At which of the following values of t is the runner's speed is the slowest? 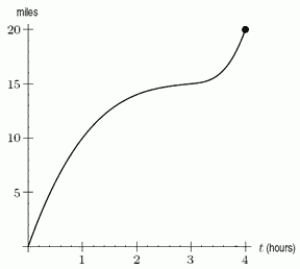
A)4
B)3
C)1
D)2
A)4
B)3
C)1
D)2
Question
Sketch the curve  .
.
. Question
The following is a graph of  . Which of the following statements about
  are true?
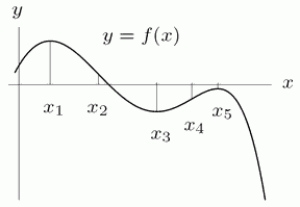
A) changes sign at
  ,
,
 , and
, and

B) changes sign at
  and
and

C) has a local maximum or minimum at
  ,
,
 , and
, and

D) has a local maximum or minimum at
  and
and

. Which of the following statements about are true? A)
changes sign at , , andB)
changes sign at andC)
has a local maximum or minimum at , , andD)
has a local maximum or minimum at and Question
Suppose f has a continuous derivative whose values are given in the following table. 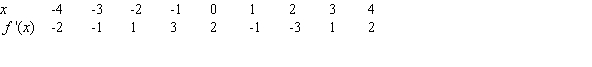 Is x=-2.5 a potential local minimum, local maximum, or neither?
A)local minimum
B)neither
C)local maximum
Is x=-2.5 a potential local minimum, local maximum, or neither?A)local minimum
B)neither
C)local maximum
Question
The number of plants in a terrarium is given by the function 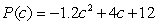 , where c is the number of mg of plant food added to the terrarium. The amount of plant food that produces the highest number of plants is _____ mg (round to the nearest hundredth).
, where c is the number of mg of plant food added to the terrarium. The amount of plant food that produces the highest number of plants is _____ mg (round to the nearest hundredth). Question
If the total revenue and total cost (in dollars) are given by 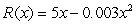
 ?
?
What quantity of gadgets, to the nearest whole number should be produced to maximize profit? What is the maximum profit?
?What quantity of gadgets, to the nearest whole number should be produced to maximize profit? What is the maximum profit?
Question
The function  gives the population of a town (in 1000's of people) at time x where x is the number of years since 1980. The population was a minimum in the year _____.
gives the population of a town (in 1000's of people) at time x where x is the number of years since 1980. The population was a minimum in the year _____. Question
The revenue for selling q items is  and the total cost is
  .
.
A. Write a function that gives total profit earned.
B. Find the quantity that maximizes profit.
and the total cost is .A. Write a function that gives total profit earned.
B. Find the quantity that maximizes profit.
Question
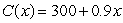
Total cost and revenue are approximated by the functions  and
and  , both in dollars.
A. What is the fixed cost?
B. What is the profit function?
and , both in dollars.A. What is the fixed cost?
B. What is the profit function?
Question
A normal distribution in statistics is modeled by the function  . Determine where the maximum value of the function would occur.
A)-3
B)-2
C)0
D)
E)e-3
. Determine where the maximum value of the function would occur.A)-3
B)-2
C)0
D)
E)e-3
Question
The quantity of a medication in the bloodstream t hours after it is ingested is given, in mg, by  . What is the maximum quantity of the medication in the bloodstream?
A)110 mg
B)300 mg
C)815 mg
D)150 mg
. What is the maximum quantity of the medication in the bloodstream?A)110 mg
B)300 mg
C)815 mg
D)150 mg
Question
What quantity of gadgets should be produced to maximize profit if they sell for $500 per unit and the total cost (in dollars) of producing x units is given by 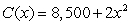 ? What is that profit?
? What is that profit? Question
Given the following table of production quantities with their corresponding marginal revenue and marginal cost, estimate the production level that maximizes profit. 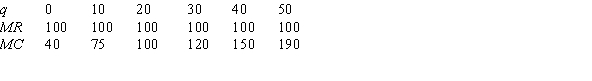
Question
Let C(q) represent the cost, R(q), the revenue and π(q) the profit, in dollars of producing q items. If  and
and  approximately, how much profit is earned by the
  item?
item?
and approximately, how much profit is earned by the item? Question
The following table shows cost and revenue for a product (in dollars).
A. What is the price of the product?
B. At what value of q is profit is maximized?
A. What is the price of the product?
B. At what value of q is profit is maximized?
Question
Daily production levels in a plant can be modeled by the function 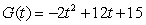 , which gives units produced at t, the number of hours since the factory opened at 8 am. Factory productivity is at a maximum at _____ am.
, which gives units produced at t, the number of hours since the factory opened at 8 am. Factory productivity is at a maximum at _____ am. Question
In the function y = 3sin (x) + 5, in the interval from 0 
 , at which value(s) of x does the function contain a global maximum?
A) and
and 
B)0 and
C) only
only
D)4
E)2
, at which value(s) of x does the function contain a global maximum?A)
and B)0 and
C)
onlyD)4
E)2
Question
The function 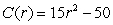 gives cost in dollars of producing r items. What is the marginal cost of increasing r by 1 item from the current production level of r=3?
gives cost in dollars of producing r items. What is the marginal cost of increasing r by 1 item from the current production level of r=3? Question
Consider the following graph of a function. Assume the entire graph is shown. How many local minima does the function have? 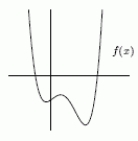
Question
Question
Question
The total cost, C, in dollars,when producing q items is  . Calculate and interpret the marginal cost if q= 6.
. Calculate and interpret the marginal cost if q= 6. Question
The total revenue, R, in dollars,when selling q items is  . Calculate and interpret the marginal revenue if q= 10.
. Calculate and interpret the marginal revenue if q= 10. Question
Question
The cost function, in dollars, is  . The average cost of producing 130 units is
  .
.
. The average cost of producing 130 units is . Question
Question
The average cost per item to produce q items is given by  .
.
A. What is the total cost, , of producing q items?
B. What is the marginal cost, MC, of producing q items?
C. At what production level does marginal cost equal average cost?
.A. What is the total cost,
, of producing q items?B. What is the marginal cost, MC, of producing q items?
C. At what production level does marginal cost equal average cost?
Question
Question
Question
The graph of a cost function is given in the following figure. Estimate the value of q at which average cost is minimized. 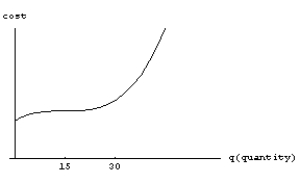
Question
The demand curve for a product is  .
.
A. Find the elasticity of demand (to three decimal places) at a price of p=5.
B. Is demand elastic or inelastic at this price?
.A. Find the elasticity of demand (to three decimal places) at a price of p=5.
B. Is demand elastic or inelastic at this price?
Question
The cost of producing q items is  dollars. What is the average cost of producing the 20th item?
dollars. What is the average cost of producing the 20th item? Question
Question
The demand equation for a product is  , where q is the number of units produced, p is the price of each unit, and a and b are positive constants. Find the critical point(s) of the revenue function.
, where q is the number of units produced, p is the price of each unit, and a and b are positive constants. Find the critical point(s) of the revenue function. Question
The Revenue is given by  and the Cost is given by
  . What value of q will maximize profit? What is the profit at that value?
q=________________________, P(q)= ___________________________
and the Cost is given by . What value of q will maximize profit? What is the profit at that value?q=________________________, P(q)= ___________________________
Question
Question
The demand for doughnuts at a bakery is given by  , where q is the number of doughnuts sold at a price of p dollars each.
A. Find the elasticity of demand to two decimal places if the price is $0.80.
B. Will revenue be increased by raising or lowering the price?
, where q is the number of doughnuts sold at a price of p dollars each.A. Find the elasticity of demand to two decimal places if the price is $0.80.
B. Will revenue be increased by raising or lowering the price?
Question
Question
Given the cost function 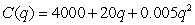 and the demand function
 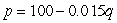 , find the value of q (to the nearest whole number) for which average cost is a minimum.
and the demand function , find the value of q (to the nearest whole number) for which average cost is a minimum. Question
The demand equation for a product is  , where q is the number of units produced, p is the price of each unit, and a and b are positive constants. Find a formula, in terms of p, for the elasticity of demand.
, where q is the number of units produced, p is the price of each unit, and a and b are positive constants. Find a formula, in terms of p, for the elasticity of demand. Question
Which average cost function corresponds to the total cost function shown in the following figure? 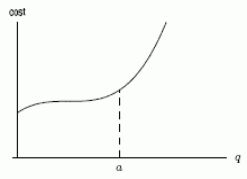
A)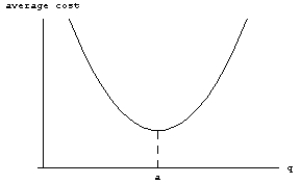
B)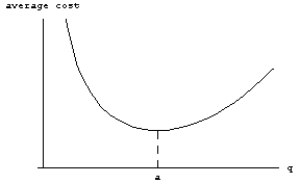
C)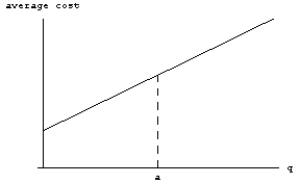
D)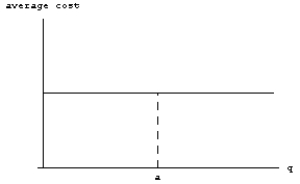
A)
B)
C)
D)
Question
If the cost function is  . For the 120th unit, find the marginal cost and average cost, identify the units.
. For the 120th unit, find the marginal cost and average cost, identify the units. Question
Question
A youth group wishes to hold a car wash as a fundraiser. Through past experience with car washes, they have constructed the following table, which shows the price, p, charged for a car wash and the quantity, q, of cars washed at that price. 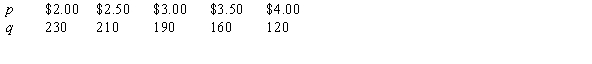 A. At what price is revenue maximized?
B. What is the elasticity at that price?
A. At what price is revenue maximized?B. What is the elasticity at that price?
Question
The drug concentration curve for a drug after t hours is given by  ng/ml. The minimum effective concentration is 10 ng/ml. Is the drug effective at t = 10 hours?
ng/ml. The minimum effective concentration is 10 ng/ml. Is the drug effective at t = 10 hours? Question
Does the maximum value of the surge function  increase or decrease when a is increased and b is held constant?
increase or decrease when a is increased and b is held constant? Question
The following table shows the total sales, in thousands, since a new DVD was released.
A. Estimate the point of diminishing returns.
B. Using your answer from part (A), predict the total possible sales for the DVD.
A. Estimate the point of diminishing returns.
B. Using your answer from part (A), predict the total possible sales for the DVD.
Question
A disease is released into a town. The number of people, in thousands infected is modeled by the equation 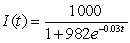 . How many people are infected after
  hours?
. How many people are infected after hours? Question
The following table gives the number of students who have joined a new school club t days after it was formed.
A. Estimate the value of t where concavity changes in this function.
B. Use your answer from part (a) to estimate the maximum membership in the club.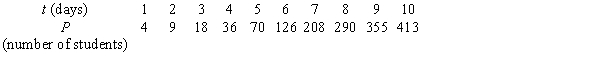
A. Estimate the value of t where concavity changes in this function.
B. Use your answer from part (a) to estimate the maximum membership in the club.
Question
A disease is released into a small town. The number of people infected is modeled by the equation 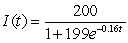 . What is the population at t=0 of this disease?
. What is the population at t=0 of this disease? Question
If time, t, is in hours and concentration, C, is in ng/ml, the drug concentration curve for a drug is given by 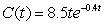 . About how many hours does it take for the drug to reach peak concentration? .
A)2.5 hours
B)8.5 hours
C)0.4 hours
D)3.4 hours
. About how many hours does it take for the drug to reach peak concentration? .A)2.5 hours
B)8.5 hours
C)0.4 hours
D)3.4 hours
Question
The following three equations are graphed in the figure. Which graph corresponds to equation C?
A. B.
B.  C.
C. 
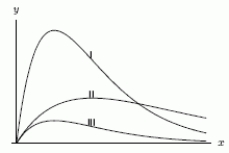
A.
B. C. Question
The following table gives the concentration C, of a drug in ng/ml, at time t, in hours, after it is administered to 2 different people.
A. If the concentration for Person A is given by and the concentration for Person B is given by
  , would you expect bA to be larger or smaller than bB?
B. If the minimum effective concentration is 5 ng/ml, until what time is the drug effective for person A?
C. If the minimum effective concentration is 5 ng/ml, until what time is the drug effective for person B?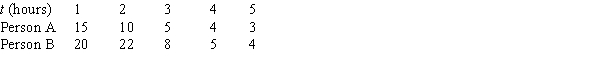
A. If the concentration for Person A is given by
and the concentration for Person B is given by , would you expect bA to be larger or smaller than bB?B. If the minimum effective concentration is 5 ng/ml, until what time is the drug effective for person A?
C. If the minimum effective concentration is 5 ng/ml, until what time is the drug effective for person B?
Question
If time, t, is in hours and concentration, C, is in ng/ml, the drug concentration curve for a drug is given by  . Suppose scientists wish to alter the drug so that it is effective for more hours. Would the coefficient of 9 in its concentration curve equation increase or decrease?
A)increase
B)decrease
. Suppose scientists wish to alter the drug so that it is effective for more hours. Would the coefficient of 9 in its concentration curve equation increase or decrease?A)increase
B)decrease
Question
The demand curve for a product is given by 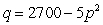 .
.
A. Write revenue as a function of price and take its derivative to find the price (to the nearest cent) that will maximize revenue.
B. Find the elasticity (to two decimal places) at the price you found in part A.
.A. Write revenue as a function of price and take its derivative to find the price (to the nearest cent) that will maximize revenue.
B. Find the elasticity (to two decimal places) at the price you found in part A.
Question
Question
Question
The dose response curve in the following figure is given by  , where R is percent of maximum response and x is the dose of the drug in mg. The inflection point is at (10,50) and
  . Would
  be greater or less than 7 for values of x less than 10?
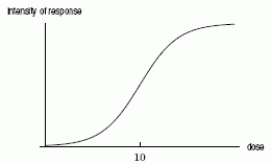
, where R is percent of maximum response and x is the dose of the drug in mg. The inflection point is at (10,50) and . Would be greater or less than 7 for values of x less than 10? Question
A biologist found that the number of Drosophila fruit flies, N(t), assumes the following growth pattern if the food source is limited: 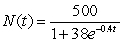 .
.
A. How many fruit flies were there in the beginning (to the nearest fly)?
B. At what time was the population increasing most rapidly (to the nearest day)?
C. At what rate does the number of fruit flies increase after 5 days (to the nearest fly per day)?
.A. How many fruit flies were there in the beginning (to the nearest fly)?
B. At what time was the population increasing most rapidly (to the nearest day)?
C. At what rate does the number of fruit flies increase after 5 days (to the nearest fly per day)?
Question
The rabbit population, P, in a wilderness area is approximated by the function 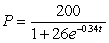 ,
,
where t is the number of weeks since the rabbits were introduced into the area.
A. How many rabbits were initially introduced into the area (to the nearest rabbit)?
B. How many rabbits were in the area after 5 weeks (to the nearest rabbit)?
C. What is the carrying capacity of rabbits in the area?
,where t is the number of weeks since the rabbits were introduced into the area.
A. How many rabbits were initially introduced into the area (to the nearest rabbit)?
B. How many rabbits were in the area after 5 weeks (to the nearest rabbit)?
C. What is the carrying capacity of rabbits in the area?
Question
A flu epidemic spreads amongst a group of people according to the formula 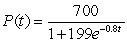 ,
,
where represents the number of people that are infected by the end of day t.
A. How many people are infected by the end of the fifth day (to the nearest person)?
B. At what rate do the people become infected on day 5 (to the nearest person per day)?
,where
represents the number of people that are infected by the end of day t.A. How many people are infected by the end of the fifth day (to the nearest person)?
B. At what rate do the people become infected on day 5 (to the nearest person per day)?
Question
A disease is released into a town. The number of people infected each day is modeled by the equation 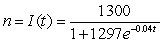 . Estimate when
  Estimate the value of n at this time.
. Estimate when Estimate the value of n at this time. Question
Question
If time, t, is in hours and concentration, C, is in ng/ml, the drug concentration curve for a drug is given by  . What is the peak concentration of the drug?
A)6.0 mg
B)6.5 mg
C)2.6 mg
D)16.3 mg
. What is the peak concentration of the drug?A)6.0 mg
B)6.5 mg
C)2.6 mg
D)16.3 mg

Unlock Deck
Sign up to unlock the cards in this deck!
Unlock Deck
Unlock Deck
1/94
Play
Full screen (f)
Deck 4: Using the Derivative
1
If for , what is ?
A)
B)
C)
D)
for , what is ?A)
B)
C)
D)
2
Estimate the inflection points of if the following graph is the graph of
A. B. C. List inflection points in increasing order of x-coordinates; separate each point with a comma.
if the following graph is the graph ofA.
B. C. List inflection points in increasing order of x-coordinates; separate each point with a comma. A. (2.5,-1)
B. (1,1), (4,-3)
C. (0,0), (2,0), (6,0)
B. (1,1), (4,-3)
C. (0,0), (2,0), (6,0)
3
Given the curve , with , find the relation between the parameters a, b, and c that will ensure that the curve has no turning points.
, with , find the relation between the parameters a, b, and c that will ensure that the curve has no turning points. < 0
< 0 4
Find all of the critical points of . List them from smallest to largest, separated by commas.
. List them from smallest to largest, separated by commas. Unlock Deck
Unlock for access to all 94 flashcards in this deck.
Unlock Deck
k this deck
5
For and , find the value(s) of x for which
A has a local minimum.
B has a local maximum.
C. has a global minimum.
D. has a global maximum.
List the value(s) from smallest to largest, separated by commas.
and , find the value(s) of x for whichA
has a local minimum.B
has a local maximum.C.
has a global minimum.D.
has a global maximum.List the value(s) from smallest to largest, separated by commas.
Unlock Deck
Unlock for access to all 94 flashcards in this deck.
Unlock Deck
k this deck
6
The following figure is a graph of a derivative function, . Indicate on the graph the x-values that are critical points and label each as a local maximum, a local minimum, or neither.
. Indicate on the graph the x-values that are critical points and label each as a local maximum, a local minimum, or neither. Unlock Deck
Unlock for access to all 94 flashcards in this deck.
Unlock Deck
k this deck
7
The point x=1 on the following closed graph corresponds to
A)a local minimum
B)a local maximum
C)neither a maximum nor a minimum
D)a local and global minimum
E)a local and global maximum
A)a local minimum
B)a local maximum
C)neither a maximum nor a minimum
D)a local and global minimum
E)a local and global maximum
Unlock Deck
Unlock for access to all 94 flashcards in this deck.
Unlock Deck
k this deck
8
For and , which of the following statements are true?
A) has global maxima at and
B) has a global minima at and
C) has a global maximum at
D) has a global minimum at
and , which of the following statements are true?A)
has global maxima at andB)
has a global minima at andC)
has a global maximum at D)
has a global minimum at Unlock Deck
Unlock for access to all 94 flashcards in this deck.
Unlock Deck
k this deck
9
Assume that the polynomial f has exactly one local maximum, two local minima, and two inflection points. What is the largets number of zeros f could have?
Unlock Deck
Unlock for access to all 94 flashcards in this deck.
Unlock Deck
k this deck
10
Sketch a graph of a function such that at x = -1, > 0 when x< -1, > 0 when x > -1.
at x = -1, > 0 when x< -1, > 0 when x > -1. Unlock Deck
Unlock for access to all 94 flashcards in this deck.
Unlock Deck
k this deck
11
The following figure represents the function f, with , and A. Determine the first two positive x-intercepts of f. Separate them by a comma.
B. What must the value of a be so that ?
C. If , calculate .
, and A. Determine the first two positive x-intercepts of f. Separate them by a comma.B. What must the value of a be so that
?C. If
, calculate . Unlock Deck
Unlock for access to all 94 flashcards in this deck.
Unlock Deck
k this deck
12
The graph of the function is:
A. increasing and concave up on what interval?
B. increasing and concave down on what interval?
C. decreasing and concave upon what interval?
D. decreasing and concave down on what interval?
is:A. increasing and concave up on what interval?
B. increasing and concave down on what interval?
C. decreasing and concave upon what interval?
D. decreasing and concave down on what interval?
Unlock Deck
Unlock for access to all 94 flashcards in this deck.
Unlock Deck
k this deck
13
Find a value of a such that the function has a critical point at .
has a critical point at . Unlock Deck
Unlock for access to all 94 flashcards in this deck.
Unlock Deck
k this deck
14
A brick is heated in an oven and taken out to cool off after a certain time. The temperature T of the brick at any time t is given by for , with T in degrees Celsius and t in minutes. What is the temperature of the brick when it is placed in the oven (to the nearest degree)?
for , with T in degrees Celsius and t in minutes. What is the temperature of the brick when it is placed in the oven (to the nearest degree)? Unlock Deck
Unlock for access to all 94 flashcards in this deck.
Unlock Deck
k this deck
15
For which interval(s) is the function decreasing?
A) -9 or 9
B)-9 9
C)-9 0
D)0 9
E)-10 < x < 10
decreasing?A)
-9 or 9 B)-9
9C)-9
0D)0
9E)-10 < x < 10
Unlock Deck
Unlock for access to all 94 flashcards in this deck.
Unlock Deck
k this deck
16
A stone is thrown vertically upward so that its height, measured in feet, after t seconds is given by . What is the maximum height of the stone (in feet)?
. What is the maximum height of the stone (in feet)? Unlock Deck
Unlock for access to all 94 flashcards in this deck.
Unlock Deck
k this deck
17
The distance, s, traveled by a runner in a 20 mile race is given in the following figure, where time, t, is in hours. At which of the following values of t is the runner's speed is the slowest?
A)4
B)3
C)1
D)2
A)4
B)3
C)1
D)2
Unlock Deck
Unlock for access to all 94 flashcards in this deck.
Unlock Deck
k this deck
18
Sketch the curve .
. Unlock Deck
Unlock for access to all 94 flashcards in this deck.
Unlock Deck
k this deck
19
The following is a graph of . Which of the following statements about are true?
A) changes sign at ,
, and
B) changes sign at and
C) has a local maximum or minimum at ,
, and
D) has a local maximum or minimum at and
. Which of the following statements about are true? A)
changes sign at , , andB)
changes sign at andC)
has a local maximum or minimum at , , andD)
has a local maximum or minimum at and Unlock Deck
Unlock for access to all 94 flashcards in this deck.
Unlock Deck
k this deck
20
Suppose f has a continuous derivative whose values are given in the following table. Is x=-2.5 a potential local minimum, local maximum, or neither?
A)local minimum
B)neither
C)local maximum
Is x=-2.5 a potential local minimum, local maximum, or neither?A)local minimum
B)neither
C)local maximum
Unlock Deck
Unlock for access to all 94 flashcards in this deck.
Unlock Deck
k this deck
21
The number of plants in a terrarium is given by the function , where c is the number of mg of plant food added to the terrarium. The amount of plant food that produces the highest number of plants is _____ mg (round to the nearest hundredth).
, where c is the number of mg of plant food added to the terrarium. The amount of plant food that produces the highest number of plants is _____ mg (round to the nearest hundredth). Unlock Deck
Unlock for access to all 94 flashcards in this deck.
Unlock Deck
k this deck
22
If the total revenue and total cost (in dollars) are given by ?
What quantity of gadgets, to the nearest whole number should be produced to maximize profit? What is the maximum profit?
?What quantity of gadgets, to the nearest whole number should be produced to maximize profit? What is the maximum profit?
Unlock Deck
Unlock for access to all 94 flashcards in this deck.
Unlock Deck
k this deck
23
The function gives the population of a town (in 1000's of people) at time x where x is the number of years since 1980. The population was a minimum in the year _____.
gives the population of a town (in 1000's of people) at time x where x is the number of years since 1980. The population was a minimum in the year _____. Unlock Deck
Unlock for access to all 94 flashcards in this deck.
Unlock Deck
k this deck
24
The revenue for selling q items is and the total cost is .
A. Write a function that gives total profit earned.
B. Find the quantity that maximizes profit.
and the total cost is .A. Write a function that gives total profit earned.
B. Find the quantity that maximizes profit.
Unlock Deck
Unlock for access to all 94 flashcards in this deck.
Unlock Deck
k this deck
25
Total cost and revenue are approximated by the functions and , both in dollars.
A. What is the fixed cost?
B. What is the profit function?
and , both in dollars.A. What is the fixed cost?
B. What is the profit function?
Unlock Deck
Unlock for access to all 94 flashcards in this deck.
Unlock Deck
k this deck
26
A normal distribution in statistics is modeled by the function . Determine where the maximum value of the function would occur.
A)-3
B)-2
C)0
D)
E)e-3
. Determine where the maximum value of the function would occur.A)-3
B)-2
C)0
D)
E)e-3
Unlock Deck
Unlock for access to all 94 flashcards in this deck.
Unlock Deck
k this deck
27
The quantity of a medication in the bloodstream t hours after it is ingested is given, in mg, by . What is the maximum quantity of the medication in the bloodstream?
A)110 mg
B)300 mg
C)815 mg
D)150 mg
. What is the maximum quantity of the medication in the bloodstream?A)110 mg
B)300 mg
C)815 mg
D)150 mg
Unlock Deck
Unlock for access to all 94 flashcards in this deck.
Unlock Deck
k this deck
28
What quantity of gadgets should be produced to maximize profit if they sell for $500 per unit and the total cost (in dollars) of producing x units is given by ? What is that profit?
? What is that profit? Unlock Deck
Unlock for access to all 94 flashcards in this deck.
Unlock Deck
k this deck
29
Given the following table of production quantities with their corresponding marginal revenue and marginal cost, estimate the production level that maximizes profit.
Unlock Deck
Unlock for access to all 94 flashcards in this deck.
Unlock Deck
k this deck
30
Let C(q) represent the cost, R(q), the revenue and π(q) the profit, in dollars of producing q items. If and approximately, how much profit is earned by the item?
and approximately, how much profit is earned by the item? Unlock Deck
Unlock for access to all 94 flashcards in this deck.
Unlock Deck
k this deck
31
The following table shows cost and revenue for a product (in dollars).
A. What is the price of the product?
B. At what value of q is profit is maximized?
A. What is the price of the product?
B. At what value of q is profit is maximized?
Unlock Deck
Unlock for access to all 94 flashcards in this deck.
Unlock Deck
k this deck
32
Daily production levels in a plant can be modeled by the function , which gives units produced at t, the number of hours since the factory opened at 8 am. Factory productivity is at a maximum at _____ am.
, which gives units produced at t, the number of hours since the factory opened at 8 am. Factory productivity is at a maximum at _____ am. Unlock Deck
Unlock for access to all 94 flashcards in this deck.
Unlock Deck
k this deck
33
In the function y = 3sin (x) + 5, in the interval from 0 , at which value(s) of x does the function contain a global maximum?
A) and
B)0 and
C) only
D)4
E)2
, at which value(s) of x does the function contain a global maximum?A)
and B)0 and
C)
onlyD)4
E)2
Unlock Deck
Unlock for access to all 94 flashcards in this deck.
Unlock Deck
k this deck
34
The function gives cost in dollars of producing r items. What is the marginal cost of increasing r by 1 item from the current production level of r=3?
gives cost in dollars of producing r items. What is the marginal cost of increasing r by 1 item from the current production level of r=3? Unlock Deck
Unlock for access to all 94 flashcards in this deck.
Unlock Deck
k this deck
35
Consider the following graph of a function. Assume the entire graph is shown. How many local minima does the function have?
Unlock Deck
Unlock for access to all 94 flashcards in this deck.
Unlock Deck
k this deck
36
With x people aboard, a South African airline makes a profit of (1200-4x) rands per person for a specific flight. What is the maximum number of passengers that can board such that the airline still profits?
Unlock Deck
Unlock for access to all 94 flashcards in this deck.
Unlock Deck
k this deck
37
A. Find the marginal cost for q=110 when the fixed costs in dollars are 2,000, the variable costs are 100 per item, and each sells for $400.
B. Find the marginal revenue under the same conditions.
B. Find the marginal revenue under the same conditions.
Unlock Deck
Unlock for access to all 94 flashcards in this deck.
Unlock Deck
k this deck
38
The total cost, C, in dollars,when producing q items is . Calculate and interpret the marginal cost if q= 6.
. Calculate and interpret the marginal cost if q= 6. Unlock Deck
Unlock for access to all 94 flashcards in this deck.
Unlock Deck
k this deck
39
The total revenue, R, in dollars,when selling q items is . Calculate and interpret the marginal revenue if q= 10.
. Calculate and interpret the marginal revenue if q= 10. Unlock Deck
Unlock for access to all 94 flashcards in this deck.
Unlock Deck
k this deck
40
Write a formula for total cost, C, as a function of quantity r when fixed costs are $45,000 and and variable costs are $2,000 per item.
Unlock Deck
Unlock for access to all 94 flashcards in this deck.
Unlock Deck
k this deck
41
The cost function, in dollars, is . The average cost of producing 130 units is .
. The average cost of producing 130 units is . Unlock Deck
Unlock for access to all 94 flashcards in this deck.
Unlock Deck
k this deck
42
The elasticity for a good is E=1.3. What is the effect on demand of a 7% price increase?
A)9.1% decrease
B)9.1% increase
C)5.4% decrease
D)5.4% increase
A)9.1% decrease
B)9.1% increase
C)5.4% decrease
D)5.4% increase
Unlock Deck
Unlock for access to all 94 flashcards in this deck.
Unlock Deck
k this deck
43
The average cost per item to produce q items is given by .
A. What is the total cost, , of producing q items?
B. What is the marginal cost, MC, of producing q items?
C. At what production level does marginal cost equal average cost?
.A. What is the total cost,
, of producing q items?B. What is the marginal cost, MC, of producing q items?
C. At what production level does marginal cost equal average cost?
Unlock Deck
Unlock for access to all 94 flashcards in this deck.
Unlock Deck
k this deck
44
You sell hot dogs at a baseball game for $2.75 each. You have 100 hot dogs to sell at an average cost to you of $1.75 each. The marginal cost at q=100 is $1.90. Assume you can always sell out of hot dogs. Will increasing the number of hot dogs you have to sell increase or decrease the average cost?
A)increase
B)decrease
A)increase
B)decrease
Unlock Deck
Unlock for access to all 94 flashcards in this deck.
Unlock Deck
k this deck
45
There is only one barber in a small town. Would you expect the elasticity of demand for the first barber to increase or decrease if a second barber moved into town?
Unlock Deck
Unlock for access to all 94 flashcards in this deck.
Unlock Deck
k this deck
46
The graph of a cost function is given in the following figure. Estimate the value of q at which average cost is minimized.
Unlock Deck
Unlock for access to all 94 flashcards in this deck.
Unlock Deck
k this deck
47
The demand curve for a product is .
A. Find the elasticity of demand (to three decimal places) at a price of p=5.
B. Is demand elastic or inelastic at this price?
.A. Find the elasticity of demand (to three decimal places) at a price of p=5.
B. Is demand elastic or inelastic at this price?
Unlock Deck
Unlock for access to all 94 flashcards in this deck.
Unlock Deck
k this deck
48
The cost of producing q items is dollars. What is the average cost of producing the 20th item?
dollars. What is the average cost of producing the 20th item? Unlock Deck
Unlock for access to all 94 flashcards in this deck.
Unlock Deck
k this deck
49
A factory produces a product that sells for $12. They currently produce 2200 items per month, at an average cost of $3 per item. The marginal cost at this level is $2. Assume that the factory can sell all the items that it produces.
A. What is the profit at this production level?
B. Would increasing production increase or decrease profit?
A. What is the profit at this production level?
B. Would increasing production increase or decrease profit?
Unlock Deck
Unlock for access to all 94 flashcards in this deck.
Unlock Deck
k this deck
50
The demand equation for a product is , where q is the number of units produced, p is the price of each unit, and a and b are positive constants. Find the critical point(s) of the revenue function.
, where q is the number of units produced, p is the price of each unit, and a and b are positive constants. Find the critical point(s) of the revenue function. Unlock Deck
Unlock for access to all 94 flashcards in this deck.
Unlock Deck
k this deck
51
The Revenue is given by and the Cost is given by . What value of q will maximize profit? What is the profit at that value?
q=________________________, P(q)= ___________________________
and the Cost is given by . What value of q will maximize profit? What is the profit at that value?q=________________________, P(q)= ___________________________
Unlock Deck
Unlock for access to all 94 flashcards in this deck.
Unlock Deck
k this deck
52
An amusement park finds that when it charges $24 for an all-day pass, attendance is about 3700 per day. When it charges $27 , attendance is about 3400 per day.
A. Estimate the elasticity for the amusement park to two decimal places.
B. Is demand elastic or inelastic?
A. Estimate the elasticity for the amusement park to two decimal places.
B. Is demand elastic or inelastic?
Unlock Deck
Unlock for access to all 94 flashcards in this deck.
Unlock Deck
k this deck
53
The demand for doughnuts at a bakery is given by , where q is the number of doughnuts sold at a price of p dollars each.
A. Find the elasticity of demand to two decimal places if the price is $0.80.
B. Will revenue be increased by raising or lowering the price?
, where q is the number of doughnuts sold at a price of p dollars each.A. Find the elasticity of demand to two decimal places if the price is $0.80.
B. Will revenue be increased by raising or lowering the price?
Unlock Deck
Unlock for access to all 94 flashcards in this deck.
Unlock Deck
k this deck
54
An amusement park finds that when it charges $15 for an all-day pass, attendance is about 2400 per day. When it charges $19 , attendance is about 2200 per day. Is daily revenue higher at a price of $15 or a price of $19?
Unlock Deck
Unlock for access to all 94 flashcards in this deck.
Unlock Deck
k this deck
55
Given the cost function and the demand function , find the value of q (to the nearest whole number) for which average cost is a minimum.
and the demand function , find the value of q (to the nearest whole number) for which average cost is a minimum. Unlock Deck
Unlock for access to all 94 flashcards in this deck.
Unlock Deck
k this deck
56
The demand equation for a product is , where q is the number of units produced, p is the price of each unit, and a and b are positive constants. Find a formula, in terms of p, for the elasticity of demand.
, where q is the number of units produced, p is the price of each unit, and a and b are positive constants. Find a formula, in terms of p, for the elasticity of demand. Unlock Deck
Unlock for access to all 94 flashcards in this deck.
Unlock Deck
k this deck
57
Which average cost function corresponds to the total cost function shown in the following figure?
A)
B)
C)
D)
A)
B)
C)
D)
Unlock Deck
Unlock for access to all 94 flashcards in this deck.
Unlock Deck
k this deck
58
If the cost function is . For the 120th unit, find the marginal cost and average cost, identify the units.
. For the 120th unit, find the marginal cost and average cost, identify the units. Unlock Deck
Unlock for access to all 94 flashcards in this deck.
Unlock Deck
k this deck
59
You sell hot dogs at a baseball game for $3.25 each. You have 100 hot dogs to sell at an average cost to you of $2.00 each. The marginal cost at q=100 is $1.95. Assume you can always sell out of hot dogs. Will increasing the number of hotdogs you have to sell increase or decrease your profit?
A)increase
B)decrease
A)increase
B)decrease
Unlock Deck
Unlock for access to all 94 flashcards in this deck.
Unlock Deck
k this deck
60
A youth group wishes to hold a car wash as a fundraiser. Through past experience with car washes, they have constructed the following table, which shows the price, p, charged for a car wash and the quantity, q, of cars washed at that price. A. At what price is revenue maximized?
B. What is the elasticity at that price?
A. At what price is revenue maximized?B. What is the elasticity at that price?
Unlock Deck
Unlock for access to all 94 flashcards in this deck.
Unlock Deck
k this deck
61
The drug concentration curve for a drug after t hours is given by ng/ml. The minimum effective concentration is 10 ng/ml. Is the drug effective at t = 10 hours?
ng/ml. The minimum effective concentration is 10 ng/ml. Is the drug effective at t = 10 hours? Unlock Deck
Unlock for access to all 94 flashcards in this deck.
Unlock Deck
k this deck
62
Does the maximum value of the surge function increase or decrease when a is increased and b is held constant?
increase or decrease when a is increased and b is held constant? Unlock Deck
Unlock for access to all 94 flashcards in this deck.
Unlock Deck
k this deck
63
The following table shows the total sales, in thousands, since a new DVD was released.
A. Estimate the point of diminishing returns.
B. Using your answer from part (A), predict the total possible sales for the DVD.
A. Estimate the point of diminishing returns.
B. Using your answer from part (A), predict the total possible sales for the DVD.
Unlock Deck
Unlock for access to all 94 flashcards in this deck.
Unlock Deck
k this deck
64
A disease is released into a town. The number of people, in thousands infected is modeled by the equation . How many people are infected after hours?
. How many people are infected after hours? Unlock Deck
Unlock for access to all 94 flashcards in this deck.
Unlock Deck
k this deck
65
The following table gives the number of students who have joined a new school club t days after it was formed.
A. Estimate the value of t where concavity changes in this function.
B. Use your answer from part (a) to estimate the maximum membership in the club.
A. Estimate the value of t where concavity changes in this function.
B. Use your answer from part (a) to estimate the maximum membership in the club.
Unlock Deck
Unlock for access to all 94 flashcards in this deck.
Unlock Deck
k this deck
66
A disease is released into a small town. The number of people infected is modeled by the equation . What is the population at t=0 of this disease?
. What is the population at t=0 of this disease? Unlock Deck
Unlock for access to all 94 flashcards in this deck.
Unlock Deck
k this deck
67
If time, t, is in hours and concentration, C, is in ng/ml, the drug concentration curve for a drug is given by . About how many hours does it take for the drug to reach peak concentration? .
A)2.5 hours
B)8.5 hours
C)0.4 hours
D)3.4 hours
. About how many hours does it take for the drug to reach peak concentration? .A)2.5 hours
B)8.5 hours
C)0.4 hours
D)3.4 hours
Unlock Deck
Unlock for access to all 94 flashcards in this deck.
Unlock Deck
k this deck
68
The following three equations are graphed in the figure. Which graph corresponds to equation C?
A. B. C.
A.
B. C. Unlock Deck
Unlock for access to all 94 flashcards in this deck.
Unlock Deck
k this deck
69
The following table gives the concentration C, of a drug in ng/ml, at time t, in hours, after it is administered to 2 different people.
A. If the concentration for Person A is given by and the concentration for Person B is given by , would you expect bA to be larger or smaller than bB?
B. If the minimum effective concentration is 5 ng/ml, until what time is the drug effective for person A?
C. If the minimum effective concentration is 5 ng/ml, until what time is the drug effective for person B?
A. If the concentration for Person A is given by
and the concentration for Person B is given by , would you expect bA to be larger or smaller than bB?B. If the minimum effective concentration is 5 ng/ml, until what time is the drug effective for person A?
C. If the minimum effective concentration is 5 ng/ml, until what time is the drug effective for person B?
Unlock Deck
Unlock for access to all 94 flashcards in this deck.
Unlock Deck
k this deck
70
If time, t, is in hours and concentration, C, is in ng/ml, the drug concentration curve for a drug is given by . Suppose scientists wish to alter the drug so that it is effective for more hours. Would the coefficient of 9 in its concentration curve equation increase or decrease?
A)increase
B)decrease
. Suppose scientists wish to alter the drug so that it is effective for more hours. Would the coefficient of 9 in its concentration curve equation increase or decrease?A)increase
B)decrease
Unlock Deck
Unlock for access to all 94 flashcards in this deck.
Unlock Deck
k this deck
71
The demand curve for a product is given by .
A. Write revenue as a function of price and take its derivative to find the price (to the nearest cent) that will maximize revenue.
B. Find the elasticity (to two decimal places) at the price you found in part A.
.A. Write revenue as a function of price and take its derivative to find the price (to the nearest cent) that will maximize revenue.
B. Find the elasticity (to two decimal places) at the price you found in part A.
Unlock Deck
Unlock for access to all 94 flashcards in this deck.
Unlock Deck
k this deck
72
Raising the average price of an entree at a restaurant from $13 to $15 reduces the number of customers per day from 225 to 175.
A. What is the elasticity of demand to two decimal places for entrees at a price of $13?
B. Would raising the price from $13 to $15 increase or decrease the profit?
A. What is the elasticity of demand to two decimal places for entrees at a price of $13?
B. Would raising the price from $13 to $15 increase or decrease the profit?
Unlock Deck
Unlock for access to all 94 flashcards in this deck.
Unlock Deck
k this deck
73
In Wilson corners, population 2000, a rumor spreads according to the logistic model. If 5 people know the rumor at 4 PM and 110 people have heard it by 5 PM, how many people will have heard the rumor by 6 PM (to the nearest person)?
Unlock Deck
Unlock for access to all 94 flashcards in this deck.
Unlock Deck
k this deck
74
The dose response curve in the following figure is given by , where R is percent of maximum response and x is the dose of the drug in mg. The inflection point is at (10,50) and . Would be greater or less than 7 for values of x less than 10?
, where R is percent of maximum response and x is the dose of the drug in mg. The inflection point is at (10,50) and . Would be greater or less than 7 for values of x less than 10? Unlock Deck
Unlock for access to all 94 flashcards in this deck.
Unlock Deck
k this deck
75
A biologist found that the number of Drosophila fruit flies, N(t), assumes the following growth pattern if the food source is limited: .
A. How many fruit flies were there in the beginning (to the nearest fly)?
B. At what time was the population increasing most rapidly (to the nearest day)?
C. At what rate does the number of fruit flies increase after 5 days (to the nearest fly per day)?
.A. How many fruit flies were there in the beginning (to the nearest fly)?
B. At what time was the population increasing most rapidly (to the nearest day)?
C. At what rate does the number of fruit flies increase after 5 days (to the nearest fly per day)?
Unlock Deck
Unlock for access to all 94 flashcards in this deck.
Unlock Deck
k this deck
76
The rabbit population, P, in a wilderness area is approximated by the function ,
where t is the number of weeks since the rabbits were introduced into the area.
A. How many rabbits were initially introduced into the area (to the nearest rabbit)?
B. How many rabbits were in the area after 5 weeks (to the nearest rabbit)?
C. What is the carrying capacity of rabbits in the area?
,where t is the number of weeks since the rabbits were introduced into the area.
A. How many rabbits were initially introduced into the area (to the nearest rabbit)?
B. How many rabbits were in the area after 5 weeks (to the nearest rabbit)?
C. What is the carrying capacity of rabbits in the area?
Unlock Deck
Unlock for access to all 94 flashcards in this deck.
Unlock Deck
k this deck
77
A flu epidemic spreads amongst a group of people according to the formula ,
where represents the number of people that are infected by the end of day t.
A. How many people are infected by the end of the fifth day (to the nearest person)?
B. At what rate do the people become infected on day 5 (to the nearest person per day)?
,where
represents the number of people that are infected by the end of day t.A. How many people are infected by the end of the fifth day (to the nearest person)?
B. At what rate do the people become infected on day 5 (to the nearest person per day)?
Unlock Deck
Unlock for access to all 94 flashcards in this deck.
Unlock Deck
k this deck
78
A disease is released into a town. The number of people infected each day is modeled by the equation . Estimate when Estimate the value of n at this time.
. Estimate when Estimate the value of n at this time. Unlock Deck
Unlock for access to all 94 flashcards in this deck.
Unlock Deck
k this deck
79
The peak concentration of 9 ng/ml for a drug occurs 1.5 hours after a 7 mg dose is administered. Sketch a graph that represents the concentration, C, as a function of time, t.
Unlock Deck
Unlock for access to all 94 flashcards in this deck.
Unlock Deck
k this deck
80
If time, t, is in hours and concentration, C, is in ng/ml, the drug concentration curve for a drug is given by . What is the peak concentration of the drug?
A)6.0 mg
B)6.5 mg
C)2.6 mg
D)16.3 mg
. What is the peak concentration of the drug?A)6.0 mg
B)6.5 mg
C)2.6 mg
D)16.3 mg
Unlock Deck
Unlock for access to all 94 flashcards in this deck.
Unlock Deck
k this deck
Unlock Deck
Unlock for access to all 94 flashcards in this deck.


