Deck 3: Describing Bivariate Data
Full screen (f)
Question
Question
If the correlation coefficient  , then all the data points lie exactly on a straight line.
, then all the data points lie exactly on a straight line. Question
Question
Question
Question
Given that  = 400,
  = 625,
  = 350, and n = 10, the correlation coefficient is:
A) 0.70
B) 0.56
C) 0.875
D) 0.156
E) 0.141
= 400, = 625, = 350, and n = 10, the correlation coefficient is:A) 0.70
B) 0.56
C) 0.875
D) 0.156
E) 0.141
Question
Question
Question
Question
Question
Question
Question
Question
If the correlation coefficient  , then there is no linear relationship whatsoever between the dependent variable y and the independent variable x.
, then there is no linear relationship whatsoever between the dependent variable y and the independent variable x. Question
Question
Question
Question
Question
Question
Question
The number of household members, x and the amount spent on groceries per week, y (rounded to the nearest dollar) are measured for eight households in the Big Rapids area. The data are shown below: 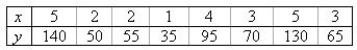 Create a raw scatterplot of these eight data points (no regression line or equation).
Find the best-fitting regression line for these data.
y = ______________
Plot the points and the best-fitting line on the same graph.
What would you estimate a household of seven to spend on groceries per week?
______________
Should you use the fitted line to estimate this amount?
______________
Why or why not?
________________________________________________________
Create a raw scatterplot of these eight data points (no regression line or equation).Find the best-fitting regression line for these data.
y = ______________
Plot the points and the best-fitting line on the same graph.
What would you estimate a household of seven to spend on groceries per week?
______________
Should you use the fitted line to estimate this amount?
______________
Why or why not?
________________________________________________________
Question
A soft drink distributor was interested in examining the relationship between the number of ads (x) for his product during prime time on a local television station and the number of sales per week (y) in thousands of cases. He compiled the figures for 20 weeks and computed the following summary information: 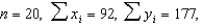
 and
and  Find the correlation coefficient for the number of ads during prime time and weekly sales.
______________
Find the best-fitting line relating the number of ads during prime time and weekly sales.
y = ______________
If the soft drink distributor ran 21 TV ads per week for his product, what would you predict his sales to be?
______________ thousand cases
and Find the correlation coefficient for the number of ads during prime time and weekly sales.______________
Find the best-fitting line relating the number of ads during prime time and weekly sales.
y = ______________
If the soft drink distributor ran 21 TV ads per week for his product, what would you predict his sales to be?
______________ thousand cases
Question
Question
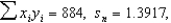
A councilman was interested in determining whether people between the ages of 18 and 30 years of age will react to a piece of legislation differently than people over 30 years of age. The legislator polled a sample of 150 people from his district. The resulting data is shown in the table below:  Construct a side-by-side bar chart.
Construct a pie chart for the 18 - 30 age group.
Construct a pie chart for the Over 30 age group.
Which of the two types of presentations in parts (a) and (b) is more easily understood?
______________
Construct a side-by-side bar chart.Construct a pie chart for the 18 - 30 age group.
Construct a pie chart for the Over 30 age group.
Which of the two types of presentations in parts (a) and (b) is more easily understood?
______________
Question
Question
When the price of gasoline gets high, consumers become very concerned about the gas mileage obtained by their cars. One consumer was interested in the relationship between car engine size (number of cylinders) and gas mileage (miles/gallon). The consumer took a random sample of 7 cars and recorded the following information:  and
and  Would you expect the correlation between engine size and gas mileage to be positive or negative?
______________
Find the correlation between engine size and gas mileage.
______________
Find the best fitting line relating car engine size and gas mileage.
y = ______________
What would you predict the gas mileage to be for a car with 6-cylinder engine size?
______________ mpg
and Would you expect the correlation between engine size and gas mileage to be positive or negative?______________
Find the correlation between engine size and gas mileage.
______________
Find the best fitting line relating car engine size and gas mileage.
y = ______________
What would you predict the gas mileage to be for a car with 6-cylinder engine size?
______________ mpg
Question
Question
Question
The manager of a movie rental store was interested in examining the relationship between the weekly take-home pay for a family and the amount that family spends weekly on recreational activities. The following output was generated using Minitab:
Covariances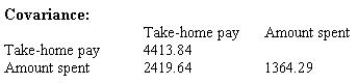 Let x = weekly take-home pay, and y = amount spent weekly on recreational activities.
a. Identify the covariance between x and y.
______________
b. Identify the variance of weekly take-home pay.
______________
c. Identify the variance of amount spent weekly on recreational activities.
______________
d. Calculate the correlation between weekly take-home pay and amount spent weekly on recreational activities.
______________
e. Interpret the correlation coefficient found in part (d).
____________________________
Covariances
Let x = weekly take-home pay, and y = amount spent weekly on recreational activities. a. Identify the covariance between x and y.
______________
b. Identify the variance of weekly take-home pay.
______________
c. Identify the variance of amount spent weekly on recreational activities.
______________
d. Calculate the correlation between weekly take-home pay and amount spent weekly on recreational activities.
______________
e. Interpret the correlation coefficient found in part (d).
____________________________
Question
Question
Given that  = 100,
  = 64,
= 64,  = 60, and n = 8, the slope of the best-fitting regression line is:
A) 0.75
B) 0.64
C) 0.60
D) 7.5
E) 6.4
= 100, = 64, = 60, and n = 8, the slope of the best-fitting regression line is:A) 0.75
B) 0.64
C) 0.60
D) 7.5
E) 6.4
Question
A law school administrator was interested in whether a student's score on the entrance exam can be used to predict a student's grade point average (GPA) after one year of law school. The administrator took a random sample of 15 students and computed the following summary information, where x = entrance exam score and y = GPA after one year:  and
and  Find the correlation between the entrance exam score and the grade point average after one year of law school.
______________
Interpret the correlation coefficient found in part (a).
____________________________
Find the best fitting line relating grade point average after on year of law school and score on the entrance exam.
y = ______________
If a student scored 91 on the entrance exam, what would you predict the student's grade point average to be after one year of law school?
______________
and Find the correlation between the entrance exam score and the grade point average after one year of law school.______________
Interpret the correlation coefficient found in part (a).
____________________________
Find the best fitting line relating grade point average after on year of law school and score on the entrance exam.
y = ______________
If a student scored 91 on the entrance exam, what would you predict the student's grade point average to be after one year of law school?
______________
Question
Question
Question
Male and female respondents to a questionnaire about gender differences are categorized into three groups according to their answers as shown below: 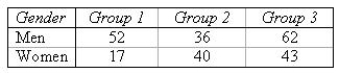 Create a side-by-side bar chart to describe these data.
Create two pie charts (one for men and one for women) to describe these data.
Men:
Women:
Which of the charts created above best depicts the difference or similarity of the responses of men and women.
______________
Create a side-by-side bar chart to describe these data.Create two pie charts (one for men and one for women) to describe these data.
Men:
Women:
Which of the charts created above best depicts the difference or similarity of the responses of men and women.
______________

Unlock Deck
Sign up to unlock the cards in this deck!
Unlock Deck
Unlock Deck
1/35
Play
Full screen (f)
Deck 3: Describing Bivariate Data
1
The best fitting line relating the dependent variable y to the independent variable x, often called the regression or least-squares line, is found by minimizing the sum of the squared differences between the data points and the line itself.
True
2
If the correlation coefficient , then all the data points lie exactly on a straight line.
, then all the data points lie exactly on a straight line.True
3
The correlation coefficient r is a number that indicates the direction and the strength of the relationship between the dependent variable y and the independent variable x.
True
4
A perfect straight line sloping upward would produce a covariance value of +1.
Unlock Deck
Unlock for access to all 35 flashcards in this deck.
Unlock Deck
k this deck
5
Given the least squares regression line y = 3.8 - 2x,
A) the relationship between x and y is positive
B) the relationship between x and y is negative
C) there is no linear relationship between x and y
D) as x decreases, so does y
E) as x increases, so does y
A) the relationship between x and y is positive
B) the relationship between x and y is negative
C) there is no linear relationship between x and y
D) as x decreases, so does y
E) as x increases, so does y
Unlock Deck
Unlock for access to all 35 flashcards in this deck.
Unlock Deck
k this deck
6
Given that = 400, = 625, = 350, and n = 10, the correlation coefficient is:
A) 0.70
B) 0.56
C) 0.875
D) 0.156
E) 0.141
= 400, = 625, = 350, and n = 10, the correlation coefficient is:A) 0.70
B) 0.56
C) 0.875
D) 0.156
E) 0.141
Unlock Deck
Unlock for access to all 35 flashcards in this deck.
Unlock Deck
k this deck
7
If the correlation coefficient between the independent variable x and the dependent variable y is 0.87, then the best fitting line would have a slope equal to 0.87.
Unlock Deck
Unlock for access to all 35 flashcards in this deck.
Unlock Deck
k this deck
8
Generally speaking, if two quantitative variables are unrelated, the covariance will be a positive or negative number close to zero.
Unlock Deck
Unlock for access to all 35 flashcards in this deck.
Unlock Deck
k this deck
9
The standard deviation is a measure of the linear relationship between two quantitative variables.
Unlock Deck
Unlock for access to all 35 flashcards in this deck.
Unlock Deck
k this deck
10
The scatterplot is a graph that is used to graphically represent the relationship between two quantitative variables.
Unlock Deck
Unlock for access to all 35 flashcards in this deck.
Unlock Deck
k this deck
11
When constructing a scatterplot, the independent variable (x) is placed on the horizontal axis, and the dependent variable (y) is placed on the vertical axis.
Unlock Deck
Unlock for access to all 35 flashcards in this deck.
Unlock Deck
k this deck
12
A perfect correlation between two variables will always produce a correlation coefficient of +1.0.
Unlock Deck
Unlock for access to all 35 flashcards in this deck.
Unlock Deck
k this deck
13
A perfect straight line sloping downward would produce a covariance value of -1.
Unlock Deck
Unlock for access to all 35 flashcards in this deck.
Unlock Deck
k this deck
14
If the correlation coefficient , then there is no linear relationship whatsoever between the dependent variable y and the independent variable x.
, then there is no linear relationship whatsoever between the dependent variable y and the independent variable x. Unlock Deck
Unlock for access to all 35 flashcards in this deck.
Unlock Deck
k this deck
15
Generally speaking, if two variables are unrelated (as one increases, the other shows no pattern), the covariance will be:
A) a large positive number
B) a large negative number
C) a positive or negative number close to zero
D) a positive or negative number close to 100
E) none of these
A) a large positive number
B) a large negative number
C) a positive or negative number close to zero
D) a positive or negative number close to 100
E) none of these
Unlock Deck
Unlock for access to all 35 flashcards in this deck.
Unlock Deck
k this deck
16
Which of the following are measures of the linear relationship between two variables?
A) the covariance
B) the correlation coefficient
C) the variance
D) both the covariance and the correlation coefficient
E) both the correlation coefficient and the variance
A) the covariance
B) the correlation coefficient
C) the variance
D) both the covariance and the correlation coefficient
E) both the correlation coefficient and the variance
Unlock Deck
Unlock for access to all 35 flashcards in this deck.
Unlock Deck
k this deck
17
If two variables have a correlation coefficient equal to 0.005, this means that there is no relationship between the two variables.
Unlock Deck
Unlock for access to all 35 flashcards in this deck.
Unlock Deck
k this deck
18
If the linear relationship between the dependent and independent variables is positive, the scatterplot will show the data points on the (x, y) plane generally moving from the lower left corner to the upper right corner.
Unlock Deck
Unlock for access to all 35 flashcards in this deck.
Unlock Deck
k this deck
19
A scatterplot is not particularly useful in determining if the relationship between the independent and dependent variables is not linear.
Unlock Deck
Unlock for access to all 35 flashcards in this deck.
Unlock Deck
k this deck
20
If a regression line has a y-intercept of 6.75 and a slope of 1.25, then when x = 2 the actual value of y is:
A) 9.25
B) 8.75
C) 2.25
D) 1.45
E) unknown
A) 9.25
B) 8.75
C) 2.25
D) 1.45
E) unknown
Unlock Deck
Unlock for access to all 35 flashcards in this deck.
Unlock Deck
k this deck
21
The number of household members, x and the amount spent on groceries per week, y (rounded to the nearest dollar) are measured for eight households in the Big Rapids area. The data are shown below: Create a raw scatterplot of these eight data points (no regression line or equation).
Find the best-fitting regression line for these data.
y = ______________
Plot the points and the best-fitting line on the same graph.
What would you estimate a household of seven to spend on groceries per week?
______________
Should you use the fitted line to estimate this amount?
______________
Why or why not?
________________________________________________________
Create a raw scatterplot of these eight data points (no regression line or equation).Find the best-fitting regression line for these data.
y = ______________
Plot the points and the best-fitting line on the same graph.
What would you estimate a household of seven to spend on groceries per week?
______________
Should you use the fitted line to estimate this amount?
______________
Why or why not?
________________________________________________________
Unlock Deck
Unlock for access to all 35 flashcards in this deck.
Unlock Deck
k this deck
22
A soft drink distributor was interested in examining the relationship between the number of ads (x) for his product during prime time on a local television station and the number of sales per week (y) in thousands of cases. He compiled the figures for 20 weeks and computed the following summary information: and Find the correlation coefficient for the number of ads during prime time and weekly sales.
______________
Find the best-fitting line relating the number of ads during prime time and weekly sales.
y = ______________
If the soft drink distributor ran 21 TV ads per week for his product, what would you predict his sales to be?
______________ thousand cases
and Find the correlation coefficient for the number of ads during prime time and weekly sales.______________
Find the best-fitting line relating the number of ads during prime time and weekly sales.
y = ______________
If the soft drink distributor ran 21 TV ads per week for his product, what would you predict his sales to be?
______________ thousand cases
Unlock Deck
Unlock for access to all 35 flashcards in this deck.
Unlock Deck
k this deck
23
A manager of a supermarket wishes to show the relationship between the number of customers who come to the store on weekends, and the total volume of sales (in dollars) during the same weekend. Which of the following graphs would likely be most useful if the manager has a sample of 52 weekends worth of data?
A) bar chart
B) pie chart
C) box and whisker plot
D) scatterplot
E) histogram
A) bar chart
B) pie chart
C) box and whisker plot
D) scatterplot
E) histogram
Unlock Deck
Unlock for access to all 35 flashcards in this deck.
Unlock Deck
k this deck
24
A councilman was interested in determining whether people between the ages of 18 and 30 years of age will react to a piece of legislation differently than people over 30 years of age. The legislator polled a sample of 150 people from his district. The resulting data is shown in the table below: Construct a side-by-side bar chart.
Construct a pie chart for the 18 - 30 age group.
Construct a pie chart for the Over 30 age group.
Which of the two types of presentations in parts (a) and (b) is more easily understood?
______________
Construct a side-by-side bar chart.Construct a pie chart for the 18 - 30 age group.
Construct a pie chart for the Over 30 age group.
Which of the two types of presentations in parts (a) and (b) is more easily understood?
______________
Unlock Deck
Unlock for access to all 35 flashcards in this deck.
Unlock Deck
k this deck
25
Which value of the correlation coefficient r indicates a stronger correlation than 0.72?
A) 0.65
B) -0.75
C) 0.60
D) -0.70
E) 0.55
A) 0.65
B) -0.75
C) 0.60
D) -0.70
E) 0.55
Unlock Deck
Unlock for access to all 35 flashcards in this deck.
Unlock Deck
k this deck
26
When the price of gasoline gets high, consumers become very concerned about the gas mileage obtained by their cars. One consumer was interested in the relationship between car engine size (number of cylinders) and gas mileage (miles/gallon). The consumer took a random sample of 7 cars and recorded the following information: and Would you expect the correlation between engine size and gas mileage to be positive or negative?
______________
Find the correlation between engine size and gas mileage.
______________
Find the best fitting line relating car engine size and gas mileage.
y = ______________
What would you predict the gas mileage to be for a car with 6-cylinder engine size?
______________ mpg
and Would you expect the correlation between engine size and gas mileage to be positive or negative?______________
Find the correlation between engine size and gas mileage.
______________
Find the best fitting line relating car engine size and gas mileage.
y = ______________
What would you predict the gas mileage to be for a car with 6-cylinder engine size?
______________ mpg
Unlock Deck
Unlock for access to all 35 flashcards in this deck.
Unlock Deck
k this deck
27
In constructing a scatterplot, it would not be appropriate to:
A) label the x axis
B) label the y axis
C) label the graph using titles
D) connect the data points on the graphs with straight lines
E) draw the best fitting line on the graph
A) label the x axis
B) label the y axis
C) label the graph using titles
D) connect the data points on the graphs with straight lines
E) draw the best fitting line on the graph
Unlock Deck
Unlock for access to all 35 flashcards in this deck.
Unlock Deck
k this deck
28
A scatterplot can be used to determine the relationship between:
A) two qualitative variables
B) two quantitative variables
C) one qualitative variable and one quantitative variable
D) all of these
E) none of these
A) two qualitative variables
B) two quantitative variables
C) one qualitative variable and one quantitative variable
D) all of these
E) none of these
Unlock Deck
Unlock for access to all 35 flashcards in this deck.
Unlock Deck
k this deck
29
The manager of a movie rental store was interested in examining the relationship between the weekly take-home pay for a family and the amount that family spends weekly on recreational activities. The following output was generated using Minitab:
Covariances Let x = weekly take-home pay, and y = amount spent weekly on recreational activities.
a. Identify the covariance between x and y.
______________
b. Identify the variance of weekly take-home pay.
______________
c. Identify the variance of amount spent weekly on recreational activities.
______________
d. Calculate the correlation between weekly take-home pay and amount spent weekly on recreational activities.
______________
e. Interpret the correlation coefficient found in part (d).
____________________________
Covariances
Let x = weekly take-home pay, and y = amount spent weekly on recreational activities. a. Identify the covariance between x and y.
______________
b. Identify the variance of weekly take-home pay.
______________
c. Identify the variance of amount spent weekly on recreational activities.
______________
d. Calculate the correlation between weekly take-home pay and amount spent weekly on recreational activities.
______________
e. Interpret the correlation coefficient found in part (d).
____________________________
Unlock Deck
Unlock for access to all 35 flashcards in this deck.
Unlock Deck
k this deck
30
The best-fitting regression line can be used to:
A) find the actual value of y for a given value of x
B) estimate or predict the value of y for a given value of x
C) calculate the correlation coefficient
D) all of these
E) none of these
A) find the actual value of y for a given value of x
B) estimate or predict the value of y for a given value of x
C) calculate the correlation coefficient
D) all of these
E) none of these
Unlock Deck
Unlock for access to all 35 flashcards in this deck.
Unlock Deck
k this deck
31
Given that = 100, = 64, = 60, and n = 8, the slope of the best-fitting regression line is:
A) 0.75
B) 0.64
C) 0.60
D) 7.5
E) 6.4
= 100, = 64, = 60, and n = 8, the slope of the best-fitting regression line is:A) 0.75
B) 0.64
C) 0.60
D) 7.5
E) 6.4
Unlock Deck
Unlock for access to all 35 flashcards in this deck.
Unlock Deck
k this deck
32
A law school administrator was interested in whether a student's score on the entrance exam can be used to predict a student's grade point average (GPA) after one year of law school. The administrator took a random sample of 15 students and computed the following summary information, where x = entrance exam score and y = GPA after one year: and Find the correlation between the entrance exam score and the grade point average after one year of law school.
______________
Interpret the correlation coefficient found in part (a).
____________________________
Find the best fitting line relating grade point average after on year of law school and score on the entrance exam.
y = ______________
If a student scored 91 on the entrance exam, what would you predict the student's grade point average to be after one year of law school?
______________
and Find the correlation between the entrance exam score and the grade point average after one year of law school.______________
Interpret the correlation coefficient found in part (a).
____________________________
Find the best fitting line relating grade point average after on year of law school and score on the entrance exam.
y = ______________
If a student scored 91 on the entrance exam, what would you predict the student's grade point average to be after one year of law school?
______________
Unlock Deck
Unlock for access to all 35 flashcards in this deck.
Unlock Deck
k this deck
33
A perfect straight line sloping downward would produce a correlation coefficient equal to:
A) +1
B) -1
C) +2
D) -2
E) 0
A) +1
B) -1
C) +2
D) -2
E) 0
Unlock Deck
Unlock for access to all 35 flashcards in this deck.
Unlock Deck
k this deck
34
If all the points in a scatterplot lie on the least squares regression line, then the correlation coefficient r must be:
A) 1.0
B) -1.0
C) either 1.0 or -1.0
D) 100
E) 10
A) 1.0
B) -1.0
C) either 1.0 or -1.0
D) 100
E) 10
Unlock Deck
Unlock for access to all 35 flashcards in this deck.
Unlock Deck
k this deck
35
Male and female respondents to a questionnaire about gender differences are categorized into three groups according to their answers as shown below: Create a side-by-side bar chart to describe these data.
Create two pie charts (one for men and one for women) to describe these data.
Men:
Women:
Which of the charts created above best depicts the difference or similarity of the responses of men and women.
______________
Create a side-by-side bar chart to describe these data.Create two pie charts (one for men and one for women) to describe these data.
Men:
Women:
Which of the charts created above best depicts the difference or similarity of the responses of men and women.
______________
Unlock Deck
Unlock for access to all 35 flashcards in this deck.
Unlock Deck
k this deck
Unlock Deck
Unlock for access to all 35 flashcards in this deck.


