Deck 6: Statistics
Full screen (f)
Question
An auto dealer's sales numbers are shown in the table below. Find the median price for the cars sold in July. 
A)$25,000
B)$20,000
C)$15,000
D)$22,500
A)$25,000
B)$20,000
C)$15,000
D)$22,500
Question
Question
Question
Question
Question
Question
Question
Question
Question
An auto dealer's sales numbers are shown in the table below. Find the mean price for the cars sold in June. 
A)$20,000.00
B)$18,679.25
C)$18,737.86
D)$19,047.62
A)$20,000.00
B)$18,679.25
C)$18,737.86
D)$19,047.62
Question
Question
Question
An auto dealer's sales numbers are shown in the table below. Find the mode price for the cars sold in August. 
A)$25,000
B)$20,000
C)$15,000
D)$17,500
A)$25,000
B)$20,000
C)$15,000
D)$17,500
Question
Question
Question
Question
For a certain number of vehicles, their mileages are recorded and summarized using a boxplot. Which of the following is NOT correct? 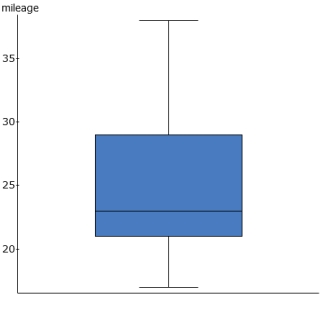
A)The mean is around 22.5.
B)The difference between the maximum and minimum is about 20.
C)The spread from the first quartile to the third quartile is about 8.
D)The median is closer to the first quartile than the third quartile.
A)The mean is around 22.5.
B)The difference between the maximum and minimum is about 20.
C)The spread from the first quartile to the third quartile is about 8.
D)The median is closer to the first quartile than the third quartile.
Question
Question
Question
Question
Question
Question
For a 95% level of confidence and a sample size of n, the margin of error is approximately:
A)
B)
C)
D)
A)
B)
C)
D)
Question
Question
Question
Question
Question
Question
Question
Question
Question
Question
Question
Question
Question
Question
Question
Question
Question
The z-score can be used to compare the relative location of values from the sets of data with different distribution. Suppose that a Statistics class gave two midterms so far. If you scored 83 on Midterm 1 and 85 on Midterm 2, which score is relatively higher than the other? Use the information below. 
A)83
B)85
C)They are equivalent.
D)Not enough information.
A)83
B)85
C)They are equivalent.
D)Not enough information.
Question
Question
Question
Question
Question
Question
Question
Question
For a 90% confidence level and a sample size of n, the margin of error is approximately %. How many people should we survey if we'd like to have a 3% margin of error with a 90% confidence interval? 
A)1000
B)748
C)692
D)500
A)1000
B)748
C)692
D)500
Question
Question
For a 90% confidence level and a sample size of n, the margin of error is approximately %. If you survey 1500 people, what is the margin of error for a 90% confidence interval? 
A)2.1%
B)2.3%
C)2.5%
D)2.7%
A)2.1%
B)2.3%
C)2.5%
D)2.7%
Question
Question
Question
Question
Question
Question
Question
Question
Question
Question
For a 95% level of confidence, the sample size needed to get a margin of error of m percentage points can be approximated using:
A)
B)
C)
D)
A)
B)
C)
D)
Question
Question
Suppose that for a certain illness, the probability is 40% that a given patient will improve without treatment. Then the probability that at least n out of 20 patients will improve without treatment is given in the following table: 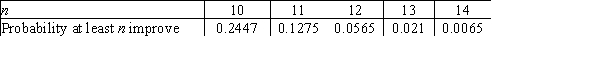 We gave an experimental drug to 20 patients who have the illness and 11 patients showed improvement. What is the p-value?
A)0.25
B)0.13
C)0.06
D)0.02
We gave an experimental drug to 20 patients who have the illness and 11 patients showed improvement. What is the p-value?A)0.25
B)0.13
C)0.06
D)0.02
Question
Suppose that for a certain illness, the probability is 40% that a given patient will improve without treatment. Then the probability that at least n out of 20 patients will improve without treatment is given in the following table: 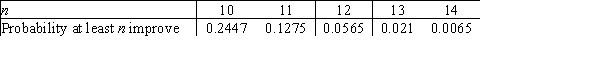 Suppose we count the test significant if the p-value is 0.05 or less. How many patients must show improvement in order to make the test statistically significant?
A)11
B)12
C)13
D)14
Suppose we count the test significant if the p-value is 0.05 or less. How many patients must show improvement in order to make the test statistically significant?A)11
B)12
C)13
D)14
Question
Question
Question
Determine which figure shows the weakest linear relationship.
A)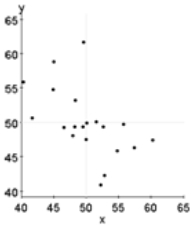
B)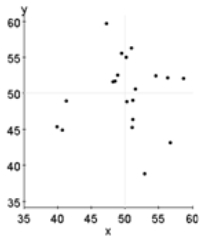
C)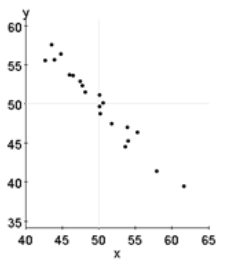
D)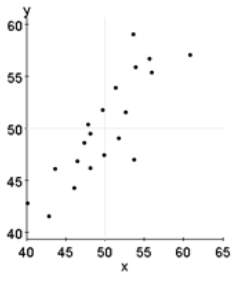
A)
B)
C)
D)
Question
Question
Question
Determine which figure shows the strongest linear relationship.
A)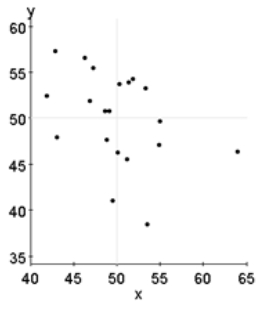
B)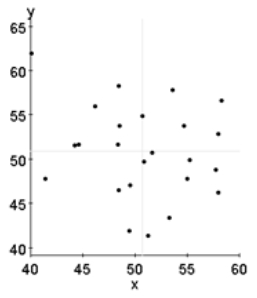
C)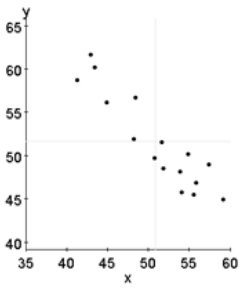
D)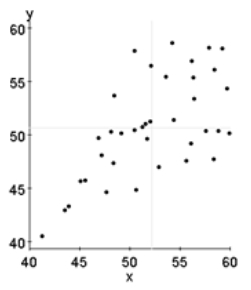
A)
B)
C)
D)

Unlock Deck
Sign up to unlock the cards in this deck!
Unlock Deck
Unlock Deck
1/69
Play
Full screen (f)
Deck 6: Statistics
1
An auto dealer's sales numbers are shown in the table below. Find the median price for the cars sold in July.
A)$25,000
B)$20,000
C)$15,000
D)$22,500
A)$25,000
B)$20,000
C)$15,000
D)$22,500
C
2
Half of students in a class got 77% on a test while the remaining half got 83%. What is the standard deviation of the test scores for the class?
A)2.45
B)4.24
C)3.00
D)1.71
A)2.45
B)4.24
C)3.00
D)1.71
C
3
A(n) _______________ is a data point that is significantly different from most of the data.
A)foreigner
B)outlier
C)quartile
D)anomaly
A)foreigner
B)outlier
C)quartile
D)anomaly
B
4
If data are normally distributed, which of the following is NOT true?
A)The distribution graph is a bell-shaped curve.
B)The mean and median are the same.
C)Most of the data tend to be clustered relatively far from the mean.
D)The data are symmetrically distributed above and below the mean.
A)The distribution graph is a bell-shaped curve.
B)The mean and median are the same.
C)Most of the data tend to be clustered relatively far from the mean.
D)The data are symmetrically distributed above and below the mean.
Unlock Deck
Unlock for access to all 69 flashcards in this deck.
Unlock Deck
k this deck
5
Michael's five test scores in his physics class were 75, 67, 88, 91, and 84. What was his mean test score?
A)84
B)81
C)79
D)88
A)84
B)81
C)79
D)88
Unlock Deck
Unlock for access to all 69 flashcards in this deck.
Unlock Deck
k this deck
6
The _______________ quartile is the median of the upper half of the numbers in a list.
A)first
B)second
C)third
D)fourth
A)first
B)second
C)third
D)fourth
Unlock Deck
Unlock for access to all 69 flashcards in this deck.
Unlock Deck
k this deck
7
The _______________ of a set of data measures the frequency with which each data point occurs.
A)distribution
B)quartiles
C)mean
D)spread
A)distribution
B)quartiles
C)mean
D)spread
Unlock Deck
Unlock for access to all 69 flashcards in this deck.
Unlock Deck
k this deck
8
A _______________ is a pictorial display of the five-number summary.
A)histogram
B)boxplot
C)scatterplot
D)line graph
A)histogram
B)boxplot
C)scatterplot
D)line graph
Unlock Deck
Unlock for access to all 69 flashcards in this deck.
Unlock Deck
k this deck
9
XYZ Corporation recorded the number of employee absences each week over a period of 10 weeks. The result is the data list 5, 3, 4, 1, 4, 7, 2, 6, 3, 5. Find the mean number of absences each week.
A)3
B)4
C)5
D)6
A)3
B)4
C)5
D)6
Unlock Deck
Unlock for access to all 69 flashcards in this deck.
Unlock Deck
k this deck
10
An auto dealer's sales numbers are shown in the table below. Find the mean price for the cars sold in June.
A)$20,000.00
B)$18,679.25
C)$18,737.86
D)$19,047.62
A)$20,000.00
B)$18,679.25
C)$18,737.86
D)$19,047.62
Unlock Deck
Unlock for access to all 69 flashcards in this deck.
Unlock Deck
k this deck
11
If a number in a data set occurs more frequently than any other number, it is called the _______________ of the data.
A)mean
B)median
C)mode
D)average
A)mean
B)median
C)mode
D)average
Unlock Deck
Unlock for access to all 69 flashcards in this deck.
Unlock Deck
k this deck
12
The median of a list of numbers arranged from smallest to largest is the _______________ number.
A)first
B)last
C)middle
D)average
A)first
B)last
C)middle
D)average
Unlock Deck
Unlock for access to all 69 flashcards in this deck.
Unlock Deck
k this deck
13
An auto dealer's sales numbers are shown in the table below. Find the mode price for the cars sold in August.
A)$25,000
B)$20,000
C)$15,000
D)$17,500
A)$25,000
B)$20,000
C)$15,000
D)$17,500
Unlock Deck
Unlock for access to all 69 flashcards in this deck.
Unlock Deck
k this deck
14
The standard deviation is a measure of how much the data are spread out from the mean.
A)median
B)mean
C)mode
D)standard deviation
A)median
B)mean
C)mode
D)standard deviation
Unlock Deck
Unlock for access to all 69 flashcards in this deck.
Unlock Deck
k this deck
15
The standard deviation is a measure of how much the data are spread out from the mean.
Unlock Deck
Unlock for access to all 69 flashcards in this deck.
Unlock Deck
k this deck
16
The mean of a list of numbers is the product of the numbers divided by the number of entries in the list.
Unlock Deck
Unlock for access to all 69 flashcards in this deck.
Unlock Deck
k this deck
17
For a certain number of vehicles, their mileages are recorded and summarized using a boxplot. Which of the following is NOT correct?
A)The mean is around 22.5.
B)The difference between the maximum and minimum is about 20.
C)The spread from the first quartile to the third quartile is about 8.
D)The median is closer to the first quartile than the third quartile.
A)The mean is around 22.5.
B)The difference between the maximum and minimum is about 20.
C)The spread from the first quartile to the third quartile is about 8.
D)The median is closer to the first quartile than the third quartile.
Unlock Deck
Unlock for access to all 69 flashcards in this deck.
Unlock Deck
k this deck
18
XYZ Corporation recorded the number of employee absences each week over a period of 10 weeks. The result is the data list 5, 3, 4, 1, 4, 7, 2, 6, 3, 5. Find the standard deviation of the number of absences each week.
A)0.55
B)1.00
C)1.73
D)1.83
A)0.55
B)1.00
C)1.73
D)1.83
Unlock Deck
Unlock for access to all 69 flashcards in this deck.
Unlock Deck
k this deck
19
Michael's five test scores in his physics class were 75, 67, 88, 91, and 84. What was his median test score?
A)84
B)81
C)79
D)88
A)84
B)81
C)79
D)88
Unlock Deck
Unlock for access to all 69 flashcards in this deck.
Unlock Deck
k this deck
20
Suppose that every student in your class scored 75% on their first test. Find the standard deviation of the exam scores.
A)0
B)1
C)0.75
D)0.87
A)0
B)1
C)0.75
D)0.87
Unlock Deck
Unlock for access to all 69 flashcards in this deck.
Unlock Deck
k this deck
21
A six-year study in a certain country found that birth weights of newborns were normally distributed, with a mean of 3758 grams and a standard deviation of 496 grams. What is the z-score for a newborn weighing 4000 grams?
A)0.81
B)0.73
C)0.61
D)0.49
A)0.81
B)0.73
C)0.61
D)0.49
Unlock Deck
Unlock for access to all 69 flashcards in this deck.
Unlock Deck
k this deck
22
To find the confidence interval, adjust the result of the poll by adding and subtracting the ______________.
A)average
B)margin of error
C)confidence level
D)median
A)average
B)margin of error
C)confidence level
D)median
Unlock Deck
Unlock for access to all 69 flashcards in this deck.
Unlock Deck
k this deck
23
For a 95% level of confidence and a sample size of n, the margin of error is approximately:
A)
B)
C)
D)
A)
B)
C)
D)
Unlock Deck
Unlock for access to all 69 flashcards in this deck.
Unlock Deck
k this deck
24
It is found that the number of raisins in a box of a popular cereal is normally distributed, with a mean of 142 raisins per box and a standard deviation of 11 raisins. Your cereal box has 159 raisins. What is the z-score for this box of cereal?
A)2.71
B)2.47
C)1.55
D)1.74
A)2.71
B)2.47
C)1.55
D)1.74
Unlock Deck
Unlock for access to all 69 flashcards in this deck.
Unlock Deck
k this deck
25
It is known that in the absence of treatment, 68% of the patients with a certain illness will improve. The central limit theorem tells us that the percentages of patients in groups of 500 that improve in the absence of treatment are approximately normally distributed. Find the mean of the normal distribution given by the central limit theorem.
A)72%
B)59%
C)34%
D)68%
A)72%
B)59%
C)34%
D)68%
Unlock Deck
Unlock for access to all 69 flashcards in this deck.
Unlock Deck
k this deck
26
The _______________ for a number relative to a list of data is the percentage of data points that are less than or equal to that number.
A)z-score
B)percentile
C)quartile
D)t-score
A)z-score
B)percentile
C)quartile
D)t-score
Unlock Deck
Unlock for access to all 69 flashcards in this deck.
Unlock Deck
k this deck
27
For data points above the mean, the z-score is _______________.
A)positive
B)negative
C)zero
D)undefined
A)positive
B)negative
C)zero
D)undefined
Unlock Deck
Unlock for access to all 69 flashcards in this deck.
Unlock Deck
k this deck
28
Ridge counts on fingerprints are approximately normally distributed, with a mean of about 140 and a standard deviation of 50. Which of the following intervals will contain 47.5% of the population?
A)140 ± 50 ridges
B)90 ± 100 ridges
C)140 ± 100 ridges
D)190 ± 50 ridges
A)140 ± 50 ridges
B)90 ± 100 ridges
C)140 ± 100 ridges
D)190 ± 50 ridges
Unlock Deck
Unlock for access to all 69 flashcards in this deck.
Unlock Deck
k this deck
29
Suppose we toss 150 fair coins and record the percentage of heads. According to the central limit theorem, the percentages of heads resulting from such experiments are approximately normally distributed. Find the standard deviation of this normal distribution.
A)5.0%
B)4.5%
C)4.1%
D)3.7%
A)5.0%
B)4.5%
C)4.1%
D)3.7%
Unlock Deck
Unlock for access to all 69 flashcards in this deck.
Unlock Deck
k this deck
30
If we construct a confidence interval from the result of a poll, then the interval should contain the true result.
Unlock Deck
Unlock for access to all 69 flashcards in this deck.
Unlock Deck
k this deck
31
The IQ (Intelligence Quotient) test scores are normally distributed and are scaled to a mean of 100 and a standard deviation of 15. If a person's IQ has a z-score of 1.8, what is the IQ score?
A)124
B)127
C)129
D)131
A)124
B)127
C)129
D)131
Unlock Deck
Unlock for access to all 69 flashcards in this deck.
Unlock Deck
k this deck
32
Ridge counts on fingerprints are approximately normally distributed, with a mean of about 140 and a standard deviation of 50. It then follows that 68% of the population will have:
A)140 ± 50 ridges
B)140 ± 68 ridges
C)140 ± 100 ridges
D)140 ± 150 ridges
A)140 ± 50 ridges
B)140 ± 68 ridges
C)140 ± 100 ridges
D)140 ± 150 ridges
Unlock Deck
Unlock for access to all 69 flashcards in this deck.
Unlock Deck
k this deck
33
The _______________ of a poll tells the percentage of such polls in which the confidence interval includes the true result.
A)margin of error
B)interpolation
C)confidence level
D)extrapolation
A)margin of error
B)interpolation
C)confidence level
D)extrapolation
Unlock Deck
Unlock for access to all 69 flashcards in this deck.
Unlock Deck
k this deck
34
The average yearly high temperature in a certain city is recorded. It is found that the mean temperature is 70.2°F with a standard deviation of 8.2°F. Assuming that the data are normally distributed, in what range should 95% of the data lie?
A)53.8°F - 86.6°F
B)62.0°F - 78.4°F
C)47.7°F - 59.9°F
D)45.6°F - 94.8°F
A)53.8°F - 86.6°F
B)62.0°F - 78.4°F
C)47.7°F - 59.9°F
D)45.6°F - 94.8°F
Unlock Deck
Unlock for access to all 69 flashcards in this deck.
Unlock Deck
k this deck
35
It is known that in the absence of treatment, 68% of the patients with a certain illness will improve. The central limit theorem tells us that the percentages of patients in groups of 500 that improve in the absence of treatment are approximately normally distributed. Find the standard deviation of the normal distribution given by the central limit theorem.
A)2.1%
B)2.5%
C)3.2%
D)4.4%
A)2.1%
B)2.5%
C)3.2%
D)4.4%
Unlock Deck
Unlock for access to all 69 flashcards in this deck.
Unlock Deck
k this deck
36
If a set of data is normally distributed, then about _______________ of the data lie within one standard deviation below the mean.
A)34%
B)47.5%
C)68%
D)95%
A)34%
B)47.5%
C)68%
D)95%
Unlock Deck
Unlock for access to all 69 flashcards in this deck.
Unlock Deck
k this deck
37
The average yearly high temperature in a certain city is recorded. It is found that the mean temperature is 70.2°F with a standard deviation of 8.2°F. Assuming that the data are normally distributed, in what range should 68% of the data lie?
A)53.8°F - 86.6°F
B)62.0°F - 78.4°F
C)47.7°F - 59.9°F
D)45.6°F - 94.8°F
A)53.8°F - 86.6°F
B)62.0°F - 78.4°F
C)47.7°F - 59.9°F
D)45.6°F - 94.8°F
Unlock Deck
Unlock for access to all 69 flashcards in this deck.
Unlock Deck
k this deck
38
If a set of data is normally distributed, then about _______________ of the data lie within two standard deviations above the mean.
A)34%
B)47.5%
C)68%
D)95%
A)34%
B)47.5%
C)68%
D)95%
Unlock Deck
Unlock for access to all 69 flashcards in this deck.
Unlock Deck
k this deck
39
Assume we know that 20% of Americans suffer from a certain type of allergy. Suppose we take a random sample of 8000 Americans and record the percentage who suffer from this allergy. What guarantees that percentages from such a survey will be normally distributed?
A)The law of large numbers
B)The general survey theorem
C)The central limit theorem
D)The law of survey
A)The law of large numbers
B)The general survey theorem
C)The central limit theorem
D)The law of survey
Unlock Deck
Unlock for access to all 69 flashcards in this deck.
Unlock Deck
k this deck
40
The z-score can be used to compare the relative location of values from the sets of data with different distribution. Suppose that a Statistics class gave two midterms so far. If you scored 83 on Midterm 1 and 85 on Midterm 2, which score is relatively higher than the other? Use the information below.
A)83
B)85
C)They are equivalent.
D)Not enough information.
A)83
B)85
C)They are equivalent.
D)Not enough information.
Unlock Deck
Unlock for access to all 69 flashcards in this deck.
Unlock Deck
k this deck
41
The correlation coefficient always lies between -1 and 1 inclusive.
Unlock Deck
Unlock for access to all 69 flashcards in this deck.
Unlock Deck
k this deck
42
A news article refers to a poll that "surveyed 978 registered voters and carries a plus or minus 3.5% margin of error." Assuming a 95% confidence interval, compute the true margin of error.
A)3.2%
B)3.3%
C)3.4%
D)3.5%
A)3.2%
B)3.3%
C)3.4%
D)3.5%
Unlock Deck
Unlock for access to all 69 flashcards in this deck.
Unlock Deck
k this deck
43
A polling organization conducts a poll by making a random survey of 1250 people. Estimate the margin of error at a confidence interval of 95%.
A)1.25%
B)2.50%
C)2.83%
D)2.95%
A)1.25%
B)2.50%
C)2.83%
D)2.95%
Unlock Deck
Unlock for access to all 69 flashcards in this deck.
Unlock Deck
k this deck
44
The results of a clinical trial are considered to be statistically significant if they are unlikely to have occurred by chance alone.
Unlock Deck
Unlock for access to all 69 flashcards in this deck.
Unlock Deck
k this deck
45
By what factor should the sample size in a poll be increased in order to cut the margin of error in half?
A)2
B)4
C)8
D)9
A)2
B)4
C)8
D)9
Unlock Deck
Unlock for access to all 69 flashcards in this deck.
Unlock Deck
k this deck
46
If we conduct a poll of 1600 people, then what is the approximate margin of error for a 95% confidence interval?
A)2.5%
B)2.8%
C)3.1%
D)3.4%
A)2.5%
B)2.8%
C)3.1%
D)3.4%
Unlock Deck
Unlock for access to all 69 flashcards in this deck.
Unlock Deck
k this deck
47
A poll on a cigarette tax increase includes the following: "In the past decade, cigarette smokers have been targeted five times for tax increases. Do you favor another cigarette tax increase?" Does this question show any bias?
A)Yes, it is biased against the tax increase.
B)Yes, it is biased in favor of the tax increase.
C)No, it is not biased.
D)No, it is unrelated to the tax increase.
A)Yes, it is biased against the tax increase.
B)Yes, it is biased in favor of the tax increase.
C)No, it is not biased.
D)No, it is unrelated to the tax increase.
Unlock Deck
Unlock for access to all 69 flashcards in this deck.
Unlock Deck
k this deck
48
For a 90% confidence level and a sample size of n, the margin of error is approximately %. How many people should we survey if we'd like to have a 3% margin of error with a 90% confidence interval?
A)1000
B)748
C)692
D)500
A)1000
B)748
C)692
D)500
Unlock Deck
Unlock for access to all 69 flashcards in this deck.
Unlock Deck
k this deck
49
A polling organization conducts a poll by making a random survey and is willing to accept a margin of error of 4% at a confidence level of 95%. What should the sample size be?
A)625
B)750
C)380
D)500
A)625
B)750
C)380
D)500
Unlock Deck
Unlock for access to all 69 flashcards in this deck.
Unlock Deck
k this deck
50
For a 90% confidence level and a sample size of n, the margin of error is approximately %. If you survey 1500 people, what is the margin of error for a 90% confidence interval?
A)2.1%
B)2.3%
C)2.5%
D)2.7%
A)2.1%
B)2.3%
C)2.5%
D)2.7%
Unlock Deck
Unlock for access to all 69 flashcards in this deck.
Unlock Deck
k this deck
51
We say that two numerical variables are _______________ correlated if an increase in one of them accompanies a decrease in the other.
A)positively
B)negatively
C)neutrally
D)not
A)positively
B)negatively
C)neutrally
D)not
Unlock Deck
Unlock for access to all 69 flashcards in this deck.
Unlock Deck
k this deck
52
The _______________ measures the probability that the outcome of a clinical trial would occur by chance alone if the treatment had no effect.
A)level of significance
B)p-value
C)odd probability
D)critical value
A)level of significance
B)p-value
C)odd probability
D)critical value
Unlock Deck
Unlock for access to all 69 flashcards in this deck.
Unlock Deck
k this deck
53
A polling organization conducts a poll by making a random survey and is willing to accept a margin of error of 3.5% at a confidence level of 95%. What should the sample size be?
A)350
B)763
C)817
D)1023
A)350
B)763
C)817
D)1023
Unlock Deck
Unlock for access to all 69 flashcards in this deck.
Unlock Deck
k this deck
54
A correlation coefficient whose magnitude is between 0.5 and 0.8 indicates _______________ linear correlation.
A)no
B)weak
C)moderate
D)strong
A)no
B)weak
C)moderate
D)strong
Unlock Deck
Unlock for access to all 69 flashcards in this deck.
Unlock Deck
k this deck
55
A poll on a cigarette tax increase includes the following: "Last year, cigarette taxes funded an extra one hundred child healthcare projects in the state. Do you favor a cigarette tax increase?" Does this question show any bias?
A)Yes, it is biased against the tax increase.
B)Yes, it is biased in favor of the tax increase.
C)No, it is not biased.
D)No, it is unrelated to the tax increase.
A)Yes, it is biased against the tax increase.
B)Yes, it is biased in favor of the tax increase.
C)No, it is not biased.
D)No, it is unrelated to the tax increase.
Unlock Deck
Unlock for access to all 69 flashcards in this deck.
Unlock Deck
k this deck
56
A _______________ p-value is usually interpreted as evidence that the event in question is unlikely to be due to chance alone.
A)large
B)small
C)negative
D)positive
A)large
B)small
C)negative
D)positive
Unlock Deck
Unlock for access to all 69 flashcards in this deck.
Unlock Deck
k this deck
57
A correlation coefficient near 0 indicates little if any _______________ correlation.
A)positive
B)negative
C)linear
D)nonlinear
A)positive
B)negative
C)linear
D)nonlinear
Unlock Deck
Unlock for access to all 69 flashcards in this deck.
Unlock Deck
k this deck
58
In a clinical trial, participants are randomly divided into two groups. The group given the drug or treatment to be tested is called the test group while the other group given placebo is called the __________ group.
A)comparison
B)control
C)dummy
D)reference
A)comparison
B)control
C)dummy
D)reference
Unlock Deck
Unlock for access to all 69 flashcards in this deck.
Unlock Deck
k this deck
59
A polling organization conducts a poll by making a random survey of 2500 people. Estimate the margin of error at a confidence interval of 95%.
A)1.5%
B)2.0%
C)2.5%
D)3.0%
A)1.5%
B)2.0%
C)2.5%
D)3.0%
Unlock Deck
Unlock for access to all 69 flashcards in this deck.
Unlock Deck
k this deck
60
For a 95% level of confidence, the sample size needed to get a margin of error of m percentage points can be approximated using:
A)
B)
C)
D)
A)
B)
C)
D)
Unlock Deck
Unlock for access to all 69 flashcards in this deck.
Unlock Deck
k this deck
61
Determine which pair of variables is uncorrelated.
A)The daily average temperature and the sales of cell phones.
B)The daily average temperature and the sales of overcoats.
C)The daily average temperature and the sales of shorts.
D)The daily average temperature and the sales of gloves.
A)The daily average temperature and the sales of cell phones.
B)The daily average temperature and the sales of overcoats.
C)The daily average temperature and the sales of shorts.
D)The daily average temperature and the sales of gloves.
Unlock Deck
Unlock for access to all 69 flashcards in this deck.
Unlock Deck
k this deck
62
Suppose that for a certain illness, the probability is 40% that a given patient will improve without treatment. Then the probability that at least n out of 20 patients will improve without treatment is given in the following table: We gave an experimental drug to 20 patients who have the illness and 11 patients showed improvement. What is the p-value?
A)0.25
B)0.13
C)0.06
D)0.02
We gave an experimental drug to 20 patients who have the illness and 11 patients showed improvement. What is the p-value?A)0.25
B)0.13
C)0.06
D)0.02
Unlock Deck
Unlock for access to all 69 flashcards in this deck.
Unlock Deck
k this deck
63
Suppose that for a certain illness, the probability is 40% that a given patient will improve without treatment. Then the probability that at least n out of 20 patients will improve without treatment is given in the following table: Suppose we count the test significant if the p-value is 0.05 or less. How many patients must show improvement in order to make the test statistically significant?
A)11
B)12
C)13
D)14
Suppose we count the test significant if the p-value is 0.05 or less. How many patients must show improvement in order to make the test statistically significant?A)11
B)12
C)13
D)14
Unlock Deck
Unlock for access to all 69 flashcards in this deck.
Unlock Deck
k this deck
64
Consider the pair of variables: Time you spend running on a track and calories you will burn. These variables are:
A)positively correlated.
B)negatively correlated.
C)uncorrelated.
D)statistically significant.
A)positively correlated.
B)negatively correlated.
C)uncorrelated.
D)statistically significant.
Unlock Deck
Unlock for access to all 69 flashcards in this deck.
Unlock Deck
k this deck
65
Determine which pair of variables is positively correlated.
A)Your grades and the number of hours a week you study.
B)Your grades and the number of hours a week you play video games.
C)Your grades and the number of sandwiches you eat in a week.
D)Your grades and the number of hats you wear in a week.
A)Your grades and the number of hours a week you study.
B)Your grades and the number of hours a week you play video games.
C)Your grades and the number of sandwiches you eat in a week.
D)Your grades and the number of hats you wear in a week.
Unlock Deck
Unlock for access to all 69 flashcards in this deck.
Unlock Deck
k this deck
66
Determine which figure shows the weakest linear relationship.
A)
B)
C)
D)
A)
B)
C)
D)
Unlock Deck
Unlock for access to all 69 flashcards in this deck.
Unlock Deck
k this deck
67
Consider the pair of variables: Intensity of a light bulb and your distance from the light bulb. The variables are:
A)positively correlated.
B)negatively correlated.
C)uncorrelated.
D)statistically significant.
A)positively correlated.
B)negatively correlated.
C)uncorrelated.
D)statistically significant.
Unlock Deck
Unlock for access to all 69 flashcards in this deck.
Unlock Deck
k this deck
68
Consider the pair of variables: The number of touchdowns thrown by Tom Brady and the number of bills in your wallet. These variables are:
A)positively correlated.
B)negatively correlated.
C)uncorrelated.
D)statistically significant.
A)positively correlated.
B)negatively correlated.
C)uncorrelated.
D)statistically significant.
Unlock Deck
Unlock for access to all 69 flashcards in this deck.
Unlock Deck
k this deck
69
Determine which figure shows the strongest linear relationship.
A)
B)
C)
D)
A)
B)
C)
D)
Unlock Deck
Unlock for access to all 69 flashcards in this deck.
Unlock Deck
k this deck
Unlock Deck
Unlock for access to all 69 flashcards in this deck.


