Deck 3: Epidemiology: the Study of Disease, Injury, and Death in the Community
Full screen (f)
Question
Question
Question
Question
Using the data presented in Table 1, estimate (as best you can) the life expectancy of your siblings, parents, and grandparents at birth. If your grandparents are older than 65, determine what their life expectancies were when they turned 65. If you were to fulfi ll your life expectancy exactly, in what year can you expect to die?
TABLE 1 Life Expectancy at Birth, at 65 Years of Age, and at 75 Years of Age According to Sex: In the United States, During the Selected Years 1900-2010
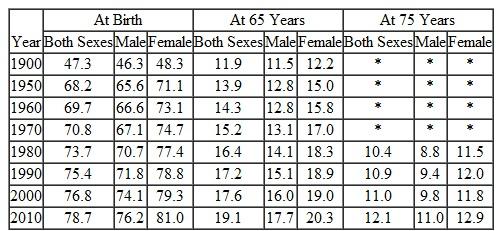 *Data not available.
Data from: National Center for Health Statistics (2013). "Health, United States, 2012, With Special Feature on Emergency Care." (DHHS pub. no. 2013-1232). Hyattsville, MD: Author. Available at http://www.cdc.gov/nchs/data/hus/hus12.pdf.
TABLE 1 Life Expectancy at Birth, at 65 Years of Age, and at 75 Years of Age According to Sex: In the United States, During the Selected Years 1900-2010
*Data not available.Data from: National Center for Health Statistics (2013). "Health, United States, 2012, With Special Feature on Emergency Care." (DHHS pub. no. 2013-1232). Hyattsville, MD: Author. Available at http://www.cdc.gov/nchs/data/hus/hus12.pdf.
Question
Question
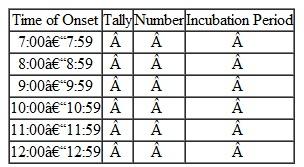
Assume that you were Kim and you were able to reach Dr. Turner, the local health officer. He then asked whether you would like to help in the investigation of the foodborne outbreak mentioned in the scenario. You agreed to help. So far, you have learned that on Sunday, May 28, 49 people were at a picnic where they had eaten, beginning about noon. People began to report their illnesses later that night. Dr. Turner developed a foodborne outbreak investigation worksheet, which you helped to complete by making numerous phone calls and house visits with the public health nurse. The histories of people attending the picnic appear in Table 1. Using Table 2 , the Epidemic Curve Tally Sheet, you tally the cases by hour of onset of illness. Using the results of the tally, you establish the incubation period-the range of hours (after the meal) over which symptoms started. Next, you prepare a graph to illustrate the epidemic curve of the outbreak. Try to answer the following questions:
What is the incubation period?
TABLE 1 Histories Obtained from Persons eating Picnic Lunc h
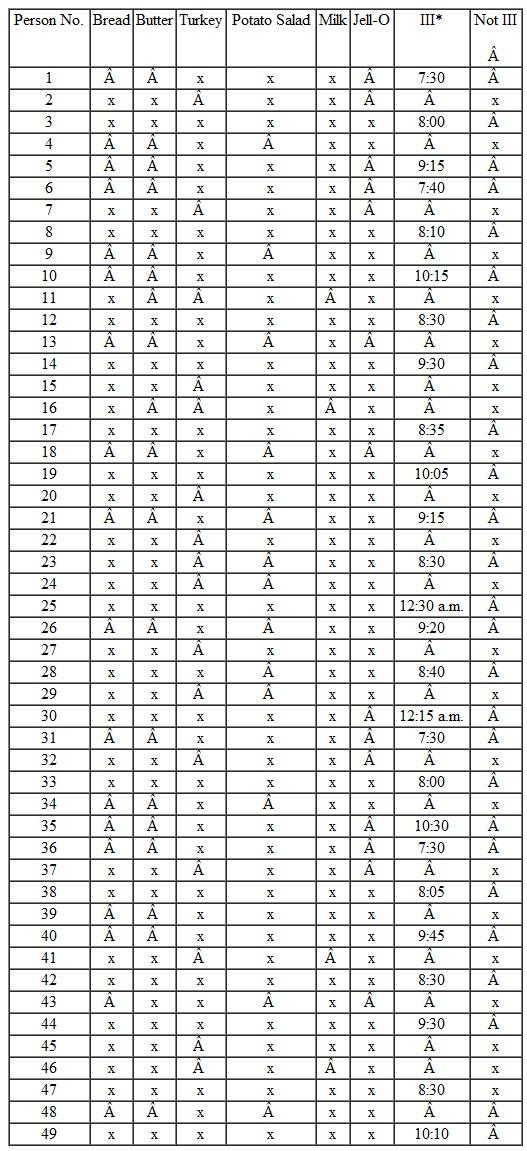 *All time is p.m. unless otherwise indicated.
TABLE 2 Epidemic Curve Tally Sheet

What is the incubation period?
TABLE 1 Histories Obtained from Persons eating Picnic Lunc h
*All time is p.m. unless otherwise indicated.TABLE 2 Epidemic Curve Tally Sheet
Question
Question
Question
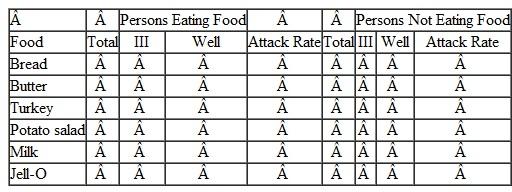
Unfortunately, by the time the investigation began, all the picnic food had been discarded, and no samples were available for laboratory testing. To determine which food at the picnic might have caused the outbreak, you need to calculate attack rates for people eating each food as well as for people not eating each food. Using Table 1 , the Attack Rate Worksheet, calculate the attack rates for those who ate and did not eat each food served.
Which food would you most suspect of causing the illness?
TABLE 1 Attack rate Worksheet

Which food would you most suspect of causing the illness?
TABLE 1 Attack rate Worksheet
Question
Question
Question
Question
Question
Question
Look at the data in Table 1. What conclusion can you draw about the risk for acquiring tuberculosis for populations in each age group? Write down your answer. Now examine Table 2. Which age groups exhibit the highest disease rates? Explain why it is important to calculate rates to report disease outbreaks accurately.
TABLE 1 Reported Tuberculosis Cases, by Age group, Low Socloeconomic Area, City of Dixon, 1960
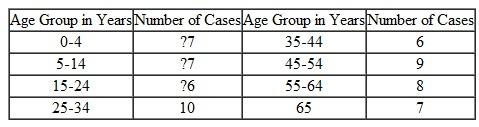 Source: Centers for Disease Control and Prevention.
TABLE 2 Reported Tuberculosis Cases and incidence rates per 100,000, Low Socioeconomic Area, City of Dixon, 1960
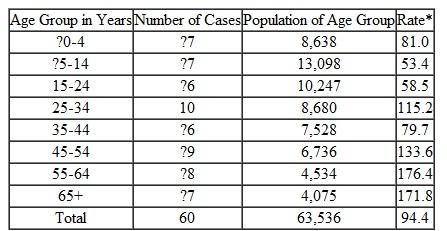 *Example: 7 cases ÷ 8,638 population × 100,000 = 81.0.
Source: Centers for Disease Control and Prevention.
TABLE 1 Reported Tuberculosis Cases, by Age group, Low Socloeconomic Area, City of Dixon, 1960
Source: Centers for Disease Control and Prevention.TABLE 2 Reported Tuberculosis Cases and incidence rates per 100,000, Low Socioeconomic Area, City of Dixon, 1960
*Example: 7 cases ÷ 8,638 population × 100,000 = 81.0.Source: Centers for Disease Control and Prevention.
Question
Question
Question
Assume that you were Kim and you were able to reach Dr. Turner, the local health officer. He then asked whether you would like to help in the investigation of the foodborne outbreak mentioned in the scenario. You agreed to help. So far, you have learned that on Sunday, May 28, 49 people were at a picnic where they had eaten, beginning about noon. People began to report their illnesses later that night. Dr. Turner developed a foodborne outbreak investigation worksheet, which you helped to complete by making numerous phone calls and house visits with the public health nurse. The histories of people attending the picnic appear in Table 1. Using Table 2 , the Epidemic Curve Tally Sheet, you tally the cases by hour of onset of illness. Using the results of the tally, you establish the incubation period-the range of hours (after the meal) over which symptoms started. Next, you prepare a graph to illustrate the epidemic curve of the outbreak. Try to answer the following questions:
Does the curve you prepared suggest a single- ormultiple-exposure epidemic?
TABLE 1 Histories Obtained from Persons eating Picnic Lunch
 *All time is p.m. unless otherwise indicated.
TABLE 2 Epidemic Curve Tally Sheet

Does the curve you prepared suggest a single- ormultiple-exposure epidemic?
TABLE 1 Histories Obtained from Persons eating Picnic Lunch
*All time is p.m. unless otherwise indicated.TABLE 2 Epidemic Curve Tally Sheet
Question
Question
Unfortunately, by the time the investigation began, all the picnic food had been discarded, and no samples were available for laboratory testing. To determine which food at the picnic might have caused the outbreak, you need to calculate attack rates for people eating each food as well as for people not eating each food. Using Table 1 , the Attack Rate Worksheet, calculate the attack rates for those who ate and did not eat each food served.
Based on this information, what might the causative agent have been?
TABLE 1 Attack rate Workshee t

Based on this information, what might the causative agent have been?
TABLE 1 Attack rate Workshee t
Question
Question
Question
Question
Question
Question
Assume that you were Kim and you were able to reach Dr. Turner, the local health officer. He then asked whether you would like to help in the investigation of the foodborne outbreak mentioned in the scenario. You agreed to help. So far, you have learned that on Sunday, May 28, 49 people were at a picnic where they had eaten, beginning about noon. People began to report their illnesses later that night. Dr. Turner developed a foodborne outbreak investigation worksheet, which you helped to complete by making numerous phone calls and house visits with the public health nurse. The histories of people attending the picnic appear in Table 1. Using Table 2 , the Epidemic Curve Tally Sheet, you tally the cases by hour of onset of illness. Using the results of the tally, you establish the incubation period-the range of hours (after the meal) over which symptoms started. Next, you prepare a graph to illustrate the epidemic curve of the outbreak. Try to answer the following questions:
Based solely on the incubation period, can youmake a guess as to the cause of the outbreak?
TABLE 1 Histories Obtained from Persons eating Picnic Lunch
 *All time is p.m. unless otherwise indicated.
TABLE 2 Epidemic Curve Tally Sheet
Based solely on the incubation period, can youmake a guess as to the cause of the outbreak?
TABLE 1 Histories Obtained from Persons eating Picnic Lunch
*All time is p.m. unless otherwise indicated.TABLE 2 Epidemic Curve Tally Sheet
Question
Question
Unfortunately, by the time the investigation began, all the picnic food had been discarded, and no samples were available for laboratory testing. To determine which food at the picnic might have caused the outbreak, you need to calculate attack rates for people eating each food as well as for people not eating each food. Using Table 1 , the Attack Rate Worksheet, calculate the attack rates for those who ate and did not eat each food served.
How could the Internet be of assistance to healthdepartment officials in this situation?
TABLE 1 Attack rate Worksheet
How could the Internet be of assistance to healthdepartment officials in this situation?
TABLE 1 Attack rate Worksheet
Question
Question
Question
Question
Question
Question
Question
Question
Question

Unlock Deck
Sign up to unlock the cards in this deck!
Unlock Deck
Unlock Deck
1/37
Play
Full screen (f)
Deck 3: Epidemiology: the Study of Disease, Injury, and Death in the Community
1
Why are rates important in community health?
Community health stands for the overall well being and health of the total population in the community. It is important for a community to possess information about the deaths, births, incidences etc. that takes place in the community and affects its population.
Rates are important in community health because it is extremely important to notify the number of births that has added in the community, the number of deaths that has decreased the number of people, the attack rate describes the outbreak of any disease affecting the total population etc. These birth rates, death rates, incidence rates, attack rates etc. makes a community aware about the health related issues of its population.
By getting aware about these rates, a community is in a condition to prepare for any such disease or health related issues that might take a broader form in the future. And thus these rates are so important for the community health.
2
What is the National Health Care Survey? Why is it carried out?
The National Health Care Survey reveals about the characteristics of patients discharged from nonfederal and short stay hospitals. This data provides information on infectious diseases, injuries, substance abuse, and a variety of public health issues related to hospitalization.
This survey is carried out to understand and the occurrence of any infectious disease, accidental injuries, substance abuse, and a variety of public health issues related to hospitalization etc. that a hospitalized person has undergone and has to get admitted to a hospital for treatment.
This survey gathers and disseminates information about the health care service providers in the hospitals outpatient department and emergency departments. This data could also be used for estimation of the costs of public health problems.
3
When you hear the word epidemic, what disease comes to your mind first? Ask this question of 10 people you know, allowing them time to think and give you an answer. Try to find people of different ages as you complete your informal poll. List their answers on paper. Are there any answers that surprise you? Does your list include both classic and contemporary epidemic diseases?
Epidemic stands for an unexpected large number of particular populations getting ill and showing symptoms of specific health related behavior at a particular time and at a particular place.
After asking 10 people about their feelings about epidemic and the first disease that comes to their mind after hearing epidemic, the following are the findings of the same:
10 out of 6 people who were of more than 40 years old replied that the first disease that comes to their mind after hearing the word epidemic is HIV/AIDS, West Nile Virus, Mumps, Mumps, HIV/AIDS, and Mumps.
Remaining 4 people who were less than 40 years replied the name of diseases like smallpox, measles, influenza and smallpox.
There were no answers in this information poll that surprised me because the diseases these people named were actually were epidemic at sometime in the country.
My list includes both classic and contemporary diseases like HIV/AIDS, Mumps, Smallpox, measles, etc.
4
Using the data presented in Table 1, estimate (as best you can) the life expectancy of your siblings, parents, and grandparents at birth. If your grandparents are older than 65, determine what their life expectancies were when they turned 65. If you were to fulfi ll your life expectancy exactly, in what year can you expect to die?
TABLE 1 Life Expectancy at Birth, at 65 Years of Age, and at 75 Years of Age According to Sex: In the United States, During the Selected Years 1900-2010
*Data not available.
Data from: National Center for Health Statistics (2013). "Health, United States, 2012, With Special Feature on Emergency Care." (DHHS pub. no. 2013-1232). Hyattsville, MD: Author. Available at http://www.cdc.gov/nchs/data/hus/hus12.pdf.
TABLE 1 Life Expectancy at Birth, at 65 Years of Age, and at 75 Years of Age According to Sex: In the United States, During the Selected Years 1900-2010
*Data not available.Data from: National Center for Health Statistics (2013). "Health, United States, 2012, With Special Feature on Emergency Care." (DHHS pub. no. 2013-1232). Hyattsville, MD: Author. Available at http://www.cdc.gov/nchs/data/hus/hus12.pdf.
Unlock Deck
Unlock for access to all 37 flashcards in this deck.
Unlock Deck
k this deck
5
In a descriptive epidemiological study, what types of information does the epidemiologist gather?
Unlock Deck
Unlock for access to all 37 flashcards in this deck.
Unlock Deck
k this deck
6
Assume that you were Kim and you were able to reach Dr. Turner, the local health officer. He then asked whether you would like to help in the investigation of the foodborne outbreak mentioned in the scenario. You agreed to help. So far, you have learned that on Sunday, May 28, 49 people were at a picnic where they had eaten, beginning about noon. People began to report their illnesses later that night. Dr. Turner developed a foodborne outbreak investigation worksheet, which you helped to complete by making numerous phone calls and house visits with the public health nurse. The histories of people attending the picnic appear in Table 1. Using Table 2 , the Epidemic Curve Tally Sheet, you tally the cases by hour of onset of illness. Using the results of the tally, you establish the incubation period-the range of hours (after the meal) over which symptoms started. Next, you prepare a graph to illustrate the epidemic curve of the outbreak. Try to answer the following questions:
What is the incubation period?
TABLE 1 Histories Obtained from Persons eating Picnic Lunc h
*All time is p.m. unless otherwise indicated.
TABLE 2 Epidemic Curve Tally Sheet
What is the incubation period?
TABLE 1 Histories Obtained from Persons eating Picnic Lunc h
*All time is p.m. unless otherwise indicated.TABLE 2 Epidemic Curve Tally Sheet
Unlock Deck
Unlock for access to all 37 flashcards in this deck.
Unlock Deck
k this deck
7
What is the difference between crude and specific rates?
Unlock Deck
Unlock for access to all 37 flashcards in this deck.
Unlock Deck
k this deck
8
What is the purpose of an analytic study?
Unlock Deck
Unlock for access to all 37 flashcards in this deck.
Unlock Deck
k this deck
9
Unfortunately, by the time the investigation began, all the picnic food had been discarded, and no samples were available for laboratory testing. To determine which food at the picnic might have caused the outbreak, you need to calculate attack rates for people eating each food as well as for people not eating each food. Using Table 1 , the Attack Rate Worksheet, calculate the attack rates for those who ate and did not eat each food served.
Which food would you most suspect of causing the illness?
TABLE 1 Attack rate Worksheet
Which food would you most suspect of causing the illness?
TABLE 1 Attack rate Worksheet
Unlock Deck
Unlock for access to all 37 flashcards in this deck.
Unlock Deck
k this deck
10
Visit your campus library and locate the American Journal of Epidemiology. Examine several recent issues, taking note of the diff erent types of articles as they appear in the table of contents. Select six articles and read the abstracts. On a piece of paper, list the titles of these articles. Were these descriptive, analytic, or experimental studies? After each title that you have listed, put either the letter D (descriptive), A (analytic), or E (experimental) to denote the type of study that you examined.
Unlock Deck
Unlock for access to all 37 flashcards in this deck.
Unlock Deck
k this deck
11
With regard to observational studies, how do case/control studies and cohort studies differ in design and in the kinds of results obtainable?
Unlock Deck
Unlock for access to all 37 flashcards in this deck.
Unlock Deck
k this deck
12
What is an epidemic? A pandemic? Name some diseases that caused epidemics in the past. Name some diseases that are epidemic today.
Unlock Deck
Unlock for access to all 37 flashcards in this deck.
Unlock Deck
k this deck
13
Why are prevalence rates more useful than incidence rates for measuring chronic diseases?
Unlock Deck
Unlock for access to all 37 flashcards in this deck.
Unlock Deck
k this deck
14
How do experimental studies differ from observational studies? What value do they have in epidemiology? To what principles must investigators adhere in order to properly carry out an experimental study?
Unlock Deck
Unlock for access to all 37 flashcards in this deck.
Unlock Deck
k this deck
15
Look at the data in Table 1. What conclusion can you draw about the risk for acquiring tuberculosis for populations in each age group? Write down your answer. Now examine Table 2. Which age groups exhibit the highest disease rates? Explain why it is important to calculate rates to report disease outbreaks accurately.
TABLE 1 Reported Tuberculosis Cases, by Age group, Low Socloeconomic Area, City of Dixon, 1960
Source: Centers for Disease Control and Prevention.
TABLE 2 Reported Tuberculosis Cases and incidence rates per 100,000, Low Socioeconomic Area, City of Dixon, 1960
*Example: 7 cases ÷ 8,638 population × 100,000 = 81.0.
Source: Centers for Disease Control and Prevention.
TABLE 1 Reported Tuberculosis Cases, by Age group, Low Socloeconomic Area, City of Dixon, 1960
Source: Centers for Disease Control and Prevention.TABLE 2 Reported Tuberculosis Cases and incidence rates per 100,000, Low Socioeconomic Area, City of Dixon, 1960
*Example: 7 cases ÷ 8,638 population × 100,000 = 81.0.Source: Centers for Disease Control and Prevention.
Unlock Deck
Unlock for access to all 37 flashcards in this deck.
Unlock Deck
k this deck
16
What is an infant mortality rate? Why is it such an important rate in community health?
Unlock Deck
Unlock for access to all 37 flashcards in this deck.
Unlock Deck
k this deck
17
What are Hill's criteria for judging whether an association between a risk factor and a disease can be considered causal?
Unlock Deck
Unlock for access to all 37 flashcards in this deck.
Unlock Deck
k this deck
18
Assume that you were Kim and you were able to reach Dr. Turner, the local health officer. He then asked whether you would like to help in the investigation of the foodborne outbreak mentioned in the scenario. You agreed to help. So far, you have learned that on Sunday, May 28, 49 people were at a picnic where they had eaten, beginning about noon. People began to report their illnesses later that night. Dr. Turner developed a foodborne outbreak investigation worksheet, which you helped to complete by making numerous phone calls and house visits with the public health nurse. The histories of people attending the picnic appear in Table 1. Using Table 2 , the Epidemic Curve Tally Sheet, you tally the cases by hour of onset of illness. Using the results of the tally, you establish the incubation period-the range of hours (after the meal) over which symptoms started. Next, you prepare a graph to illustrate the epidemic curve of the outbreak. Try to answer the following questions:
Does the curve you prepared suggest a single- ormultiple-exposure epidemic?
TABLE 1 Histories Obtained from Persons eating Picnic Lunch
*All time is p.m. unless otherwise indicated.
TABLE 2 Epidemic Curve Tally Sheet
Does the curve you prepared suggest a single- ormultiple-exposure epidemic?
TABLE 1 Histories Obtained from Persons eating Picnic Lunch
*All time is p.m. unless otherwise indicated.TABLE 2 Epidemic Curve Tally Sheet
Unlock Deck
Unlock for access to all 37 flashcards in this deck.
Unlock Deck
k this deck
19
What are notifiable diseases? Give some examples.
Unlock Deck
Unlock for access to all 37 flashcards in this deck.
Unlock Deck
k this deck
20
Unfortunately, by the time the investigation began, all the picnic food had been discarded, and no samples were available for laboratory testing. To determine which food at the picnic might have caused the outbreak, you need to calculate attack rates for people eating each food as well as for people not eating each food. Using Table 1 , the Attack Rate Worksheet, calculate the attack rates for those who ate and did not eat each food served.
Based on this information, what might the causative agent have been?
TABLE 1 Attack rate Workshee t
Based on this information, what might the causative agent have been?
TABLE 1 Attack rate Workshee t
Unlock Deck
Unlock for access to all 37 flashcards in this deck.
Unlock Deck
k this deck
21
In general, contrast the leading causes of death in the United States in 1900 with those in 2010. Comment on the differences.
Unlock Deck
Unlock for access to all 37 flashcards in this deck.
Unlock Deck
k this deck
22
Why are epidemiologists sometimes interested in epizootics?
Unlock Deck
Unlock for access to all 37 flashcards in this deck.
Unlock Deck
k this deck
23
At what ages is life expectancy calculated? What does it tell us about a population? Which country has the longest life expectancy?
Unlock Deck
Unlock for access to all 37 flashcards in this deck.
Unlock Deck
k this deck
24
There are 346 students at Hillside School. During March and April, 56 pupils were absent with chickenpox. What is the attack rate for chickenpox at Hillside School? The 56 pupils who were absent had 88 brothers and sisters at home. Of the 88 siblings, 19 developed chickenpox. What was the attack rate among these children? Of the 75 total cases of chickenpox, one child died. Calculate the case fatality rate for chickenpox in this epidemic.
Unlock Deck
Unlock for access to all 37 flashcards in this deck.
Unlock Deck
k this deck
25
What are years of potential life lost (YPLL)? How does calculating YPLL change the way we think about the leading causes of death?
Unlock Deck
Unlock for access to all 37 flashcards in this deck.
Unlock Deck
k this deck
26
Assume that you were Kim and you were able to reach Dr. Turner, the local health officer. He then asked whether you would like to help in the investigation of the foodborne outbreak mentioned in the scenario. You agreed to help. So far, you have learned that on Sunday, May 28, 49 people were at a picnic where they had eaten, beginning about noon. People began to report their illnesses later that night. Dr. Turner developed a foodborne outbreak investigation worksheet, which you helped to complete by making numerous phone calls and house visits with the public health nurse. The histories of people attending the picnic appear in Table 1. Using Table 2 , the Epidemic Curve Tally Sheet, you tally the cases by hour of onset of illness. Using the results of the tally, you establish the incubation period-the range of hours (after the meal) over which symptoms started. Next, you prepare a graph to illustrate the epidemic curve of the outbreak. Try to answer the following questions:
Based solely on the incubation period, can youmake a guess as to the cause of the outbreak?
TABLE 1 Histories Obtained from Persons eating Picnic Lunch
*All time is p.m. unless otherwise indicated.
TABLE 2 Epidemic Curve Tally Sheet
Based solely on the incubation period, can youmake a guess as to the cause of the outbreak?
TABLE 1 Histories Obtained from Persons eating Picnic Lunch
*All time is p.m. unless otherwise indicated.TABLE 2 Epidemic Curve Tally Sheet
Unlock Deck
Unlock for access to all 37 flashcards in this deck.
Unlock Deck
k this deck
27
How would you define disability-adjusted life years (DALYs)? How would you define health-adjusted life expectancy (HALE)?
Unlock Deck
Unlock for access to all 37 flashcards in this deck.
Unlock Deck
k this deck
28
Unfortunately, by the time the investigation began, all the picnic food had been discarded, and no samples were available for laboratory testing. To determine which food at the picnic might have caused the outbreak, you need to calculate attack rates for people eating each food as well as for people not eating each food. Using Table 1 , the Attack Rate Worksheet, calculate the attack rates for those who ate and did not eat each food served.
How could the Internet be of assistance to healthdepartment officials in this situation?
TABLE 1 Attack rate Worksheet
How could the Internet be of assistance to healthdepartment officials in this situation?
TABLE 1 Attack rate Worksheet
Unlock Deck
Unlock for access to all 37 flashcards in this deck.
Unlock Deck
k this deck
29
What is the U.S. Census? How often is it conducted? What types of data does it gather?
Unlock Deck
Unlock for access to all 37 flashcards in this deck.
Unlock Deck
k this deck
30
What does the term endemic disease mean? Give examples of such diseases.
Unlock Deck
Unlock for access to all 37 flashcards in this deck.
Unlock Deck
k this deck
31
What types of information can you find in the Statistical Abstract of the United States ?
Unlock Deck
Unlock for access to all 37 flashcards in this deck.
Unlock Deck
k this deck
32
In an epidemic in Sample City (population 100,000-60,000 males and 40,000 females), there were 600 cases (350 males, 250 females) of a severe disease. Th ere were 70 deaths (all males) resulting from this disease and 880 deaths resulting from causes other than the specifi c disease. Calculate the following-crude death rate, cause-specific mortality rate, case fatality rate, cause-specific morbidity rate for females, and case fatality rate for males.
Unlock Deck
Unlock for access to all 37 flashcards in this deck.
Unlock Deck
k this deck
33
What kinds of data would you expect to find in the Centers for Disease Control and Prevention's Morbidity and Mortality Weekly Report ?
Unlock Deck
Unlock for access to all 37 flashcards in this deck.
Unlock Deck
k this deck
34
What is the difference between natality, morbidity, and mortality?
Unlock Deck
Unlock for access to all 37 flashcards in this deck.
Unlock Deck
k this deck
35
List five important national health surveys that are valuable sources of data about the health and health care of our population.
Unlock Deck
Unlock for access to all 37 flashcards in this deck.
Unlock Deck
k this deck
36
Visit, call, or write your state or local health department. Ask for the total number of birth and death certifi cates issued for the latest year for which complete data are available. Assuming no migration into or out of your state or county occurred, what is the natural rate of population increase (number of births minus number of deaths)? Try to obtain an estimate of the total population of the state or county for that same year. Calculate a crude birth rate and a crude death rate (number of births and deaths) per 1,000 population. Many health departments also post statistical reports online. Check to see what reports your local health department has available on their website.
Unlock Deck
Unlock for access to all 37 flashcards in this deck.
Unlock Deck
k this deck
37
What can be said about the reliability of self-reported health data?
Unlock Deck
Unlock for access to all 37 flashcards in this deck.
Unlock Deck
k this deck
Unlock Deck
Unlock for access to all 37 flashcards in this deck.


