Deck 4: Measures of Dispersion
Full screen (f)
Question
Compute the range and standard deviation of the following 10 scores.
(HINT: It will be helpful to organize your computations as in Table 4.3.)
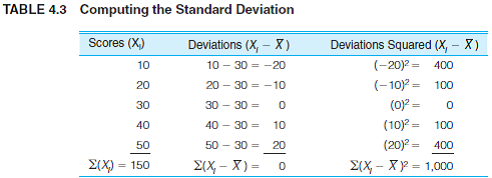
(HINT: It will be helpful to organize your computations as in Table 4.3.)
Question
Question
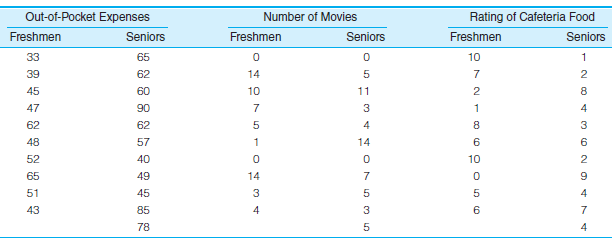
In problem 3.1 at the end of Chapter 3, you calculated measures of central tendency for six variables for freshman and seniors. Three of those variables are reproduced here. Calculate the mean (if necessary), the range, and the standard deviation for each variable. What information is added by the measures of dispersion? Write a paragraph summarizing the differences between freshmen and seniors
Problem 3.1:
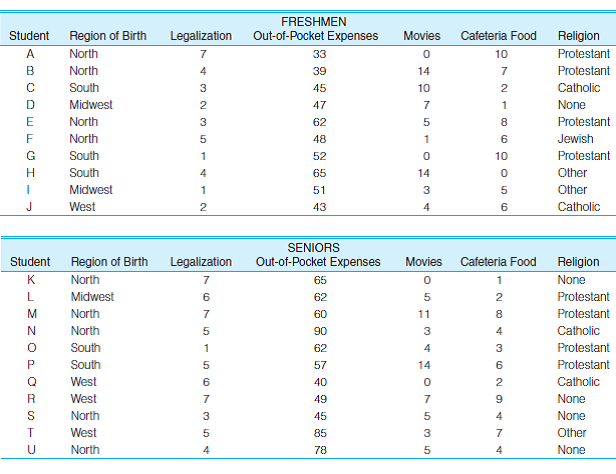
SOC: A variety of information has been gathered from a sample of college freshmen and seniors, including their region of birth, the extent to which they support legalization of marijuana (measured on a scale on which 7 = strong support, 4 = neutral, and 1 = strong opposition), the amount of money they spend each week out of pocket for food, drinks, and entertainment, how many movies they watched in their dorm rooms last week, their opinion of cafeteria food (10 = excellent, 0 = very bad), and their religious affiliation. Some results are presented here. Find the most appropriate measure of central tendency for each variable for freshmen and then for seniors. Report the measure you selected as well as its value for each variable (e.g., "Mode = 3" or "Median = 3.5"). (HINT: Determine the level of measurement for each variable first. In general, this will tell you which measure of central tendency is appropriate. See Tables 3.9 and 3.10 to review the relationship between measure of central tendency and level of measurement. Also, remember that the mode is the most common score and especially remember to array scores from high to low before finding the median.)
Problem 3.1:
SOC: A variety of information has been gathered from a sample of college freshmen and seniors, including their region of birth, the extent to which they support legalization of marijuana (measured on a scale on which 7 = strong support, 4 = neutral, and 1 = strong opposition), the amount of money they spend each week out of pocket for food, drinks, and entertainment, how many movies they watched in their dorm rooms last week, their opinion of cafeteria food (10 = excellent, 0 = very bad), and their religious affiliation. Some results are presented here. Find the most appropriate measure of central tendency for each variable for freshmen and then for seniors. Report the measure you selected as well as its value for each variable (e.g., "Mode = 3" or "Median = 3.5"). (HINT: Determine the level of measurement for each variable first. In general, this will tell you which measure of central tendency is appropriate. See Tables 3.9 and 3.10 to review the relationship between measure of central tendency and level of measurement. Also, remember that the mode is the most common score and especially remember to array scores from high to low before finding the median.)
Question
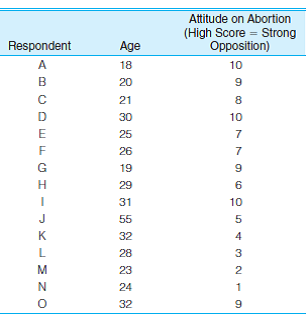
SOC: In problem 3.5 at the end of Chapter 3, you calculated measures of central tendency for four variables for 15 respondents. Two of those variables are reproduced here. Calculate the mean (if necessary), the range, and the standard deviation for each variable. What information is added by the measures of dispersion?
Problem 3.5:
SOC: For 15 respondents, data have been gathered on four variables (see the following table). Find and report the appropriate measure of central tendency for each variable.
Problem 3.5:
SOC: For 15 respondents, data have been gathered on four variables (see the following table). Find and report the appropriate measure of central tendency for each variable.
Question
SOC: In problem 3.8, you computed mean and median income for 13 Canadian provinces and territories in two separate years. Now compute the standard deviation and range for each year, and taking account of the two measures of central tendency and the two measures of dispersion, write a paragraph summarizing the distributions. What do the measures of dispersion add to what you already knew about central tendency? Did the provinces become more or less variable over the period? The scores are reproduced here.
Problem 3.8:
SOC The following table lists the median family incomes for 13 Canadian provinces and territories in 2000 and 2006. Compute the mean and median for each year and then compare the two measures of central tendency. Which measure of central tendency is greater for each year? Are the distributions skewed? In which direction?
Question
SOC Data on several variables measuring overall heath and well-being for five nations are reported here for 2005, with projections to 2020. Are nations becoming more or less diverse on these variables? Calculate the mean, range, and standard deviation for each year for each variable. Summarize the results in a paragraph.
Question
SOC: Labor force participation rates (percent employed), percent high school graduates, and mean income for males and females in 10 states are reported here. Calculate a mean and a standard deviation for both groups for each variable and then describe the differences. Are males and females unequal on any of these variables? How great is the gender inequality?
Question
SW: Compute the standard deviation for the pretest and posttest scores that were used in problem 3.12. The scores are reproduced here. Taking into account all of the information you have on these variables, write a paragraph describing how the sample changed from test to test. What does the standard deviation add to the information you already had?
Question
SOC: In problem 3.11, you computed measures of central tendency for the price of a liter of regular gas for 20 nations. The scores are reproduced here. Compute the standard deviation for this variable and then write a paragraph summarizing the mean, median, and standard deviation.
Problem 3.11:
SOC: The following table lists the price of a liter of regular gas for 20 nations. Compute the mean and median for these data. NOTE: The costs are listed in order. This will make the median easy to find. Which statistic is greater in value? Is there a positive skew in the data? How do you know?
Question
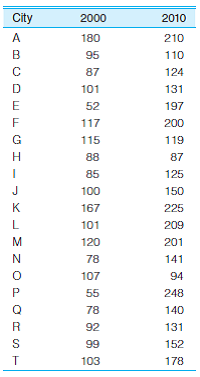
CJ/SW: Per capita expenditures for police protection for 20 cities are reported here for 2000 and 2010. Compute a mean and standard deviation for each year and then describe the differences in expenditures for the five-year period.
Question
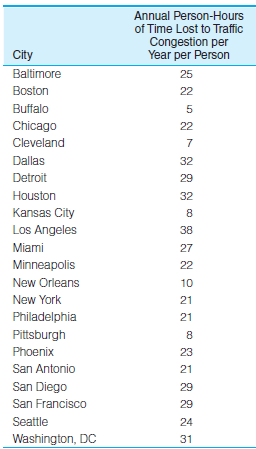
SOC Compute the range and standard deviation for the data presented in problem 3.14. The data are reproduced here. What would happen to the value of the standard deviation if you removed Los Angeles from this distribution and recalculated? Why?
Question
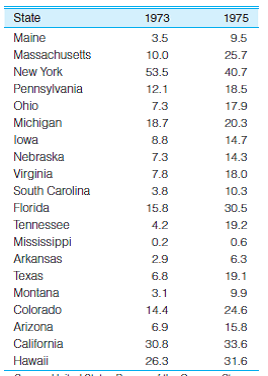
SOC: Listed here are the rates of abortion per 100,000 women for 20 states in 1973 and 1975. Describe what happened to these distributions over the two-year period. Did the average rate increase or decrease? What happened to the dispersion of this distribution? What happened between 1973 and 1975 that might explain these changes in central tendency and dispersion? (Hint: It was a Supreme Court decision.)
Question
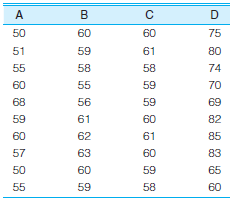
SW: One of your goals as the new chief administrator of a large social service bureau is to equalize workloads within the various divisions of the agency. You have gathered data on caseloads per worker within each division. Which division comes closest to the ideal of an equalized workload? Which is farthest away?
Question
SOC: Compute the standard deviation for both sets of data presented in problem 3.13 and reproduced here. Compare the standard deviation computed for freshmen with the standard deviation computed for seniors. What happened? Why? Does this change relate at all to what happened to the mean over the four-year period? How? What happened to the shapes of the underlying distributions?
Question
SOC/CJ: Calculate the range and standard deviation for the homicide rates presented in problem 3.15 and reproduced here. Using all the information you have on central tendency and dispersion, write a paragraph describing the changes in this variable between 1994 and 2009.
Question
At St. Algebra College, the math department ran some special sections of the freshman math course by using a variety of innovative teaching techniques. Students were randomly assigned to either the traditional sections or the experimental sections, and all students were given the same final exam. The results of the final are summarized here. What was the effect of the experimental course?
Question
You are the governor of the state and must decide which of four metropolitan police departments will win the annual award for efficiency. The performance of each department is summarized in monthly arrest statistics, as reported here. Which department will win the award? Why?

Unlock Deck
Sign up to unlock the cards in this deck!
Unlock Deck
Unlock Deck
1/17
Play
Full screen (f)
Deck 4: Measures of Dispersion
1
Compute the range and standard deviation of the following 10 scores.
(HINT: It will be helpful to organize your computations as in Table 4.3.)
(HINT: It will be helpful to organize your computations as in Table 4.3.)
The scores of 10 students are available as follows:
10, 12, 15, 20, 25, 30, 32, 35, 40, 50
Find the range and the standard deviation of the above scores.
The range is defined as the difference between highest and lowest values of the available data. That is,
Range = Highest value - Lowest value.
In the available data, the highest value is 50
The lowest value is 10.
Therefore, Range = 50 - 10
= 40
Hence, the range of the scores is 40
The standard deviation is defined as the square root of sum of squares of deviations from the arithmetic mean divided by the number of observations.
That is, Here
Here  is the average of the scores and N is the number of observations.
Compute the standard deviation using the following table.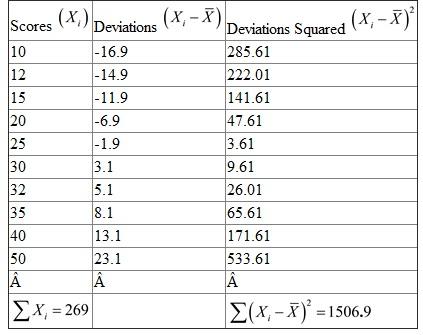 From the table, there are 10 observations,
  ,
,  ,
,  The mean,
  The standard deviation,
  Hence, the standard deviation of the scores is 12.28
10, 12, 15, 20, 25, 30, 32, 35, 40, 50
Find the range and the standard deviation of the above scores.
The range is defined as the difference between highest and lowest values of the available data. That is,
Range = Highest value - Lowest value.
In the available data, the highest value is 50
The lowest value is 10.
Therefore, Range = 50 - 10
= 40
Hence, the range of the scores is 40
The standard deviation is defined as the square root of sum of squares of deviations from the arithmetic mean divided by the number of observations.
That is,
Here is the average of the scores and N is the number of observations.Compute the standard deviation using the following table.
From the table, there are 10 observations, , , The mean, The standard deviation, Hence, the standard deviation of the scores is 12.28 2
Compute the range and standard deviation of the following 10 test scores.
77, 83, 69, 72, 85, 90, 95, 75, 55, 45
77, 83, 69, 72, 85, 90, 95, 75, 55, 45
The scores of 10 students are available as follows:
77, 83, 69, 72, 85, 90, 95, 75, 55, 45
Find the range and the standard deviation of the above scores.
The range is defined as the difference between highest and lowest values of the available data. That is,
Range = Highest value - Lowest value.
In the available data, the highest value is 95
The lowest value is 45.
Therefore, Range = 95 - 45
= 50
Hence, the range of the scores is 50
The standard deviation is defined as the square root of sum of squares of deviations from the arithmetic mean divided by the number of observations.
That is, Here
Here  is the average of the scores and N is the number of observations.
Compute the standard deviation using the following table.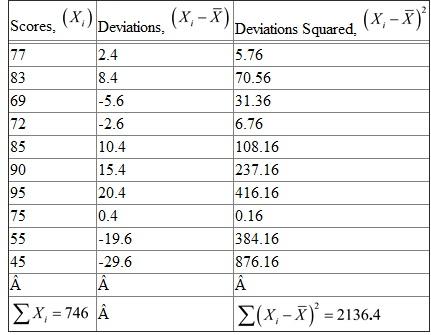 From the table, there are 10 observations,
  ,
,  ,
,  The mean,
  The standard deviation,
  Hence, the standard deviation of the scores is 14.62
77, 83, 69, 72, 85, 90, 95, 75, 55, 45
Find the range and the standard deviation of the above scores.
The range is defined as the difference between highest and lowest values of the available data. That is,
Range = Highest value - Lowest value.
In the available data, the highest value is 95
The lowest value is 45.
Therefore, Range = 95 - 45
= 50
Hence, the range of the scores is 50
The standard deviation is defined as the square root of sum of squares of deviations from the arithmetic mean divided by the number of observations.
That is,
Here is the average of the scores and N is the number of observations.Compute the standard deviation using the following table.
From the table, there are 10 observations, , , The mean, The standard deviation, Hence, the standard deviation of the scores is 14.62 3
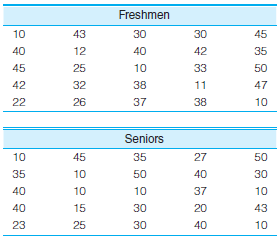
In problem 3.1 at the end of Chapter 3, you calculated measures of central tendency for six variables for freshman and seniors. Three of those variables are reproduced here. Calculate the mean (if necessary), the range, and the standard deviation for each variable. What information is added by the measures of dispersion? Write a paragraph summarizing the differences between freshmen and seniors
Problem 3.1:
SOC: A variety of information has been gathered from a sample of college freshmen and seniors, including their region of birth, the extent to which they support legalization of marijuana (measured on a scale on which 7 = strong support, 4 = neutral, and 1 = strong opposition), the amount of money they spend each week out of pocket for food, drinks, and entertainment, how many movies they watched in their dorm rooms last week, their opinion of cafeteria food (10 = excellent, 0 = very bad), and their religious affiliation. Some results are presented here. Find the most appropriate measure of central tendency for each variable for freshmen and then for seniors. Report the measure you selected as well as its value for each variable (e.g., "Mode = 3" or "Median = 3.5"). (HINT: Determine the level of measurement for each variable first. In general, this will tell you which measure of central tendency is appropriate. See Tables 3.9 and 3.10 to review the relationship between measure of central tendency and level of measurement. Also, remember that the mode is the most common score and especially remember to array scores from high to low before finding the median.)
Information on different characteristics like region of birth, out-of-pocket expenses, number of movies and rating given to cafeteria food is collected from a sample of seniors and freshmen. The results on three characters, out-of-pocket expenses, number of movies and rating given to cafeteria food are tabulated as follows: 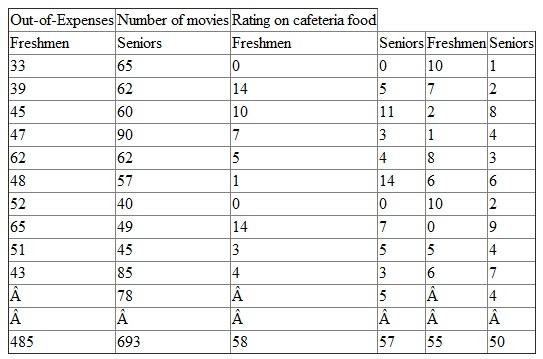 Calculate the mean, range and the standard deviation for each of the variables.
The mean of the observations is defined by Here N is the number of observations.
The range is defined as the difference between highest and lowest values of the available data. That is,
Range = Highest value - Lowest value.
The standard deviation is defined as the square root of sum of squares of deviations from the arithmetic mean divided by the number of observations.
That is, Median of the observations is defined by the middle observation in the ordered list (if the number of observations is odd).
Consider the variable Out-of-Expenses :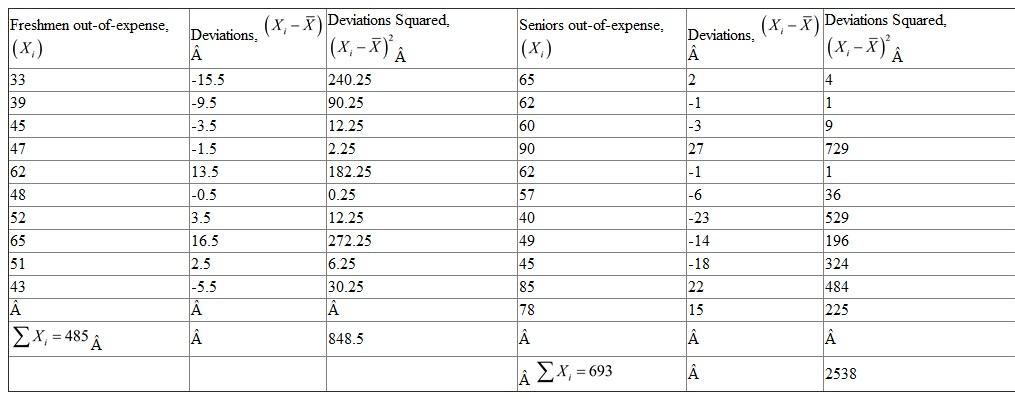 From the given table, there are 10 freshmen,
  The sum of all out-of-expenses of Freshmen,
  The mean out-of-expenses for freshmen,
  The mean out-of-expenses for freshmen is 48.5.
From the given table, there are 11 seniors, The sum of all ages,
  The mean out-of-expenses for seniors,
  The mean out-of-expenses for seniors is 63.
The highest value in out-of expenses for freshmen is 65
The lowest value is 33
Therefore, Range = 65 - 33
= 32
Hence, the range for the Freshmen's out-of-expenses is 32
The highest value in senior's out-of-expenses is 90
The lowest value is 40
Therefore, Range = 90 - 40
= 50
Hence, the range for the Senior's out-of-expenses is 50
Compute the standard deviation using the following table.
From the table, for 10 observations of freshmen, ,
,  ,
,  The standard deviation,
  Hence, the standard deviation for the Freshmen out-of-expenses is 9.211
From the table, there are 11 seniors ,
,  ,
,  The standard deviation,
  Hence, the standard deviation for the Seniors out-of-expenses is 15.1897
Compare the mean expenses of freshmen with that of seniors. The expenses of seniors is high with high standard deviation. In other words, though the mean expense of freshmen is low, the values are consistent. But the expenses of seniors is more variant.
Consider the variable Number of Movies.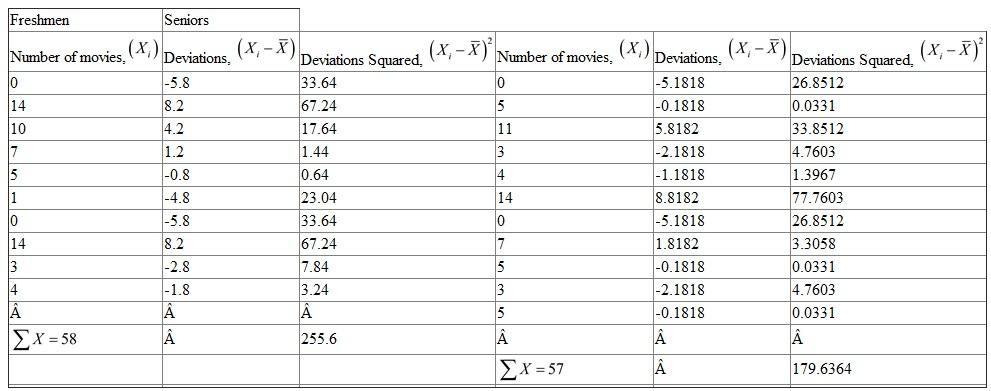 From the given table, there are 10 freshmen,
  The sum of all out-of-expenses of Freshmen,
  The mean number of movies watched by freshmen,
  The mean number of movies watched by freshmen is 5.8,
From the given table, there are 11 seniors, The sum of all ages,
  The mean number of movies watched by seniors,
  The mean number of movies watched by seniors is 5.1818
The highest value number of movies watched by freshmen is 14
The lowest value is 0
Therefore, Range = 14 - 0
= 14
Hence, the range for the number of movies watched by Freshmen is 14
The highest value number of movies watched by Seniors is 14
The lowest value is 0
Therefore, Range = 14 - 0
= 14
Hence, the range for the number of movies watched by seniors is 14
From the table, for 10 observations of freshmen, ,
,  ,
,  The standard deviation,
  Hence, the standard deviation for the number of movies watched by Freshmen is 5.056
From the table, there are 11 seniors ,
,  ,
,  The standard deviation,
  Hence, the standard deviation for the number of movies watched by Seniors is 4.0411
Compare the number of movies watched by freshmen with that of seniors. As per the results, freshmen are watching approximately same number of movies as that of seniors. But the data of number of movies watched by seniors is more consistent compared to freshmen.
Consider the variable Rating given by students on Cafeteria food.
From the given table, there are 10 Freshmen Since these scores are ordinal based, the central tendency can be identified by the median. The suitable measure of dispersion would be the Interquartile range.
First arrange the scores in increasing order.
0, 1, 2, 5, 6, 6 , 7, 8, 10, 10
As there are 10 observations, the average of 5 th and 6 th observations would be the median of the given data. In the available data, 6 and 6 are the 5 th and 6 th observations.
Then, Median
 Hence, median score is 6.
Consider Similarly,
  Therefore, 3 rd observation is the first quartile and 8 th observation is the third quartile.
In the ordered set of scores, 2 is the first quartile and 8 is the third quartile.
Hence, the interquartile range is defined as the difference between third and first quartile.
That is, Hence, the measure of dispersion for scores given by Freshmen is 6.
From the given table, there are 11 Seniors, Since these scores are ordinal based, the central tendency can be identified by the median. The suitable measure of dispersion would be the Interquartile range.
First arrange the scores in increasing order.
1, 2, 2 , 3, 4, 4 , 4, 6 , 7, 8, 9
As there are 11 observations, the 6 th observations would be the median of the given data. In the available data, 4 is the 6 th observations.
Then, Median Hence, median score given by Seniors is 4.
Consider Similarly,
  Therefore, 3 rd observation is the first quartile and 8 th observation is the third quartile.
In the ordered set of scores, 2 is the first quartile and 6 is the third quartile.
Hence, the interquartile range is defined as the difference between third and first quartile.
That is, Hence, the measure of dispersion for scores given by Seniors is 4.
Calculate the mean, range and the standard deviation for each of the variables.The mean of the observations is defined by
Here N is the number of observations.The range is defined as the difference between highest and lowest values of the available data. That is,
Range = Highest value - Lowest value.
The standard deviation is defined as the square root of sum of squares of deviations from the arithmetic mean divided by the number of observations.
That is,
Median of the observations is defined by the middle observation in the ordered list (if the number of observations is odd).Consider the variable Out-of-Expenses :
From the given table, there are 10 freshmen, The sum of all out-of-expenses of Freshmen, The mean out-of-expenses for freshmen, The mean out-of-expenses for freshmen is 48.5.From the given table, there are 11 seniors,
The sum of all ages, The mean out-of-expenses for seniors, The mean out-of-expenses for seniors is 63.The highest value in out-of expenses for freshmen is 65
The lowest value is 33
Therefore, Range = 65 - 33
= 32
Hence, the range for the Freshmen's out-of-expenses is 32
The highest value in senior's out-of-expenses is 90
The lowest value is 40
Therefore, Range = 90 - 40
= 50
Hence, the range for the Senior's out-of-expenses is 50
Compute the standard deviation using the following table.
From the table, for 10 observations of freshmen,
, , The standard deviation, Hence, the standard deviation for the Freshmen out-of-expenses is 9.211 From the table, there are 11 seniors
, , The standard deviation, Hence, the standard deviation for the Seniors out-of-expenses is 15.1897 Compare the mean expenses of freshmen with that of seniors. The expenses of seniors is high with high standard deviation. In other words, though the mean expense of freshmen is low, the values are consistent. But the expenses of seniors is more variant.
Consider the variable Number of Movies.
From the given table, there are 10 freshmen, The sum of all out-of-expenses of Freshmen, The mean number of movies watched by freshmen, The mean number of movies watched by freshmen is 5.8, From the given table, there are 11 seniors,
The sum of all ages, The mean number of movies watched by seniors, The mean number of movies watched by seniors is 5.1818The highest value number of movies watched by freshmen is 14
The lowest value is 0
Therefore, Range = 14 - 0
= 14
Hence, the range for the number of movies watched by Freshmen is 14
The highest value number of movies watched by Seniors is 14
The lowest value is 0
Therefore, Range = 14 - 0
= 14
Hence, the range for the number of movies watched by seniors is 14
From the table, for 10 observations of freshmen,
, , The standard deviation, Hence, the standard deviation for the number of movies watched by Freshmen is 5.056 From the table, there are 11 seniors
, , The standard deviation, Hence, the standard deviation for the number of movies watched by Seniors is 4.0411 Compare the number of movies watched by freshmen with that of seniors. As per the results, freshmen are watching approximately same number of movies as that of seniors. But the data of number of movies watched by seniors is more consistent compared to freshmen.
Consider the variable Rating given by students on Cafeteria food.
From the given table, there are 10 Freshmen
Since these scores are ordinal based, the central tendency can be identified by the median. The suitable measure of dispersion would be the Interquartile range.First arrange the scores in increasing order.
0, 1, 2, 5, 6, 6 , 7, 8, 10, 10
As there are 10 observations, the average of 5 th and 6 th observations would be the median of the given data. In the available data, 6 and 6 are the 5 th and 6 th observations.
Then, Median
Hence, median score is 6.Consider
Similarly, Therefore, 3 rd observation is the first quartile and 8 th observation is the third quartile.In the ordered set of scores, 2 is the first quartile and 8 is the third quartile.
Hence, the interquartile range is defined as the difference between third and first quartile.
That is,
Hence, the measure of dispersion for scores given by Freshmen is 6.From the given table, there are 11 Seniors,
Since these scores are ordinal based, the central tendency can be identified by the median. The suitable measure of dispersion would be the Interquartile range.First arrange the scores in increasing order.
1, 2, 2 , 3, 4, 4 , 4, 6 , 7, 8, 9
As there are 11 observations, the 6 th observations would be the median of the given data. In the available data, 4 is the 6 th observations.
Then, Median
Hence, median score given by Seniors is 4.Consider
Similarly, Therefore, 3 rd observation is the first quartile and 8 th observation is the third quartile.In the ordered set of scores, 2 is the first quartile and 6 is the third quartile.
Hence, the interquartile range is defined as the difference between third and first quartile.
That is,
Hence, the measure of dispersion for scores given by Seniors is 4. 4
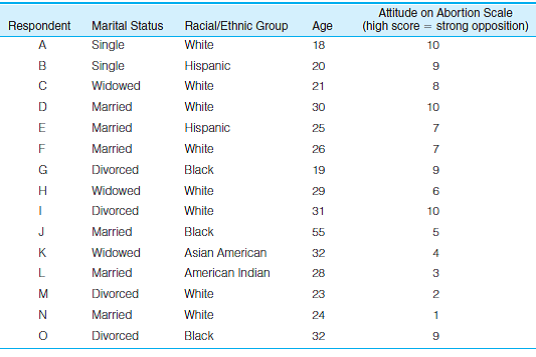
SOC: In problem 3.5 at the end of Chapter 3, you calculated measures of central tendency for four variables for 15 respondents. Two of those variables are reproduced here. Calculate the mean (if necessary), the range, and the standard deviation for each variable. What information is added by the measures of dispersion?
Problem 3.5:
SOC: For 15 respondents, data have been gathered on four variables (see the following table). Find and report the appropriate measure of central tendency for each variable.
Problem 3.5:
SOC: For 15 respondents, data have been gathered on four variables (see the following table). Find and report the appropriate measure of central tendency for each variable.
Unlock Deck
Unlock for access to all 17 flashcards in this deck.
Unlock Deck
k this deck
5
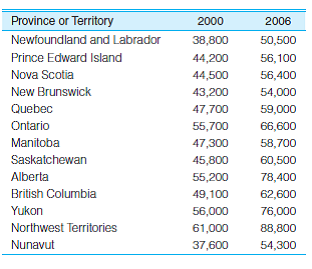
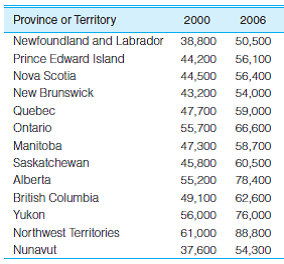
SOC: In problem 3.8, you computed mean and median income for 13 Canadian provinces and territories in two separate years. Now compute the standard deviation and range for each year, and taking account of the two measures of central tendency and the two measures of dispersion, write a paragraph summarizing the distributions. What do the measures of dispersion add to what you already knew about central tendency? Did the provinces become more or less variable over the period? The scores are reproduced here.
Problem 3.8:
SOC The following table lists the median family incomes for 13 Canadian provinces and territories in 2000 and 2006. Compute the mean and median for each year and then compare the two measures of central tendency. Which measure of central tendency is greater for each year? Are the distributions skewed? In which direction?
Problem 3.8:
SOC The following table lists the median family incomes for 13 Canadian provinces and territories in 2000 and 2006. Compute the mean and median for each year and then compare the two measures of central tendency. Which measure of central tendency is greater for each year? Are the distributions skewed? In which direction?
Unlock Deck
Unlock for access to all 17 flashcards in this deck.
Unlock Deck
k this deck
6
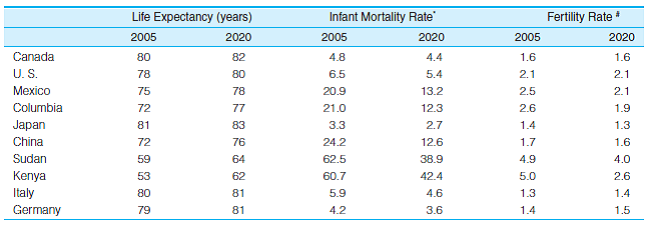
SOC Data on several variables measuring overall heath and well-being for five nations are reported here for 2005, with projections to 2020. Are nations becoming more or less diverse on these variables? Calculate the mean, range, and standard deviation for each year for each variable. Summarize the results in a paragraph.
Unlock Deck
Unlock for access to all 17 flashcards in this deck.
Unlock Deck
k this deck
7
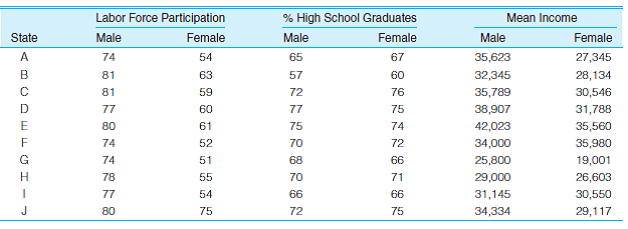
SOC: Labor force participation rates (percent employed), percent high school graduates, and mean income for males and females in 10 states are reported here. Calculate a mean and a standard deviation for both groups for each variable and then describe the differences. Are males and females unequal on any of these variables? How great is the gender inequality?
Unlock Deck
Unlock for access to all 17 flashcards in this deck.
Unlock Deck
k this deck
8
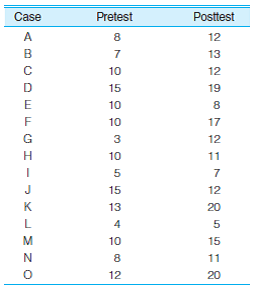
SW: Compute the standard deviation for the pretest and posttest scores that were used in problem 3.12. The scores are reproduced here. Taking into account all of the information you have on these variables, write a paragraph describing how the sample changed from test to test. What does the standard deviation add to the information you already had?
Unlock Deck
Unlock for access to all 17 flashcards in this deck.
Unlock Deck
k this deck
9
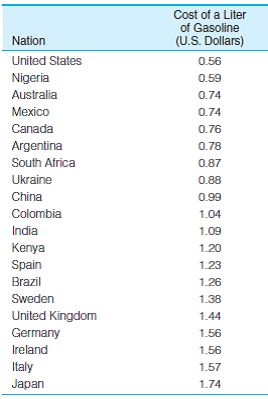
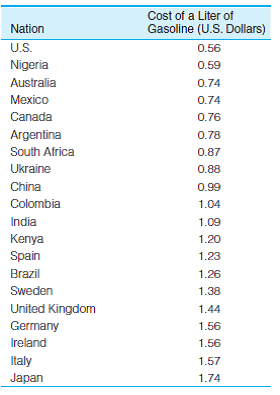
SOC: In problem 3.11, you computed measures of central tendency for the price of a liter of regular gas for 20 nations. The scores are reproduced here. Compute the standard deviation for this variable and then write a paragraph summarizing the mean, median, and standard deviation.
Problem 3.11:
SOC: The following table lists the price of a liter of regular gas for 20 nations. Compute the mean and median for these data. NOTE: The costs are listed in order. This will make the median easy to find. Which statistic is greater in value? Is there a positive skew in the data? How do you know?
Problem 3.11:
SOC: The following table lists the price of a liter of regular gas for 20 nations. Compute the mean and median for these data. NOTE: The costs are listed in order. This will make the median easy to find. Which statistic is greater in value? Is there a positive skew in the data? How do you know?
Unlock Deck
Unlock for access to all 17 flashcards in this deck.
Unlock Deck
k this deck
10
CJ/SW: Per capita expenditures for police protection for 20 cities are reported here for 2000 and 2010. Compute a mean and standard deviation for each year and then describe the differences in expenditures for the five-year period.
Unlock Deck
Unlock for access to all 17 flashcards in this deck.
Unlock Deck
k this deck
11
SOC Compute the range and standard deviation for the data presented in problem 3.14. The data are reproduced here. What would happen to the value of the standard deviation if you removed Los Angeles from this distribution and recalculated? Why?
Unlock Deck
Unlock for access to all 17 flashcards in this deck.
Unlock Deck
k this deck
12
SOC: Listed here are the rates of abortion per 100,000 women for 20 states in 1973 and 1975. Describe what happened to these distributions over the two-year period. Did the average rate increase or decrease? What happened to the dispersion of this distribution? What happened between 1973 and 1975 that might explain these changes in central tendency and dispersion? (Hint: It was a Supreme Court decision.)
Unlock Deck
Unlock for access to all 17 flashcards in this deck.
Unlock Deck
k this deck
13
SW: One of your goals as the new chief administrator of a large social service bureau is to equalize workloads within the various divisions of the agency. You have gathered data on caseloads per worker within each division. Which division comes closest to the ideal of an equalized workload? Which is farthest away?
Unlock Deck
Unlock for access to all 17 flashcards in this deck.
Unlock Deck
k this deck
14
SOC: Compute the standard deviation for both sets of data presented in problem 3.13 and reproduced here. Compare the standard deviation computed for freshmen with the standard deviation computed for seniors. What happened? Why? Does this change relate at all to what happened to the mean over the four-year period? How? What happened to the shapes of the underlying distributions?
Unlock Deck
Unlock for access to all 17 flashcards in this deck.
Unlock Deck
k this deck
15
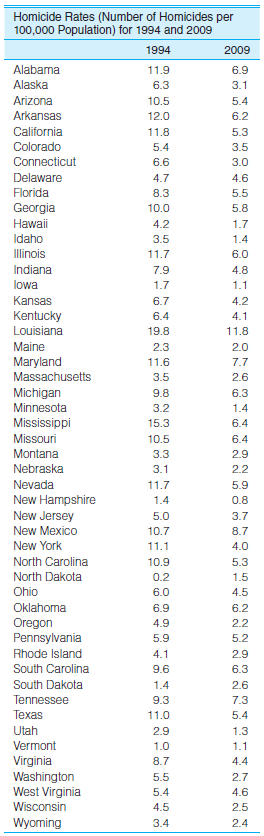
SOC/CJ: Calculate the range and standard deviation for the homicide rates presented in problem 3.15 and reproduced here. Using all the information you have on central tendency and dispersion, write a paragraph describing the changes in this variable between 1994 and 2009.
Unlock Deck
Unlock for access to all 17 flashcards in this deck.
Unlock Deck
k this deck
16
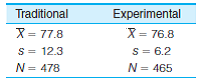
At St. Algebra College, the math department ran some special sections of the freshman math course by using a variety of innovative teaching techniques. Students were randomly assigned to either the traditional sections or the experimental sections, and all students were given the same final exam. The results of the final are summarized here. What was the effect of the experimental course?
Unlock Deck
Unlock for access to all 17 flashcards in this deck.
Unlock Deck
k this deck
17
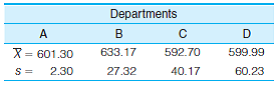
You are the governor of the state and must decide which of four metropolitan police departments will win the annual award for efficiency. The performance of each department is summarized in monthly arrest statistics, as reported here. Which department will win the award? Why?
Unlock Deck
Unlock for access to all 17 flashcards in this deck.
Unlock Deck
k this deck
Unlock Deck
Unlock for access to all 17 flashcards in this deck.


