Deck 24: Economic Policy in the Open Economy Under Fixed Exchange Rates
Full screen (f)
Question
Question
Question
Question
Question
Question
Question
Question
In Figure, suppose that the economy is located to the left of the IS curve and also to the left of the LM curve. Is ( S + M + T) greater or less than ( I + X + G) ? Is there an excess demand or excess supply of money? What will happen to income and why?
FIGURE Simultaneous Equilibrium in the Real and Monetary Sectors
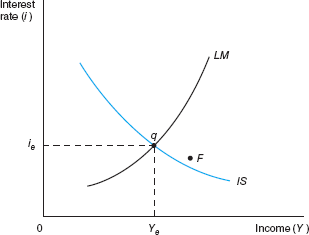
Only at point q is there equilibrium in both the real and monetary sectors of the economy. If the economy is situated away from q at point F , saving plus imports plus taxes exceeds investment plus exports plus government spending; in addition, there is an excess demand for money. Movement occurs (by any of a number of different paths) to point q. Any other point away from point q also sets forces in motion to move the economy to point q.
FIGURE Simultaneous Equilibrium in the Real and Monetary Sectors
Only at point q is there equilibrium in both the real and monetary sectors of the economy. If the economy is situated away from q at point F , saving plus imports plus taxes exceeds investment plus exports plus government spending; in addition, there is an excess demand for money. Movement occurs (by any of a number of different paths) to point q. Any other point away from point q also sets forces in motion to move the economy to point q.
Question
Question
If the economy is operating at c in Figure, what policy actions should be carried out to reach the internal balance target? Why?
FIGURE Internal Balance, External Balance, and Policy Instrument Classification
in a Mundell-Fleming Diagram
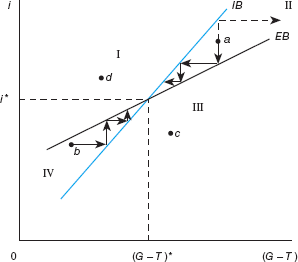
The IB curve reflects all combinations of interest rates i (monetary policy) and net government spending ( G ? T) that lead to the attainment of domestic targets, that is, internal balance. Similarly, the flatter EB curve reflects all combinations of i and ( G ? T) that generate equilibrium in the balance of payments for a given exchange rate. Points above the IB curve reflect unacceptably high unemployment, and points below reflect unacceptably rapid inflation. Similarly, points above the EB curve represent a surplus in the balance of payments, and points below represent a deficit. It is clear that internal balance and external balance are obtained simultaneously only at i * and ( G ? T) *. Finally, if the economy is not at i * and ( G ? T) *, monetary policy should be pursued to reach external balance and fiscal policy to reach internal balance.
FIGURE Internal Balance, External Balance, and Policy Instrument Classification
in a Mundell-Fleming Diagram
The IB curve reflects all combinations of interest rates i (monetary policy) and net government spending ( G ? T) that lead to the attainment of domestic targets, that is, internal balance. Similarly, the flatter EB curve reflects all combinations of i and ( G ? T) that generate equilibrium in the balance of payments for a given exchange rate. Points above the IB curve reflect unacceptably high unemployment, and points below reflect unacceptably rapid inflation. Similarly, points above the EB curve represent a surplus in the balance of payments, and points below represent a deficit. It is clear that internal balance and external balance are obtained simultaneously only at i * and ( G ? T) *. Finally, if the economy is not at i * and ( G ? T) *, monetary policy should be pursued to reach external balance and fiscal policy to reach internal balance.
Question
Question
Question
Question
Question
Question
Question
Question
Question
Question
Question
Question
Question

Unlock Deck
Sign up to unlock the cards in this deck!
Unlock Deck
Unlock Deck
1/23
Play
Full screen (f)
Deck 24: Economic Policy in the Open Economy Under Fixed Exchange Rates
1
What will be the situation in the balance of payments if the IS-LM intersection is below the BP curve? What then takes place in the economy under fixed exchange rates? Why?
Balance of payment is the difference of exports and imports. It is calculated as exports minus imports.
BOP = X-M
BOP = Balance of payment
X= Exports
M= Imports
The LM curve shows the relationship between money and liquidity. The money market equilibrium implies that, given the amount of value or money. As in this the interest rate is an increasing or rising function of the national income or output level. When output rises or increases the demand for money increases or raises. For this kind of relationship the money supply should be given.
The IS curve is droop down or downward sloping. As in this When the interest rate decreases or falls, investment demand rises or increases. It has a negative effect by keeping other factors constant. And in this way it increase causes of a multiplier effect on consumption, production ,national income and product rises or increases.
The BP curve is drawn or made on the same figure or diagram as the IS and LM curves and shows combinations of Y (income that is gross domestic product) and r (is the interest rate) at which the overall balance of payments is in equilibrium or at equilibrium point. Balance of payment is the difference of exports minus imports.
The IS and LM curves intersection represents the equilibrium point of output and interest rates. As that when real economy and money markets are in balance. The Multiple points or scenarios in time may be showed or represented by adding the additional IS and LM curves.
The curve or figure depicting balance of payments (exports minus imports)and equilibrium in the IS-LM model. The BP curve or figure is drawn on the same curve or diagram as the IS and LM curves. It shows combinations of Y (income that is gross domestic product) and r ( rate of interest) at which the overall balance of payments is in equilibrium point.
The things will take place when there is fixed exchange rate as follows:-
The fixed exchange rate is a method or regime applied by a government or central bank ties the country's currency. In the regime of fixed exchange rate there is an official exchange rate to another country's currency or the price of gold. The purpose or main use of a fixed exchange rate system is to keep a value of currency. This practice has to be done within a narrow range or band.
The situation in the balance of payment if the IS-LM intersection is below the BP curve.
The IS-LM-BP model is also known as Mundell-Fleming model. It is an extension of the IS-LM model. This model was given by the economists Robert Mundell and Marcus Fleming. They have who made almost done analysis of open economies in the 1960. It is a version of the IS-LM model for an free economy or open economy. This model incorporates an analysis of the balance in goods and financial markets and balance of payments. Balance of payment is the difference of exports and imports.
If the fixed exchange rate increases the balance of payment decreases by keeping other factors constant.
If the fixed exchange rate decreases the balance of payment increases by keeping other factors constant.
The main or Basic assumptions of this model are as follows:-
• The Spot and forward exchange rates are identical
• The existing exchange rates are expected to persist indefinitely.
• There should be fixed money wage rate
• There are unemployed resources
• In this constant returns to scale are assumed.
• Since now exchange rates are flexible, the balance of payments deficit will depreciate the domestic currency.
The IS-LM-BP model
It is a version of the IS-LM model for an free economy or open economy. Open economy is an economy which can do trade of goods and services freely all over the world. This model incorporates an analysis of the balance in goods and financial markets and balance of payments. Balance of payment is the difference of exports and imports.
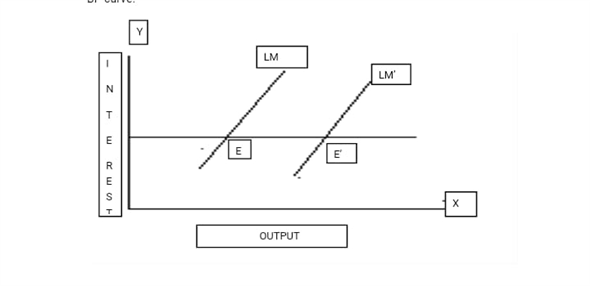
In the following diagram of the IS-LM-BP model we can see on Y axis interest rate and on X axis output. In this the curve are shown on LM shifts to LM' and E shifts to E'. E represents the equilibrium point.
BOP = X-M
BOP = Balance of payment
X= Exports
M= Imports
The LM curve shows the relationship between money and liquidity. The money market equilibrium implies that, given the amount of value or money. As in this the interest rate is an increasing or rising function of the national income or output level. When output rises or increases the demand for money increases or raises. For this kind of relationship the money supply should be given.
The IS curve is droop down or downward sloping. As in this When the interest rate decreases or falls, investment demand rises or increases. It has a negative effect by keeping other factors constant. And in this way it increase causes of a multiplier effect on consumption, production ,national income and product rises or increases.
The BP curve is drawn or made on the same figure or diagram as the IS and LM curves and shows combinations of Y (income that is gross domestic product) and r (is the interest rate) at which the overall balance of payments is in equilibrium or at equilibrium point. Balance of payment is the difference of exports minus imports.
The IS and LM curves intersection represents the equilibrium point of output and interest rates. As that when real economy and money markets are in balance. The Multiple points or scenarios in time may be showed or represented by adding the additional IS and LM curves.
The curve or figure depicting balance of payments (exports minus imports)and equilibrium in the IS-LM model. The BP curve or figure is drawn on the same curve or diagram as the IS and LM curves. It shows combinations of Y (income that is gross domestic product) and r ( rate of interest) at which the overall balance of payments is in equilibrium point.
The things will take place when there is fixed exchange rate as follows:-
The fixed exchange rate is a method or regime applied by a government or central bank ties the country's currency. In the regime of fixed exchange rate there is an official exchange rate to another country's currency or the price of gold. The purpose or main use of a fixed exchange rate system is to keep a value of currency. This practice has to be done within a narrow range or band.
The situation in the balance of payment if the IS-LM intersection is below the BP curve.
The IS-LM-BP model is also known as Mundell-Fleming model. It is an extension of the IS-LM model. This model was given by the economists Robert Mundell and Marcus Fleming. They have who made almost done analysis of open economies in the 1960. It is a version of the IS-LM model for an free economy or open economy. This model incorporates an analysis of the balance in goods and financial markets and balance of payments. Balance of payment is the difference of exports and imports.
If the fixed exchange rate increases the balance of payment decreases by keeping other factors constant.
If the fixed exchange rate decreases the balance of payment increases by keeping other factors constant.
The main or Basic assumptions of this model are as follows:-
• The Spot and forward exchange rates are identical
• The existing exchange rates are expected to persist indefinitely.
• There should be fixed money wage rate
• There are unemployed resources
• In this constant returns to scale are assumed.
• Since now exchange rates are flexible, the balance of payments deficit will depreciate the domestic currency.
The IS-LM-BP model
It is a version of the IS-LM model for an free economy or open economy. Open economy is an economy which can do trade of goods and services freely all over the world. This model incorporates an analysis of the balance in goods and financial markets and balance of payments. Balance of payment is the difference of exports and imports.
In the following diagram of the IS-LM-BP model we can see on Y axis interest rate and on X axis output. In this the curve are shown on LM shifts to LM' and E shifts to E'. E represents the equilibrium point.
2
What effect will an increase in income have on the demand for money? The LM curve? Why?
Introduction: According to Keynes demand for money is the amount of money desired to do day to day transactions (transaction demand), for unforeseeable circumstances (precautionary motive) and for spending on bonds and stock (speculative motive). Thus, demand for money can be explained as is the desire for holding cash for transaction, precautionary or speculative purpose.
Transaction demand for money depends on income.
 Where, MD t is the transaction demand for money and Y is income. The equation shows that transaction demand for money is function of income. It is directly related to income. Transaction demand for money increases with increase in level of income.
Precautionary demand for money depends on income.
 Where, MDp is the precautionary demand for money and Y is income. The equation shows that precautionary demand for money is function of income. It is directly related to income. Precautionary demand for money increases with increase in level of income.
Speculative demand for money depends on interest rate.
 Where, MD s is the speculative demand for money and i is the interest rate. The equation shows that speculative demand for money is function of interest rate. It is inversely related to interest rate. Speculative demand for money falls with increase in interest rate.
Total demand for money is summation of transaction, precautionary and speculative demand for money. On a two dimensional space with interest rate on Y axis and quantity of money on X axis, the demand for money curve is downward sloping.
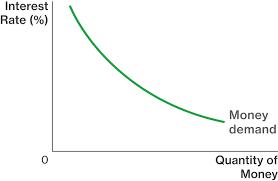 Figure 1: MD is the demand for money curve.
Step I: When the level of income increases, demand for money increases. Increase in demand for money shifts money demand curve upwards. As shown in figure 2, money demand curve will shift from MD to MD 1.
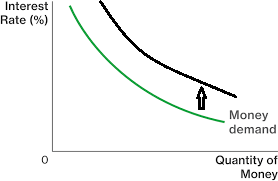 Figure 2: Upward shift in demand for money curve from MD to MD 1 due to increase in income.
Step II: LM curve is the Liquidity Preference curve. LM curve shows the combination of income/output (Y) and interest rate (i) at which money market is in equilibrium. All the points along the LM curve show that the demand for money is equal to supply of money. Demand for money is determined by income and interest rate. Supply of money is exogenous factor as it is determined by the central bank.
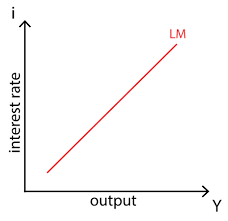 Figure 3 : LM curve
Increase or decrease in money demand and money supply affects the LM curve. When income increases, given the money supply, there is an increase in the demand for money. As a result of increased income, interest rate goes up. This causes upward movement along the LM curve.
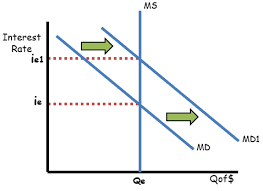
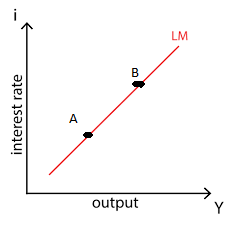 Figure 4: (a) Increase in income causes upward shift on demand for money curve;
(b) Movement from point A to point B on LM curve with increase in income.
As shown in figure 4, panel (a), increase in income causes money demand curve to shift from MD to MD 1. Interest rate increases from i e to i e1. In panel (b), there is movement from point A to point B. Thus there is increase in interest rate as well as increase in income.
Step III: With increase in income, there is upward movement along the LM curve. There is increase in income as well as increase in interest rate.
When income increases, people demand more money for transactions, precautionary motive and speculation. With increased demand for transaction, output increases at the same time with increased speculative demand for money the interest rate increase, because supply of money is fixed.
Transaction demand for money depends on income.
Where, MD t is the transaction demand for money and Y is income. The equation shows that transaction demand for money is function of income. It is directly related to income. Transaction demand for money increases with increase in level of income.Precautionary demand for money depends on income.
Where, MDp is the precautionary demand for money and Y is income. The equation shows that precautionary demand for money is function of income. It is directly related to income. Precautionary demand for money increases with increase in level of income.Speculative demand for money depends on interest rate.
Where, MD s is the speculative demand for money and i is the interest rate. The equation shows that speculative demand for money is function of interest rate. It is inversely related to interest rate. Speculative demand for money falls with increase in interest rate.Total demand for money is summation of transaction, precautionary and speculative demand for money. On a two dimensional space with interest rate on Y axis and quantity of money on X axis, the demand for money curve is downward sloping.
Figure 1: MD is the demand for money curve.Step I: When the level of income increases, demand for money increases. Increase in demand for money shifts money demand curve upwards. As shown in figure 2, money demand curve will shift from MD to MD 1.
Figure 2: Upward shift in demand for money curve from MD to MD 1 due to increase in income.Step II: LM curve is the Liquidity Preference curve. LM curve shows the combination of income/output (Y) and interest rate (i) at which money market is in equilibrium. All the points along the LM curve show that the demand for money is equal to supply of money. Demand for money is determined by income and interest rate. Supply of money is exogenous factor as it is determined by the central bank.
Figure 3 : LM curveIncrease or decrease in money demand and money supply affects the LM curve. When income increases, given the money supply, there is an increase in the demand for money. As a result of increased income, interest rate goes up. This causes upward movement along the LM curve.
Figure 4: (a) Increase in income causes upward shift on demand for money curve; (b) Movement from point A to point B on LM curve with increase in income.
As shown in figure 4, panel (a), increase in income causes money demand curve to shift from MD to MD 1. Interest rate increases from i e to i e1. In panel (b), there is movement from point A to point B. Thus there is increase in interest rate as well as increase in income.
Step III: With increase in income, there is upward movement along the LM curve. There is increase in income as well as increase in interest rate.
When income increases, people demand more money for transactions, precautionary motive and speculation. With increased demand for transaction, output increases at the same time with increased speculative demand for money the interest rate increase, because supply of money is fixed.
3
Ignoring the LM curve, suppose that the economy is located at a point to the left (right) of the IS curve. Why is there pressure for the economy to expand (contract)?
The LM curve shows the relationship between money and liquidity. As the LM curve is based on money and liquidity. The money market equilibrium (where demand and supply are equal) implies that, given the amount of value or money. As in this the rate of interest is an increasing or a rising function of the national product or income or output level of an economy. When output rises or increases the demand for money increases or raises. For this kind of relationship the money supply should be given.
The IS curve is droop down or downward sloping. As in this When the interest rate decreases or falls, investment demand rises or increases. It has a negative effect by keeping other factors constant. And in this way it increase causes of a multiplier effect on consumption, production ,national income and product rises or increases.
The BP figure or curve is drawn or made on the same figure or diagram as the IS and LM figure orv curves and shows the combinations of Y (income that is gross domestic product) and r (is the interest rate) at which the overall balance of payments(difference of exports and imports) is in equilibrium or at equilibrium point. Balance of payment is the difference of exports minus imports.
That economy is located to the left of IS curve and also left to the LM curve.
The IS and LM curves intersection represents the equilibrium point of output and interest rates. As that when real economy and money markets are in balance. The Multiple points or scenarios in time may be showed or represented by adding the additional IS and LM curves.
The curve or figure depicting balance of payments (exports minus imports)and equilibrium (where demand and supply are equal)in the IS-LM figure or model. The BP curve or figure is drawn or made on the same curve or diagram as the IS and LM curves. It shows the combinations of Y (income that is gross domestic product) and r ( rate of interest) at which the overall balance of payments is in equilibrium (where demand and supply are equal) point.
The things will take place when there is fixed exchange rate as follows:-
The fixed-exchange rate is the method or regime applied by the government or the central bank ties the nation's currency. In the regime of fixed-exchange rate there is an official exchange rate to another nation's currency or the price of gold. The purpose or main use of a fixed-exchange rate system is to keep the value of currency. This practice has to be done within a narrow range or band.
The situation arises in the balance of payment if the IS-LM intersection is below the BP curve.
The IS-LM-BP idea or model is also known or called as the Mundell-Fleming idea or model. It is an extension or broad version of the IS-LM model. This model or idea was given by the economists Marcus Fleming and Robert Mundell . They have who made almost done analysis and identification of open economies in the year 1960. It is the version of the IS-LM model for an free economy or open economy. This model incorporates an analysis of the balance in goods and financial markets and balance of payments. Balance of payment is the difference of exports and imports.
If the fixed exchange rate increases the balance of payment decreases by keeping other factors constant.
If the fixed exchange rate decreases the balance of payment increases by keeping other factors constant.
The IS-LM-BP model
It is a version of the IS-LM model for an free economy or open economy. Open economy is an economy which can do trade of goods and services freely all over the world. This model incorporates an analysis of the balance in goods and financial markets and balance of payments. Balance of payment is the difference of exports and imports.
The main or Basic assumptions of IS-LM-BP model are as follows:-
• The Spot exchange rates and forward exchange rates are same or identical
• The existing exchange rates are expected to persist not surely or indefinitely.
• The money wage rate should be fixed.
• There are not employed or unemployed resources
• In this concept of constant returns to scale are assumed.
• Since now the exchange rates are can adjust easily or flexible, the balance of payments (difference of exports and imports) deficit will depreciate the domestic currency.
When (S+M+T) equal to aggregate supply greater than (I+X+G) equal to aggregate demand. It means supply is more than demand. There will be price control. There will be deflation but no inflation.
When (S+M+T) equal to aggregate supply less than (I+X+G) equal to aggregate demand. It means supply is less than demand. There will be price high. There will be inflation but no deflation.
S = Savings
M = Imports
T = Tax
I= Investment
X = Exports
G = Government
In the following diagram of the IS-LM-BP model we can see on Y axis interest rate and on X axis output. In this the curve are shown on LM shifts to LM' and E shifts to E'. E represents the equilibrium point.
4
Explain carefully why a country settles in equilibrium at the intersection of the IS, LM , and BP curves.
Unlock Deck
Unlock for access to all 23 flashcards in this deck.
Unlock Deck
k this deck
5
What is the difference between internal balance and external balance?
Unlock Deck
Unlock for access to all 23 flashcards in this deck.
Unlock Deck
k this deck
6
Is monetary or fiscal policy more effective under fixed rates? Why?
Unlock Deck
Unlock for access to all 23 flashcards in this deck.
Unlock Deck
k this deck
7
Explain why the LM curve slopes upward.
Unlock Deck
Unlock for access to all 23 flashcards in this deck.
Unlock Deck
k this deck
8
In Figure, suppose that the economy is located to the left of the IS curve and also to the left of the LM curve. Is ( S + M + T) greater or less than ( I + X + G) ? Is there an excess demand or excess supply of money? What will happen to income and why?
FIGURE Simultaneous Equilibrium in the Real and Monetary Sectors
Only at point q is there equilibrium in both the real and monetary sectors of the economy. If the economy is situated away from q at point F , saving plus imports plus taxes exceeds investment plus exports plus government spending; in addition, there is an excess demand for money. Movement occurs (by any of a number of different paths) to point q. Any other point away from point q also sets forces in motion to move the economy to point q.
Unlock Deck
Unlock for access to all 23 flashcards in this deck.
Unlock Deck
k this deck
9
Why is domestic monetary policy ineffective in an open economy under a fixed exchange rate regime?
Unlock Deck
Unlock for access to all 23 flashcards in this deck.
Unlock Deck
k this deck
10
If the economy is operating at c in Figure, what policy actions should be carried out to reach the internal balance target? Why?
FIGURE Internal Balance, External Balance, and Policy Instrument Classification
in a Mundell-Fleming Diagram
The IB curve reflects all combinations of interest rates i (monetary policy) and net government spending ( G ? T) that lead to the attainment of domestic targets, that is, internal balance. Similarly, the flatter EB curve reflects all combinations of i and ( G ? T) that generate equilibrium in the balance of payments for a given exchange rate. Points above the IB curve reflect unacceptably high unemployment, and points below reflect unacceptably rapid inflation. Similarly, points above the EB curve represent a surplus in the balance of payments, and points below represent a deficit. It is clear that internal balance and external balance are obtained simultaneously only at i * and ( G ? T) *. Finally, if the economy is not at i * and ( G ? T) *, monetary policy should be pursued to reach external balance and fiscal policy to reach internal balance.
Unlock Deck
Unlock for access to all 23 flashcards in this deck.
Unlock Deck
k this deck
11
If bank reserves increase, what happens to the supply of money? The LM curve? Why?
Unlock Deck
Unlock for access to all 23 flashcards in this deck.
Unlock Deck
k this deck
12
Explain the rationale for an upward-sloping BP curve.
Unlock Deck
Unlock for access to all 23 flashcards in this deck.
Unlock Deck
k this deck
13
What will happen to the relative holdings of foreign and domestic assets by the home country if there is an increase in the money supply and capital is perfectly mobile? Why?
Unlock Deck
Unlock for access to all 23 flashcards in this deck.
Unlock Deck
k this deck
14
Which policy tool should be used to attain external balance in the Mundell-Fleming diagram? Why?
Unlock Deck
Unlock for access to all 23 flashcards in this deck.
Unlock Deck
k this deck
15
Explain how the degree of capital mobility affects the degree of slope of the BP curve.
Unlock Deck
Unlock for access to all 23 flashcards in this deck.
Unlock Deck
k this deck
16
Explain why a developing country with a fixed exchange rate and foreign exchange controls in place (perfectly immobile capital) may find itself dependent on growth in exports, foreign investment, or foreign aid to attain economic growth.
Unlock Deck
Unlock for access to all 23 flashcards in this deck.
Unlock Deck
k this deck
17
Under what capital flow conditions is fiscal policy least effective in a fixed-rate regime? Most effective? Why?
Unlock Deck
Unlock for access to all 23 flashcards in this deck.
Unlock Deck
k this deck
18
Why does devaluing the domestic currency have an expansionary effect on the economy? Does this expansionary effect take place if capital is perfectly immobile? Why or why not?
Unlock Deck
Unlock for access to all 23 flashcards in this deck.
Unlock Deck
k this deck
19
Suppose you were instructed to construct a BP curve of one state in the United States with another, such as New York's BP curve with Illinois. What general slope would you expect for this curve and why?
Unlock Deck
Unlock for access to all 23 flashcards in this deck.
Unlock Deck
k this deck
20
Why must countries, especially those prone to official reserve transactions deficits, maintain relatively large holdings of foreign exchange reserves in a fixed exchange rate system?
Unlock Deck
Unlock for access to all 23 flashcards in this deck.
Unlock Deck
k this deck
21
Japan has been running huge current account surpluses in the last decade. Because of concern over this surplus (and over the associated U.S. current account deficit with Japan), U.S. government officials for several years urged the Japanese government to adopt a more expansionary fiscal policy stance. Using an IS/LM/BP diagram (assuming that the BP curve is flatter than the LM curve) and starting from a position of equilibrium, explain how the adoption of such a policy stance would affect Japan's national income, current account, capital account, and money supply. Would your conclusions be different if the BP curve were steeper than the LM curve? Why or why not? (Note: Assume throughout your answer that Japan does not allow the value of the yen to change.)
Unlock Deck
Unlock for access to all 23 flashcards in this deck.
Unlock Deck
k this deck
22
If financial capital is relatively mobile between countries, what difficulties emerge if the various countries have different interest rate targets for attaining domestic inflation and/or growth objectives? (Assume fixed exchange rates.)
Unlock Deck
Unlock for access to all 23 flashcards in this deck.
Unlock Deck
k this deck
23
Explain why a country that wishes to have an independent monetary policy as well as a fixed exchange rate would have to institute controls on capital flows into and out of the country in order to accomplish these two objectives.
Unlock Deck
Unlock for access to all 23 flashcards in this deck.
Unlock Deck
k this deck
Unlock Deck
Unlock for access to all 23 flashcards in this deck.


