Deck 17: The Distribution of Income
Full screen (f)
Question
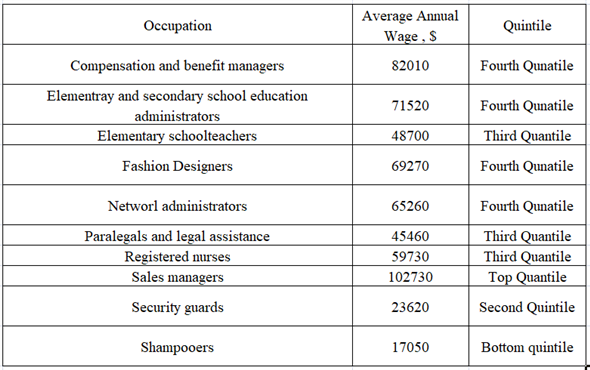
The following table gives 10 occupations and their average annual wages, as determined by the Bureau of Labor Statistics (these are nationwide averages, across all experience levels).
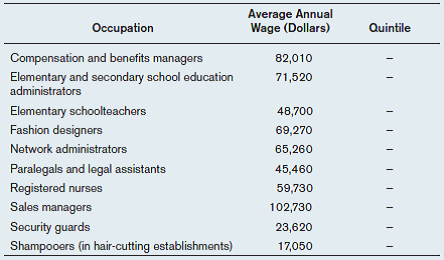
a) Using Table 17.1, on page 371, identify which quintile an average worker in each occupation would be in, assuming a one-earner household.
b) Suppose a fashion designer married a security guard, and they both kept working. Which quintile would their household be in?
c) Suppose a network administrator married a registered nurse. Which quintile would their household be in (assuming both keep working)?
Reference Table 17.1
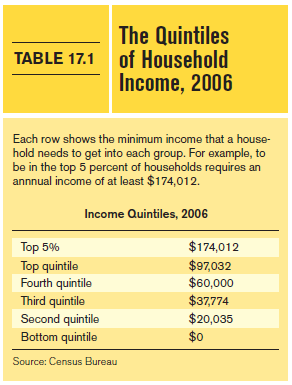
Question
The table below gives the 80 th and 20 th percentiles of household income for 1996 and 2006, measured in inflation-adjusted 2006 dollars.
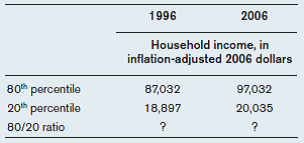
a) Calculate the 80/20 ratio for each year.
b) Did inequality increase between 1996 and 2006? Explain.
c) Based on this table, do you think that poor families were worse or better off in 2006 compared to 1996? Explain.
a) Calculate the 80/20 ratio for each year.
b) Did inequality increase between 1996 and 2006? Explain.
c) Based on this table, do you think that poor families were worse or better off in 2006 compared to 1996? Explain.
Question
Question
Question
Question
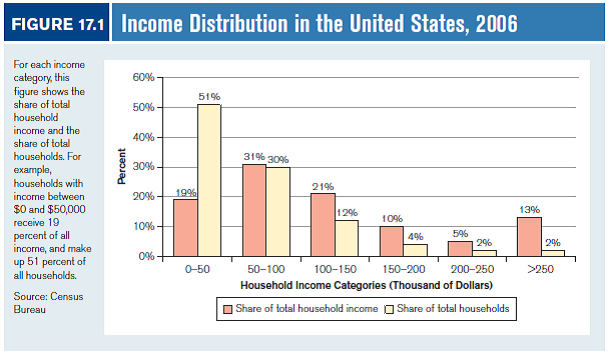
Look at Figure 17.1, on page 370, which gives some basic information about the income distribution in 2006.
a) What percentage of households received between $100,000 and $150,000 in income in 2006?
b) What percentage of total income did this group get?
c) What percentage of households received between $0 and $100,000 in income in 2006? (Hint: You can add the percentages of different categories.)d) Look at the households with incomes over $250,000. What percentage of total income did this group get?
Reference Figure 17.1

Unlock Deck
Sign up to unlock the cards in this deck!
Unlock Deck
Unlock Deck
1/6
Play
Full screen (f)
Deck 17: The Distribution of Income
1
The following table gives 10 occupations and their average annual wages, as determined by the Bureau of Labor Statistics (these are nationwide averages, across all experience levels).
a) Using Table 17.1, on page 371, identify which quintile an average worker in each occupation would be in, assuming a one-earner household.
b) Suppose a fashion designer married a security guard, and they both kept working. Which quintile would their household be in?
c) Suppose a network administrator married a registered nurse. Which quintile would their household be in (assuming both keep working)?
Reference Table 17.1
a)Quintile is the 20 percent of higher income.
Thus, with highest income of $102,730, Quintile will be defined as following.
Bottom quintile =$0 - $20,546
Second quintile = $20,546- $41,092
Third quintile = $41,092- $61,638
Fourth Quintile = $61,638- $82,184
Top Quintile = $82,184- $102,730
Basis above calculations, allocation of each occupation to different quintile is summarized as below.
 b)When a fashion designer is married to a security guard, couple will have the income now,
 This income falls in top quintile.
c)When a network administer married to a registered nurse, couple will have income,
 Hence, the couple will be in top quintile.
Thus, with highest income of $102,730, Quintile will be defined as following.
Bottom quintile =$0 - $20,546
Second quintile = $20,546- $41,092
Third quintile = $41,092- $61,638
Fourth Quintile = $61,638- $82,184
Top Quintile = $82,184- $102,730
Basis above calculations, allocation of each occupation to different quintile is summarized as below.
b)When a fashion designer is married to a security guard, couple will have the income now, This income falls in top quintile. c)When a network administer married to a registered nurse, couple will have income,
Hence, the couple will be in top quintile. 2
The table below gives the 80 th and 20 th percentiles of household income for 1996 and 2006, measured in inflation-adjusted 2006 dollars.
a) Calculate the 80/20 ratio for each year.
b) Did inequality increase between 1996 and 2006? Explain.
c) Based on this table, do you think that poor families were worse or better off in 2006 compared to 1996? Explain.
a) Calculate the 80/20 ratio for each year.
b) Did inequality increase between 1996 and 2006? Explain.
c) Based on this table, do you think that poor families were worse or better off in 2006 compared to 1996? Explain.
a)80/20 ratio is the ratio of 80 th quintile of income to 20 th quintile of income.
For year 1996,
Ratio is
 For year 2006,
Ratio is
 Hence, 80/20 ratio for year 1996 and 2006 are
 b)80/20 ratio measures the difference or the gap between the high income and low income. This is used as tool to measure the spread of income inequality.
Since, the ratio has increased from 4.61 to 4.84 during the period 1996 and 2006, income inequality has increased.
c)During the study period, income of 80 th percentile household has increased by 11.49 % (calculating the difference of income divided by the income of 1996), while that of 20 th percentile has increased only 6%, thus the gap has increased further.
Hence, poor families were worse off in 2006 compared to 1996
For year 1996,
Ratio is
For year 2006, Ratio is
Hence, 80/20 ratio for year 1996 and 2006 are b)80/20 ratio measures the difference or the gap between the high income and low income. This is used as tool to measure the spread of income inequality. Since, the ratio has increased from 4.61 to 4.84 during the period 1996 and 2006, income inequality has increased.
c)During the study period, income of 80 th percentile household has increased by 11.49 % (calculating the difference of income divided by the income of 1996), while that of 20 th percentile has increased only 6%, thus the gap has increased further.
Hence, poor families were worse off in 2006 compared to 1996
3
Many CEOs of large corporations have enormous pay packages in the tens of millions of dollars per year. Such high pay helps contribute to income inequality because the vast majority of people earn much less. Suppose Congress passed a law that saying that the annual pay for any job could not exceed $500,000 per year.
a) What effect would this law have on the market for corporate executives?
b) Do you think such a law makes sense? Why or why not?
a) What effect would this law have on the market for corporate executives?
b) Do you think such a law makes sense? Why or why not?
a)CEO's role is not confined to heading a corporation, but successfully running a corporation is a very tough job. People with high experience and leadership ability can only perform this task.
By putting a cap on the pay of CEO, the charm that post of CEO is holding will lose. CEO's marginal earnings has reduced, which will reduce the extra effort by the CEO's to earn more by working more. This will impede the profit of company and economic growth in long run.
CEO's salary works as motivator and aim for middle managers to work harder to get that position. In absence of high remuneration, the completion for the post will lose its attractiveness and talented and able people will avoid trying to take the tough position without matching return.
b)High payment for the CEO's works as stimulator for talents to create competition, it is beneficial for the company and ultimately for the overall economy.
Such law will remove the competition and growth. Hence, such law of capping rewards does not make sense.
4
Suppose our tax system imposed a 30 percent tax rate on income up to $50,000 and a 10 percent tax rate on income over $50,000.
a) Would this tax system be progressive or regressive?
b) The Social Security tax is 6.2 percent of wages, up to a maximum of $97,500 in 2007. For incomes above that maximum, no additional taxes are paid. Is the Social Security tax progressive or regressive?
a) Would this tax system be progressive or regressive?
b) The Social Security tax is 6.2 percent of wages, up to a maximum of $97,500 in 2007. For incomes above that maximum, no additional taxes are paid. Is the Social Security tax progressive or regressive?
Unlock Deck
Unlock for access to all 6 flashcards in this deck.
Unlock Deck
k this deck
5
Say whether each of the following statements is true or false.
a) Annual income, as measured by the U.S. Census Bureau, includes Social Security payments and the interest on savings accounts.
b) A quintile represents 25 percent of households.
c) One definition of income inequality is the difference between the best-off and the worst-off members of the economy.
d) If the 80/20 ratio increases, inequality is rising.
e) Judging by the increase in the 80/20 ratio, the rise in inequality has been dramatic.
f) One reason for rising inequality has been the introduction of computers into the workplace.
g) An important reason for rising inequality has been the increase in the minimum wage, adjusted for inflation.
h) The poverty rate has dropped sharply since 2000.
i) One argument in favor of government intervention to reduce inequality is that more equal societies experience weaker growth.
j) One argument against government intervention to reduce inequality is that it will give government too much control over the economy.
k) With a progressive tax, after-tax income distribution will be less equal than pretax income distribution.
l) The federal tax system has become more progressive over the years.
m) Education differences can help explain much of the gender pay gap.
Unlock Deck
Unlock for access to all 6 flashcards in this deck.
Unlock Deck
k this deck
6
Look at Figure 17.1, on page 370, which gives some basic information about the income distribution in 2006.
a) What percentage of households received between $100,000 and $150,000 in income in 2006?
b) What percentage of total income did this group get?
c) What percentage of households received between $0 and $100,000 in income in 2006? (Hint: You can add the percentages of different categories.)d) Look at the households with incomes over $250,000. What percentage of total income did this group get?
Reference Figure 17.1
a) What percentage of households received between $100,000 and $150,000 in income in 2006?
b) What percentage of total income did this group get?
c) What percentage of households received between $0 and $100,000 in income in 2006? (Hint: You can add the percentages of different categories.)d) Look at the households with incomes over $250,000. What percentage of total income did this group get?
Reference Figure 17.1
Unlock Deck
Unlock for access to all 6 flashcards in this deck.
Unlock Deck
k this deck
Unlock Deck
Unlock for access to all 6 flashcards in this deck.


