Deck 1: The Economy and the Environment
Full screen (f)
Question
Economies grow by investing in new sources of productivity, new plants and equipment, infrastructure such as roads, and so on. How does this type of investment affect the flows depicted in Figure 2.1?
FIGURE 2.1 The Environment and the Economy

FIGURE 2.1 The Environment and the Economy
Question
Question
Question
As depicted in Figure 2.3, most emissions from individual sources get mixed in with those of other sources, to produce the general level of ambient quality. What problems does this present in adopting emission-control policies to get a cleaner environment?
FIGURE 2.3 Emissions, Ambient Quality, and Damages
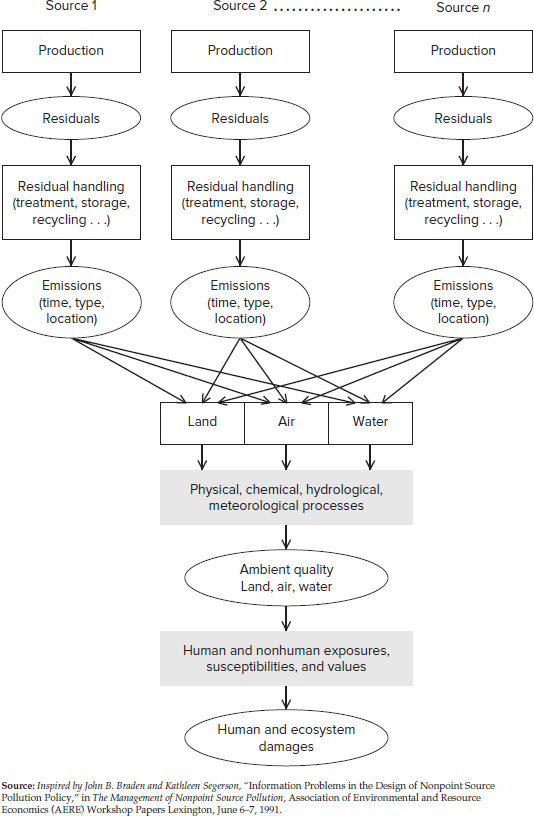
FIGURE 2.3 Emissions, Ambient Quality, and Damages
Question
Consider the production and use of single-use, plastic shopping bags, and examine their flows along all parts of Figure 2.1. Do the same for paper shopping bags.
FIGURE 2.1 The Environment and the Economy
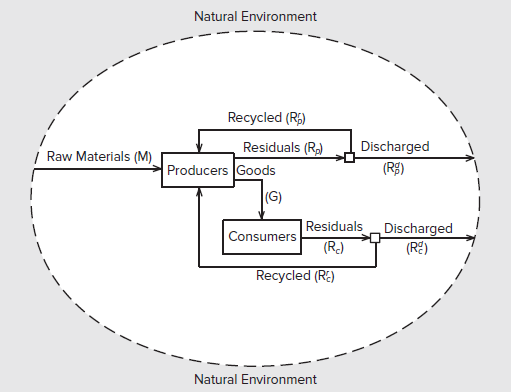
FIGURE 2.1 The Environment and the Economy
Question
Question
Suppose there is a technological change that allows firms to produce goods and services with less pollution. How would this affect the production possibilities curves of Figure 2.2, and where might society choose to locate itself on this curve?
FIGURE 2.2 Production Possibility Curves for Current and Future Generations
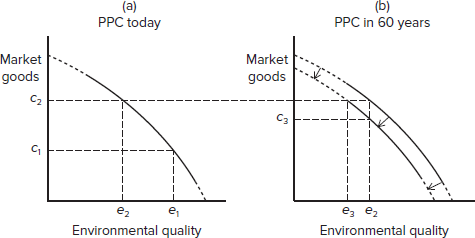
FIGURE 2.2 Production Possibility Curves for Current and Future Generations

Unlock Deck
Sign up to unlock the cards in this deck!
Unlock Deck
Unlock Deck
1/7
Play
Full screen (f)
Deck 1: The Economy and the Environment
1
Economies grow by investing in new sources of productivity, new plants and equipment, infrastructure such as roads, and so on. How does this type of investment affect the flows depicted in Figure 2.1?
FIGURE 2.1 The Environment and the Economy
FIGURE 2.1 The Environment and the Economy
Residual balance model: production and consumption:
Two main functions of an economy are production and consumption, and these two are the core of circular flow of income in the economy. However, both the economic activities also produce residuals (leftover waste products).
But, some leftover waste products can be recycled, which further can be used in any production process. This way of analyzing both the production and consumption process to account for residuals discharged to the environment is defined as the residual balance model. The resource balance model can be understood from both the production and consumption point of view.
Thus, to compare the discharged leftover waste product to the environment in both the production
 and consumption
 processes with resources used in the production process, the resources balance model can be considered, which is shown in Figure-1.
Figure-1: The residual balance model
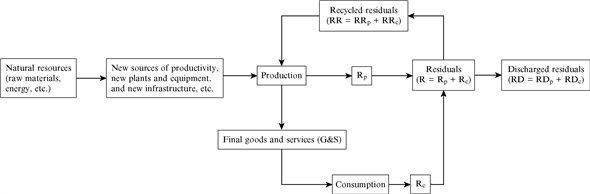 Impact of investment up on the resources balance model:
Raw materials and energy combined with new sources of productivity, opening up of new plants, investment on new equipment, and infrastructure can boost the productivity of an economy and thereby lead to economic growth.
An increase in investment raises the real GDP of an economy, which means more final goods and services are available for consumption purpose.
Increase in final goods and services produced will produce more leftover waste products
 ; that is,
 will increase. Increase in final goods and services produced means more goods are available for consumption too. Consumption of final goods and services by individuals, households, and private organization also leads to leftover waste products
 ; that is,
 will increase. Thus, total amount of residuals (R) generated in an economy will increase.
It is learned that residuals can be recycled. However, 100 percent recycling is not possible. In the relative sense, recycled residual (RR) from both the production activity
 and consumption activity
 can increase. But, there will be absolute increase in the residuals discharged
 back to the environment.
Hence, it can be concluded that investment that causes increase in real GDP would lead to increase in absolute amount of residuals discharged back to the environment.
Two main functions of an economy are production and consumption, and these two are the core of circular flow of income in the economy. However, both the economic activities also produce residuals (leftover waste products).
But, some leftover waste products can be recycled, which further can be used in any production process. This way of analyzing both the production and consumption process to account for residuals discharged to the environment is defined as the residual balance model. The resource balance model can be understood from both the production and consumption point of view.
Thus, to compare the discharged leftover waste product to the environment in both the production
and consumption processes with resources used in the production process, the resources balance model can be considered, which is shown in Figure-1.Figure-1: The residual balance model
Impact of investment up on the resources balance model: Raw materials and energy combined with new sources of productivity, opening up of new plants, investment on new equipment, and infrastructure can boost the productivity of an economy and thereby lead to economic growth.
An increase in investment raises the real GDP of an economy, which means more final goods and services are available for consumption purpose.
Increase in final goods and services produced will produce more leftover waste products
; that is, will increase. Increase in final goods and services produced means more goods are available for consumption too. Consumption of final goods and services by individuals, households, and private organization also leads to leftover waste products ; that is, will increase. Thus, total amount of residuals (R) generated in an economy will increase.It is learned that residuals can be recycled. However, 100 percent recycling is not possible. In the relative sense, recycled residual (RR) from both the production activity
and consumption activity can increase. But, there will be absolute increase in the residuals discharged back to the environment.Hence, it can be concluded that investment that causes increase in real GDP would lead to increase in absolute amount of residuals discharged back to the environment.
2
What is the difference between a residual and a pollutant? Illustrate this in the context of a common airborne emission such as sulfur dioxide (SO ₂ ); with noise; with junked automobiles; with an unsightly building.
Residual:
Two major functions of an economy, production and consumption, produce residuals or leftover waste products. Waste materials, products, and energy generated from any production process are called production residuals.
Similarly, leftover waste products after the consumption activity is over are termed as consumption residuals.
Pollutants:
Pollutants are generally forms of residuals, which alter or lower the ambient quality level after being introduced to the natural environment.
Differences between a residual and a pollutant
Differences between residuals and pollutants are given below:
• All pollutants are residuals but all residuals are not pollutants, this is because all residuals do not damage environmental quality.
• Some proportion of residuals generated from production and consumption processes becomes pollutants when introduced to the environment.
• Some proportion of residuals can be re-used, but pollutants cannot be reused as it is already introduced to natural environment.
• All residuals may not have harmful effects on the environmental quality, but all pollutants do alter the environmental quality and have negative impact on natural environment.
Airborne emission:
Sulfur dioxide
 when emitted from tailpipe of automobile would be a residual, and it would be a pollutant when SO ₂ is exposed to the environment and thereby altering the ambient quality.
Similarly, the noise and junked automobiles are residuals, and they would become a pollutant once they damage the quality of environment.
Unsighted buildings could either be a residual or a pollutant based on the aesthetic sense.
Two major functions of an economy, production and consumption, produce residuals or leftover waste products. Waste materials, products, and energy generated from any production process are called production residuals.
Similarly, leftover waste products after the consumption activity is over are termed as consumption residuals.
Pollutants:
Pollutants are generally forms of residuals, which alter or lower the ambient quality level after being introduced to the natural environment.
Differences between a residual and a pollutant
Differences between residuals and pollutants are given below:
• All pollutants are residuals but all residuals are not pollutants, this is because all residuals do not damage environmental quality.
• Some proportion of residuals generated from production and consumption processes becomes pollutants when introduced to the environment.
• Some proportion of residuals can be re-used, but pollutants cannot be reused as it is already introduced to natural environment.
• All residuals may not have harmful effects on the environmental quality, but all pollutants do alter the environmental quality and have negative impact on natural environment.
Airborne emission:
Sulfur dioxide
when emitted from tailpipe of automobile would be a residual, and it would be a pollutant when SO ₂ is exposed to the environment and thereby altering the ambient quality.Similarly, the noise and junked automobiles are residuals, and they would become a pollutant once they damage the quality of environment.
Unsighted buildings could either be a residual or a pollutant based on the aesthetic sense.
3
Why are long-lived, cumulative pollutants so much harder to manage than short-lived, noncumulative pollutants?
Pollution management: cumulative and noncumulative pollutants:
Cumulative pollutants cumulate over time in the environment and their rate of decay is very slow, for example, plastic, radioactive waste, etc.
Noncumulative pollutants have a tendency to dissipate soon after being emitted. For example, noise is emitted in surrounding air, and it tends to dissipate as soon as its source is shut down.
Noncumulative pollutants subject to the current emission result to current damage. Reducing current emission to zero would lead to zero ambient concentration. But, in the case of cumulative pollutants, time span is more and thus it is hard to isolate the cause-and-effect relationship between pollutants.
Cumulative pollution is also hard to manage because its impact up on environment is distributed across time and thereby it is difficult to adopt any policy at present because current emission might have a smaller impact with respect to current time on the ambient quality or ambient concentration than its impact on the future ambient quality.
Cumulative impact also makes pollution management more complex as it mixes up both the current damage and future damage.
For example, radioactive waste decays at a very slow rate compared to human life, and it also mixes up the present ambient quality with the past and future ambient quality.
Another example of cumulative impact is that, a smaller emission of pollutants to the environment at present might have a smaller impact on the ambient quality at current time or in short-run, but in the long-run, volume of pollutants emitted to the environment intensifies and does more damage to the ambient quality.
Hence, cumulative pollutants are harder to manage than the noncumulative pollutants.
4
As depicted in Figure 2.3, most emissions from individual sources get mixed in with those of other sources, to produce the general level of ambient quality. What problems does this present in adopting emission-control policies to get a cleaner environment?
FIGURE 2.3 Emissions, Ambient Quality, and Damages
FIGURE 2.3 Emissions, Ambient Quality, and Damages
Unlock Deck
Unlock for access to all 7 flashcards in this deck.
Unlock Deck
k this deck
5
Consider the production and use of single-use, plastic shopping bags, and examine their flows along all parts of Figure 2.1. Do the same for paper shopping bags.
FIGURE 2.1 The Environment and the Economy
FIGURE 2.1 The Environment and the Economy
Unlock Deck
Unlock for access to all 7 flashcards in this deck.
Unlock Deck
k this deck
6
What considerations come into play when considering whether a country or any other political entity is spending the right amount for environmental quality improvements?
Unlock Deck
Unlock for access to all 7 flashcards in this deck.
Unlock Deck
k this deck
7
Suppose there is a technological change that allows firms to produce goods and services with less pollution. How would this affect the production possibilities curves of Figure 2.2, and where might society choose to locate itself on this curve?
FIGURE 2.2 Production Possibility Curves for Current and Future Generations
FIGURE 2.2 Production Possibility Curves for Current and Future Generations
Unlock Deck
Unlock for access to all 7 flashcards in this deck.
Unlock Deck
k this deck
Unlock Deck
Unlock for access to all 7 flashcards in this deck.


