Deck 18: Income Distribution and Poverty
Full screen (f)
Question
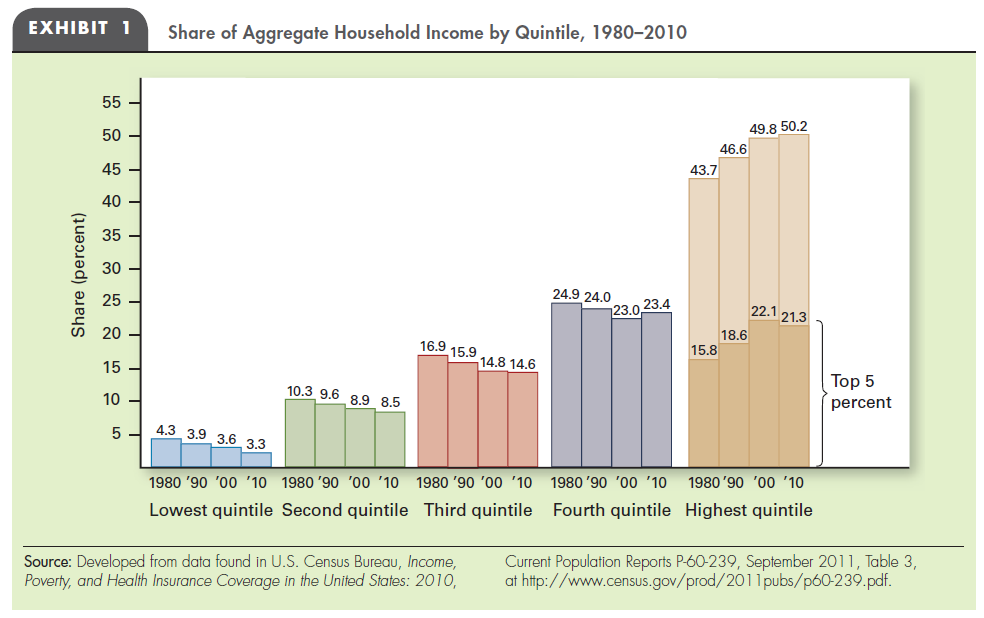
DISTRIBUTION OF HOUSEHOLD INCOME Look back at Exhibit 1 in this chapter. How would you explain the shift of the U.S. income distribution in the last three decades?
Question
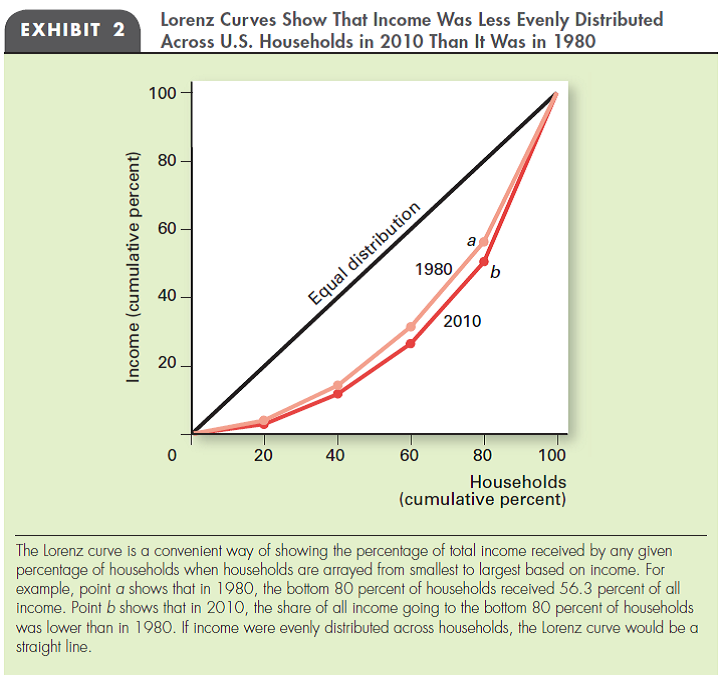
LORENZ CURVE What is a Lorenz curve? What does the Lorenz curve in Exhibit 2 illustrate?
Question
Question
Question
Question
Question
Question
Question
Question
Question
Question
Question
Question

Unlock Deck
Sign up to unlock the cards in this deck!
Unlock Deck
Unlock Deck
1/14
Play
Full screen (f)
Deck 18: Income Distribution and Poverty
1
DISTRIBUTION OF HOUSEHOLD INCOME Look back at Exhibit 1 in this chapter. How would you explain the shift of the U.S. income distribution in the last three decades?
Income distribution:
Income distribution refers to the distribution of nation's Gross Domestic Product (GDP) among the population.
Shift of the U.S. income distribution:
The households are classified under five income quintiles. The first quintile is the poorest households and the fifth quintile is the richest households.
The income share of richest quintile to the total household income of U.S. has increased from 43.7 percent in the year 1980 to 50.2 percent in the year 2010.
The income share was higher due to the more number of individuals worked in the richest quintile. In the richest quintile, 2 to 4 people were working per household. There was a reduction in the top marginal tax that gave less interest to avoid the tax, which in turn increased the reported income.On the other hand, the income share of poorest quintile to the total household income of U.S. has decreased from 4.3 percent in the year 1980 to 3.3 percent in the year 2010.
The income share was lower due to the growth of the single parent and lower number of person worked in the poorest quintile. In the poorest quintile, 1 person was working per household.
2
LORENZ CURVE What is a Lorenz curve? What does the Lorenz curve in Exhibit 2 illustrate?
Lorenz curve:
Lorenz curve shows the percentage share of total income earned by different stratum of population when the population is arranged in an ascending order (from smaller income to highest income). This curve is used to graphically represent the income inequality.
Interpretation of U.S. Lorenz curve:
The 45 degree straight line represents the equality of income. The income inequality line is measured by the deviation that exists between the 45 degree straight line and the Lorenz curve. If the Lorenz curve travelled along the straight line, then there is no income inequality. The more is the difference between the 45 degree straight line and the Lorenz curve, the higher will be the level of inequality and vice versa. Observations from the Lorenz curve given in the text book (Exhibit 2)
- The Lorenz curve for the 1980s is closer to the 45 degree straight line than the Lorenz
curve for 2010.
- This implies that there was a higher income inequality in the year 2010 than in 1980.
- It also reveals that 20 percent of the households accounted for nearly 50 percent of the
income in both the time periods.
3
ECONOMIC TRENDS AND INCOME INEQUALITY Identify economic trends that have hurt those with few skills and little education, and at the same time have helped those with more skills and a good education.
An economic trend which hurt the persons who have fewer skills and little education:
The following economic trend hurts the people who have fewer skills and little educational qualification. But, it favors the one who have more skill and higher educational qualification.
• Industrial deregulation reduces the power of the government in regulating industries. With the absence of government intervention, industries reduce the wage for fewer skilled and little educated persons. Because the supply of fewer skill and little educated persons is higher than required. Whereas, the demand is more for the highly skilled and educated people. Therefore, the industries will pay more salary to them.
• Free international trade leads to heavy competition in the domestic market by the low cost of labor-intensive goods which are produced by fewer skilled and less educated persons. To maximize profit, countries will increase the imports of labor-intensive goods than producing it in the domestic market. It leads to shutting down the industry and the people who are employed in such industries become unemployed.• Declining unionization reduces the power of negotiation. Hence, the union cannot demand more wages from the management for their members.
• Computerization reduced the need for low clerical worker and it requires highly skilled persons to operate computers. Hence, the fewer skilled persons become unemployed and the highly skilled and more educated persons get the job.• Technological changes require higher skilled and educated persons. Since, the fewer skilled and less educated persons cannot cope with the new technology, they become unemployed in the technology-oriented world.
4
MEDIAN VERSUS MEAN What's the difference between the median household income and the mean household income?
Unlock Deck
Unlock for access to all 14 flashcards in this deck.
Unlock Deck
k this deck
5
Case Study: Marital Sorting and Income Inequality
How have marriage trends widened the gap between low-income and high-income households?
How have marriage trends widened the gap between low-income and high-income households?
Unlock Deck
Unlock for access to all 14 flashcards in this deck.
Unlock Deck
k this deck
6
OFFICIAL POVERTY LEVEL Although the poverty rate among single mothers has decreased since 1960, the number of poor children from such families has more than doubled. Explain.
Unlock Deck
Unlock for access to all 14 flashcards in this deck.
Unlock Deck
k this deck
7
INCOME DIFFERENCES List some reasons why household incomes differ. Which factors are the most important?
Unlock Deck
Unlock for access to all 14 flashcards in this deck.
Unlock Deck
k this deck
8
OFFICIAL POVERTY LEVEL How does the U.S. Department of Agriculture calculate the official poverty level? What government assistance programs does the Census Bureau consider when calculating household income? What programs are ignored?
Unlock Deck
Unlock for access to all 14 flashcards in this deck.
Unlock Deck
k this deck
9
PROGRAMS TO HELP THE POOR Distinguish between social insurance programs and income assistance programs. Identify key examples of each.
Unlock Deck
Unlock for access to all 14 flashcards in this deck.
Unlock Deck
k this deck
10
POVERTY AND AGE Poverty among the elderly fell dramatically between 1959 and 1974 and has continued to decline. However, poverty among that portion of the U.S. population that is less than 18 years old is no lower today than in the 1970s. Why have the experiences of these two age groups differed?
Unlock Deck
Unlock for access to all 14 flashcards in this deck.
Unlock Deck
k this deck
11
POVERTY AND PUBLIC CHOICE Why is it difficult to pass legislation to reduce the growth in Social Security or Medicare benefits?
Unlock Deck
Unlock for access to all 14 flashcards in this deck.
Unlock Deck
k this deck
12
POVERTY AND DISCRIMINATION Which types of discrimination may cause an earnings gap between white and black workers? Consider discrimination in schooling, for example. How would researchers detect racial discrimination in employment and in housing?
Unlock Deck
Unlock for access to all 14 flashcards in this deck.
Unlock Deck
k this deck
13
DISINCENTIVES How does the implicit tax on earned income (in the form of lost benefits from government assistance programs as earned income increases) affect work incentives? How do some people avoid the implicit tax?
Unlock Deck
Unlock for access to all 14 flashcards in this deck.
Unlock Deck
k this deck
14
WELFARE REFORM What has happened to the number of people on welfare since 1994? What best explains the change over time?
Unlock Deck
Unlock for access to all 14 flashcards in this deck.
Unlock Deck
k this deck
Unlock Deck
Unlock for access to all 14 flashcards in this deck.


