Deck 37: Exchange Rates and the Macroeconomy
Full screen (f)
Question
Question
Question
Question
Question
Question
Question
Question
Question
Question

Unlock Deck
Sign up to unlock the cards in this deck!
Unlock Deck
Unlock Deck
1/10
Play
Full screen (f)
Deck 37: Exchange Rates and the Macroeconomy
1
For years, the U.S. government has been trying to get Japan and the European Union to expand their economies faster. Explain how more rapid growth in Japan would affect the U.S. economy.
Impact of prosperity in Japan on U.S. economy
At the time of boom or prosperity in Japan, the citizens of the country will have more income and the country will have a higher GDP. This extra income is spent on the consumption of goods and services. Some of their consumption contains the exports from America.
Hence, it can be concluded that, when the economy of Japan grows faster, the U.S. economy would also grow faster.
Diagram for the impact on the U.S. economy when Japan grows faster
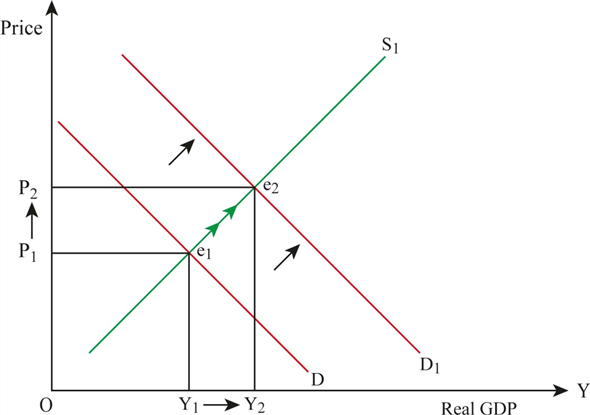
The following diagram shows the impact on the U.S. economy when Japan grows at a faster rate.
 In the above diagram, X axis represents real GDP and Y axis represents price level. D and
 represent the initial demand and initial supply curve, respectively. When there is a boom in the Japan economy, the exports from United States increases; this leads to an increase in the aggregate demand of United States. The increase in USA's aggregate demand shifts the demand curve rightward from D to
 . The new demand curve
 and initial supply curve
 intersect each other at point
 . At the new equilibrium level, real GDP of U.S. increases from
 to
to
 .
.
At the time of boom or prosperity in Japan, the citizens of the country will have more income and the country will have a higher GDP. This extra income is spent on the consumption of goods and services. Some of their consumption contains the exports from America.
Hence, it can be concluded that, when the economy of Japan grows faster, the U.S. economy would also grow faster.
Diagram for the impact on the U.S. economy when Japan grows faster
The following diagram shows the impact on the U.S. economy when Japan grows at a faster rate.
In the above diagram, X axis represents real GDP and Y axis represents price level. D and represent the initial demand and initial supply curve, respectively. When there is a boom in the Japan economy, the exports from United States increases; this leads to an increase in the aggregate demand of United States. The increase in USA's aggregate demand shifts the demand curve rightward from D to . The new demand curve and initial supply curve intersect each other at point . At the new equilibrium level, real GDP of U.S. increases from to . 2
Use an aggregate supply-demand diagram to analyze the effects of a currency appreciation.
Diagram for the impact of appreciation of currency
The following diagram shows the effects of appreciation of currency in an economy.
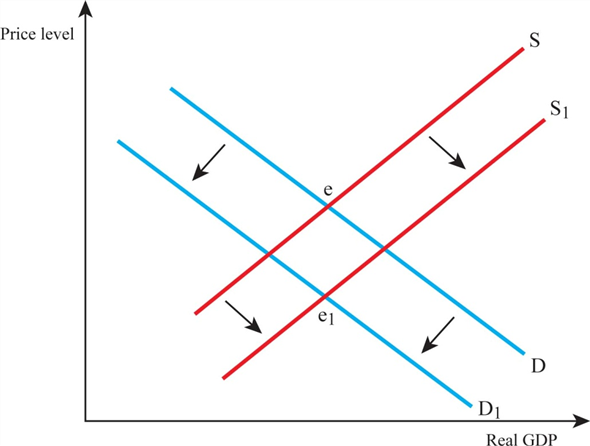 In the above diagram, X axis represents real GDP and Y axis represents the price level. The downward sloping curve (D) is a demand curve and upward sloping curve (S) is a supply curve. The intersection of demand curve and supply curve represents the equilibrium point. When the currency appreciates, net exports decrease and aggregate demand curve shifts leftward. At the same time, imports become cheaper, which leads to a downward shift in the aggregate supply curve. Hence, the price equilibrium level falls from e to e 1., thereby, reducing the price level and level of output.
The following diagram shows the effects of appreciation of currency in an economy.
In the above diagram, X axis represents real GDP and Y axis represents the price level. The downward sloping curve (D) is a demand curve and upward sloping curve (S) is a supply curve. The intersection of demand curve and supply curve represents the equilibrium point. When the currency appreciates, net exports decrease and aggregate demand curve shifts leftward. At the same time, imports become cheaper, which leads to a downward shift in the aggregate supply curve. Hence, the price equilibrium level falls from e to e 1., thereby, reducing the price level and level of output. 3
If inflation is lower in Germany than in Spain (as it is), and the exchange rate between the two countries is fixed (as it is, because of the monetary union), what is likely to happen to the balance of trade between the two countries
Trade balance of Spain and Germany
Lower rate of inflation in Germany compared to Spain means that prices of goods in Germany are comparatively lower than the prices of the commodities in Spain.
When the price of a commodity is low, the money value is high; higher money value increases the level of exports in Germany. When exports are higher than imports, the country faces trade balance surplus.
On the other hand, higher inflation rate in Spain shows that the price level of goods in Spain is higher. Higher price level reduces the money value. This decreases the level of exports and increases the level of imports. When imports are higher than exports, the country faces trade balance deficit.
Hence, it can be concluded that Germany faces trade balance surplus and Spain faces trade balance deficit.
4
Explain why X - IM = ( S - I ) - ( G - T ). Now multiply both sides of this equation by -1 to get
IM - X = ( I - S ) + ( G - T )
and remember that the trade deficit, IM - X , is the amount we have to borrow from foreigners to get Borrowing from foreigners = ( I - S ) + ( G - T )
Explain the common sense behind this version of the fundamental equation.
IM - X = ( I - S ) + ( G - T )
and remember that the trade deficit, IM - X , is the amount we have to borrow from foreigners to get Borrowing from foreigners = ( I - S ) + ( G - T )
Explain the common sense behind this version of the fundamental equation.
Unlock Deck
Unlock for access to all 10 flashcards in this deck.
Unlock Deck
k this deck
5
Explain why a currency depreciation leads to an improvement in a country's trade balance.
Unlock Deck
Unlock for access to all 10 flashcards in this deck.
Unlock Deck
k this deck
6
(More difficult) Suppose consumption and investment are described by the following:
C = 150 + 0.75 DI
I = 300 + 0.2 Y - 50 r
Here DI is disposable income, Y is GDP, and r , the interest rate, is measured in percentage points. (For example a 5 percent interest rate is r = 5.) Exports and imports are as follows:
X = 300
IM = 250 + 0.2 Y
Government purchases are G = 800, and taxes are 20 percent of income. The price level is fixed and the central bank uses its monetary policy to peg the interest rate at r = 8.
a. Find equilibrium GDP, the budget deficit or surplus, and the trade deficit or surplus.
b. Suppose the currency appreciates and, as a result, exports and imports change to
X = 250
IM = 0.2 Y
Now find equilibrium GDP, the budget deficit or surplus, and the trade deficit or surplus.
Unlock Deck
Unlock for access to all 10 flashcards in this deck.
Unlock Deck
k this deck
7
Explain why American fiscal policy is less powerful and American monetary policy is more powerful than indicated in the closed-economy model described earlier in this book.
Unlock Deck
Unlock for access to all 10 flashcards in this deck.
Unlock Deck
k this deck
8
Given what you now know, do you think it was a good idea for the United States to adopt a policy mix of tight money and large government budget deficits in the early 1980s Why or why not What were the benefits and costs of reversing that policy mix in the 1990s
Unlock Deck
Unlock for access to all 10 flashcards in this deck.
Unlock Deck
k this deck
9
In 2001, 2002, and 2003, Congress passed the series of tax cuts that President Bush had requested. What effect did this policy likely have on the U.S. trade deficit Why
Unlock Deck
Unlock for access to all 10 flashcards in this deck.
Unlock Deck
k this deck
10
In 2010 and 2011, the international value of the dollar fell. This development was viewed with alarm in Japan. Why
Unlock Deck
Unlock for access to all 10 flashcards in this deck.
Unlock Deck
k this deck
Unlock Deck
Unlock for access to all 10 flashcards in this deck.


