Deck 9: Finance, Saving and Investment
Full screen (f)
Question
Question
Question
Question
Question
Question
Question
Question
Question
Question
Question
Question
Question
Question
Question
Question
Question
Question
Question
Question
Question
Question
Question
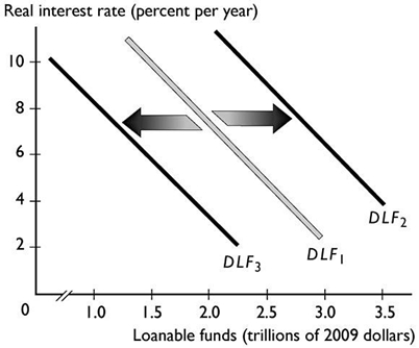
In the figure above, the rightward shift from the demand for loanable funds curve DLF₁ to the demand for loanable funds curve DLF₂, could be the result of
A) a rise in the interest rate.
B) a fall in the interest rate.
C) a decrease in expected profit.
D) an increase in expected profit.
E) an increase in wealth.
Question
Question
Question
Question
Question
Question
Question
Question
Question
Question
Question
Question
Question
In the figure above, the shift from DLF₁ to DLF₂ could result from
A) the economy entering a strong expansion.
B) the economy entering a recession.
C) a decrease in the real interest rate.
D) an increase in a government budget surplus.
E) an increase in the nominal interest rate.
Question
In the figure above, the leftward shift from the demand for loanable funds curve DLF₁ to the demand for loanable funds curve DLF₃, could be the result of
A) an increase in the population.
B) a rise in the interest rate.
C) a fall in the interest rate.
D) a decrease in expected profit.
E) an advancement in technology.
Question
Question
In the figure above, the leftward shift from the demand for loanable funds curve DLF₁ to the demand for loanable funds curve DLF₃, could be the result of
A) a government budget surplus.
B) the economy entering an expansion.
C) an increase in interest rates during an economic expansion.
D) the economy entering a recession.
E) a decrease in interest rates during an economic recession.
Question
Question
Question
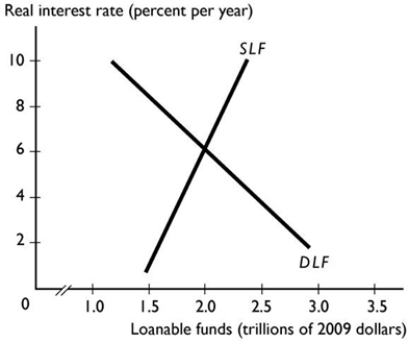
The figure above shows the loanable funds market. The equilibrium real interest rate is ________, and the equilibrium quantity of loanable funds is ________.
A) 6 per cent; $2.0 trillion
B) 4 per cent; $2.5 trillion
C) 8 per cent; $1.5 trillion
D) 4 per cent; $1.5 trillion
E) 0 per cent; $3.5 trillion
Question
Question
Question
The figure above shows the loanable funds market. At an interest rate of
A) 6 per cent, the quantity demanded of loanable funds equals $14 trillion.
B) 4 per cent, there is a surplus of loanable funds.
C) 4 per cent, the quantity supplied of loanable funds equals $18 trillion.
D) 8 per cent, there is a surplus of loanable funds.
E) 8 per cent, the quantity demanded of loanable funds exceeds the quantity supplied.
Question
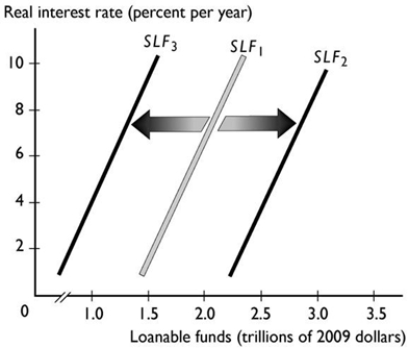
In the figure above, the shift in the supply of loanable funds curve from SLF1 to SLF2 could be the result of
A) an increase in wealth.
B) an increase in the expected rate of profit.
C) a decrease in default risk.
D) a decrease in disposable income.
E) an increase in the real interest rate.
Question
Question
Question
The figure above shows the loanable funds market. If the real interest rate is 8 per cent, then
A) savers will exit the market because of the high opportunity cost of saving.
B) the interest rate must increase.
C) the government must intervene in order to prevent a credit crisis.
D) there is a shortage in the loanable funds market.
E) there is a surplus in the loanable funds market.
Question
Question
Suppose that the initial supply of loanable funds curve is SLF1. In the figure above, an increase in the real interest rate leads to
i. a shift in the supply of loanable funds curve from SLF1 to SLF2.
ii. a shift in the supply of loanable funds curve from SLF1 to SLF3.
iii. a movement along the supply of loanable funds curve SLF1.
iv. no change whatsoever.
A) i only
B) ii only
C) iii only
D) i and iii
E) iv only
Question
Question
Question
The figure above shows the loanable funds market. If the real interest rate is 3 per cent, then
A) there is a shortage in the loanable funds market
B) the demand for loanable funds curve will shift rightward.
C) there will be government intervention in the market to make sure there is no credit crisis.
D) there is a surplus in the loanable funds market.
E) there will be a leftward shift in the demand for loanable funds curve.
Question
Question
Question
The figure above shows the loanable funds market. At an interest rate of
A) 6 per cent, savers will exit the market because the return to saving is too low.
B) 8 per cent, the quantity of loanable funds supplied is $14 trillion.
C) 8 per cent, the quantity demanded of loanable funds is $18 trillion.
D) 4 per cent, there is a surplus of loanable funds.
E) 4 per cent, there is a shortage of loanable funds.
Question
In the figure above, the shift in the supply of loanable funds curve from SLF1 to SLF3 could be the result of
A) an increase in expected future disposable income.
B) an increase in the expected rate of profit.
C) an increase in the real interest rate.
D) an increase in disposable income.
E) a decrease in wealth.
Question
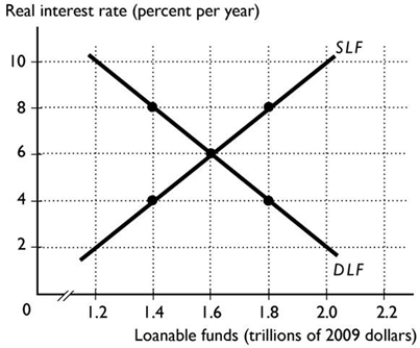
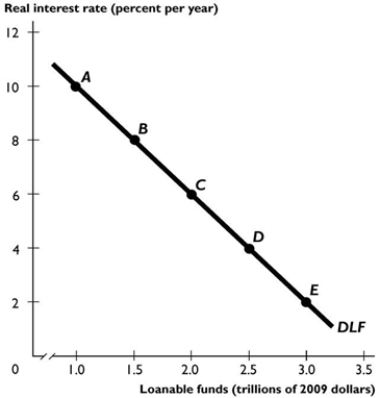 The figure above shows the demand for loanable funds curve.
In the figure above, a movement from point A to point C can be the result of
A) an increase in the government budget deficit.
B) a rise in the real interest rate.
C) an increase in expected profit.
D) a fall in the real interest rate.
E) a decrease in expected profit.
Question
Question
Question
Question
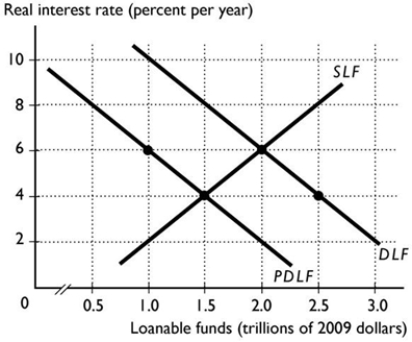
In the figure above, the DLF curve is the demand for loanable funds curve and the PDLF curve is the private demand for loanable funds curve. If there is no Ricardo-Barro effect, the figure shows a situation in which the government has a budget
A) surplus of $0.5 trillion.
B) surplus of $1 trillion.
C) deficit of $1 trillion.
D) deficit of $0.5 trillion.
E) deficit of $1.5 trillion.
Question
Question
Question
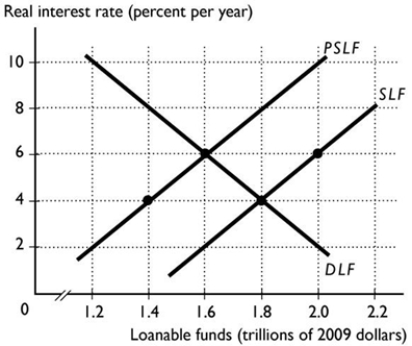
In the figure above, the SLF curve is the supply of loanable funds curve and the PSLF curve is the private supply of loanable funds curve. The equilibrium interest rate is ________ per cent and the equilibrium quantity of loanable funds is ________.
A) 6; $2.0 trillion
B) 4; $1.8 trillion
C) 4; $1.4 trillion
D) 6; $1.6 trillion
E) 4; $2.0 trillion
Question
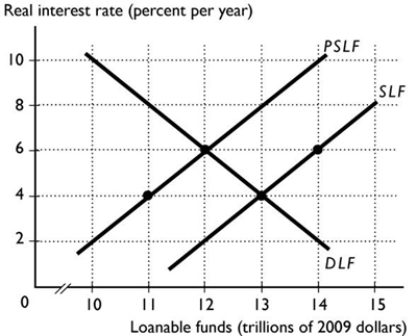
In the figure above, the SLF curve is the supply of loanable funds curve and the PSLF curve is the private supply of loanable funds curve. The equilibrium interest rate is ________ per cent and the equilibrium quantity of loanable funds is ________.
A) 6; $14 trillion
B) 4; $11 trillion
C) 4; $14 trillion
D) 6; $12 trillion
E) 4; $13 trillion
Question
In the figure above, the SLF curve is the supply of loanable funds curve and the PSLF curve is the private supply of loanable funds curve. If there is no Ricardo-Barro effect and the government now runs a balanced budget,
A) the equilibrium interest rate is 4 per cent and investment is $1.8 trillion.
B) the interest rate will increase from 4 per cent to 6 per cent.
C) the equilibrium interest rate is 6 per cent and investment is $1.6 trillion.
D) there is shortage of investment funds of $0.4 trillion.
E) there is a surplus of investment funds and the interest rate falls to 4 per cent.
Question
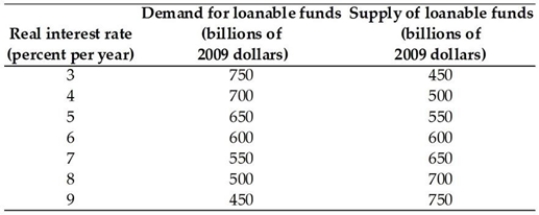
The above table has the private demand for loanable funds and the private supply of loanable funds schedules. If the government budget surplus is $200 billion, and there is no Ricardo-Barro effect, the equilibrium real interest rate is ________ and the equilibrium quantity of loanable funds is ________.
A) 6 per cent; $600 billion
B) 8 per cent; $700 billion
C) 4 per cent; $500 billion
D) 4 per cent; $700 billion
E) 8 per cent, $500 billion
Question
Question
Question
Question
Question
In the figure above, the DLF curve is the demand for loanable funds curve and the PDLF curve is the private demand for loanable funds curve. If there is no Ricardo-Barro effect, the figure shows the situation in which the government has a ________ so that the equilibrium real interest rate is ________ and the equilibrium quantity of investment is ________.
A) budget deficit; 4 per cent; $1 trillion
B) budget surplus; 6 per cent; $1.5 trillion
C) budget deficit; 6 per cent; $1.5 trillion
D) balanced budget; 6 per cent; $1.5 trillion
E) budget surplus; 4 per cent; $1 trillion
Question
The above table has the private demand for loanable funds and the private supply of loanable funds schedules. If the government budget deficit is $200 billion, and there is no Ricardo-Barro effect, the equilibrium real interest rate is ________ and the equilibrium quantity of investment is ________.
A) 8 per cent; $700 billion
B) 8 per cent, $500 billion
C) 6 per cent; $600 billion
D) 4 per cent; $700 billion
E) 4 per cent; $500 billion
Question
Question
In the figure above, if there is no Ricardo-Barro effect, the government has a budget ________ because the ________.
A) deficit of 0.4 trillion; SLF curve shows a smaller quantity of LF than the PSLF curve.
B) surplus of 0.2 trillion; SLF curve lies to the right of the PSLF curve.
C) deficit of 0.2 trillion; SLF curve lies to the right of the PSLF curve.
D) surplus of -0.2 trillion; SLF curve lies to the right of the PSLF curve.
E) surplus of 0.4 trillion; SLF curve shows a larger quantity of LF than the PSLF curve.
Question
Question
In the figure above, the SLF curve is the supply of loanable funds curve and the PSLF curve is the private supply of loanable funds curve. Given these curves, there is a government budget ________ and therefore the real interest rate is ________ than it would be otherwise.
A) deficit; lower
B) deficit; higher
C) surplus; higher
D) deficit; no different
E) surplus; lower

Unlock Deck
Sign up to unlock the cards in this deck!
Unlock Deck
Unlock Deck
1/79
Play
Full screen (f)
Deck 9: Finance, Saving and Investment
1
A certificate of ownership and claim to part of a firm's profits is called
A) physical capital.
B) a bond.
C) depreciation.
D) a stock.
E) a certificate of deposit.
A) physical capital.
B) a bond.
C) depreciation.
D) a stock.
E) a certificate of deposit.
a stock.
2
A household increases its wealth by
A) decreasing its depreciation.
B) saving.
C) spending more on consumption goods.
D) making sure that its net investment exceeds its gross investment.
E) increasing its capital consumption.
A) decreasing its depreciation.
B) saving.
C) spending more on consumption goods.
D) making sure that its net investment exceeds its gross investment.
E) increasing its capital consumption.
saving.
3
Net investment equals
A) new capital plus old capital.
B) gross investment plus depreciation.
C) the amount of national wealth.
D) capital plus depreciation.
E) gross investment minus depreciation.
A) new capital plus old capital.
B) gross investment plus depreciation.
C) the amount of national wealth.
D) capital plus depreciation.
E) gross investment minus depreciation.
gross investment minus depreciation.
4
Bill's Lawn Service starts the year with 20 lawn mowers. During the year, 3 mowers break and are not worth fixing. Bill also expands his business and buys 10 more mowers. Bill's capital at the end of the year is ________ mowers.
A) 30
B) 33
C) 27
D) 10
E) 20
A) 30
B) 33
C) 27
D) 10
E) 20
Unlock Deck
Unlock for access to all 79 flashcards in this deck.
Unlock Deck
k this deck
5
Which of the following is correct?
A) Gross investment is the total spent on capital.
B) Net investment is the total spent on capital.
C) Gross investment equals net investment minus depreciation.
D) The change in the nation's capital stock over a year equals the amount of gross investment.
E) Net investment is the same as capital consumption.
Unlock Deck
Unlock for access to all 79 flashcards in this deck.
Unlock Deck
k this deck
6
The funds firms use to buy and operate physical capital are referred to as
A) physical capital.
B) financial capital.
C) human capital.
D) government capital.
E) business capital.
A) physical capital.
B) financial capital.
C) human capital.
D) government capital.
E) business capital.
Unlock Deck
Unlock for access to all 79 flashcards in this deck.
Unlock Deck
k this deck
7
A document that promises to pay specified sums of money on specified dates and is a debt to the issuer is called
A) net investment.
B) depreciation.
C) gross investment.
D) a stock.
E) a bond.
A) net investment.
B) depreciation.
C) gross investment.
D) a stock.
E) a bond.
Unlock Deck
Unlock for access to all 79 flashcards in this deck.
Unlock Deck
k this deck
8
On 1 January, Rick's Photo owned $50,000 of equipment. During the year, the value of the equipment fell by $10,000, plus Rick bought $25,000 in new equipment. Rick's company experienced ________ because ________.
A) net investment of $15,000; net investment equals gross investment minus depreciation
B) depreciation of $15,000; depreciation equals investment in new products minus loss in values
C) gross investment of $15,000; gross investment equals net investment minus depreciation
D) net investment of $15,000; net investment equals beginning-year financial capital minus depreciations and investment
E) gross investment of $40,000; gross investment equals net investment plus depreciation
Unlock Deck
Unlock for access to all 79 flashcards in this deck.
Unlock Deck
k this deck
9
A distinction between stocks and bonds is that
A) bonds must be held for a fixed number of years whereas stocks can be bought and sold at any time.
B) stocks represent ownership claims to the company and bonds do not.
C) although the return on a bond is determined by the forces of supply and demand, the return on a stock is set by the stock exchange.
D) bonds cannot be sold to anyone other than the company that issued it while stocks can be resold to anyone.
E) bonds can be traded many times in the bond market, while stocks are non-transferable.
Unlock Deck
Unlock for access to all 79 flashcards in this deck.
Unlock Deck
k this deck
10
The Allied Mining Company begins this year with capital equal to $250,000. During the year the firm depreciates $150,000 worth of its capital and ends the year with capital equal to $250,000. Which statement correctly summarises Allied Mining Company's investment?
A) Allied Moving Company made net investment of $150,000 during the year.
B) Allied Moving Company made no net investment during the year.
C) Allied Moving Company made no capital investment during the year.
D) Allied Moving Company made no gross investment during the year.
E) Allied Moving Company made gross investment of $250,000 during the year.
Unlock Deck
Unlock for access to all 79 flashcards in this deck.
Unlock Deck
k this deck
11
Which of the following are typically financed in the loan market?
i. A mortgage for a house
iii. Credit card balances
iii. The purchase of shares in a corporation
A) i and ii
B) i, ii and iii
C) i only
D) i and iii
E) ii and iii
i. A mortgage for a house
iii. Credit card balances
iii. The purchase of shares in a corporation
A) i and ii
B) i, ii and iii
C) i only
D) i and iii
E) ii and iii
Unlock Deck
Unlock for access to all 79 flashcards in this deck.
Unlock Deck
k this deck
12
Lulu purchased a security that promises to pay $50 twice a year from January 15, 2015 to January 15, 2020 and then pay $1,000 on January 15, 2020. The security is a debt to the company that issued it. The security is a
A) net investment to the company that issued it.
B) bond.
C) physical capital.
D) share of stock.
E) depreciating asset.
A) net investment to the company that issued it.
B) bond.
C) physical capital.
D) share of stock.
E) depreciating asset.
Unlock Deck
Unlock for access to all 79 flashcards in this deck.
Unlock Deck
k this deck
13
________ decreases a firm's capital stock, and ________ increases its capital stock.
A) Saving; depreciation
B) Depreciation; investment
C) Time; depreciation
D) Saving; investment
E) Investment; saving
A) Saving; depreciation
B) Depreciation; investment
C) Time; depreciation
D) Saving; investment
E) Investment; saving
Unlock Deck
Unlock for access to all 79 flashcards in this deck.
Unlock Deck
k this deck
14
Wealth is to ________ as capital stock is to ________.
A) income; net investment
B) saving; depreciation
C) investment; saving
D) income; earnings
E) saving; investment
A) income; net investment
B) saving; depreciation
C) investment; saving
D) income; earnings
E) saving; investment
Unlock Deck
Unlock for access to all 79 flashcards in this deck.
Unlock Deck
k this deck
15
At the beginning of the year, AAA-1 Towing owns trucks and buildings of a total value of $1 million. During the year, it invests $250,000 to replace towing trucks worth $230,000 destroyed in a flood and to cover $50,000 worth of depreciation. AAA-1 Towing's capital stock at the end of the year was
A) $1,020,000.
B) $1,250,000.
C) $1,280,000.
D) $950,000.
E) $970,000.
A) $1,020,000.
B) $1,250,000.
C) $1,280,000.
D) $950,000.
E) $970,000.
Unlock Deck
Unlock for access to all 79 flashcards in this deck.
Unlock Deck
k this deck
16
During the year a country's income was $6.0 trillion and its consumption was $5.5 trillion. At the start of the year its wealth was $30.0 trillion. The country's wealth at the end of the year is
A) $36.0 trillion.
B) $30.0 trillion.
C) $35.5 trillion.
D) $30.5 trillion.
E) $6.0 trillion.
A) $36.0 trillion.
B) $30.0 trillion.
C) $35.5 trillion.
D) $30.5 trillion.
E) $6.0 trillion.
Unlock Deck
Unlock for access to all 79 flashcards in this deck.
Unlock Deck
k this deck
17
The distinction between physical and financial capital is that
A) financial capital is used to purchase and operate physical capital.
B) physical capital is equal to financial capital plus depreciation.
C) physical capital is equal to financial capital minus depreciation.
D) the value of financial capital depends on the amount of available physical capital.
E) financial capital depreciates and physical capital does not.
Unlock Deck
Unlock for access to all 79 flashcards in this deck.
Unlock Deck
k this deck
18
If an economy's depreciation is greater than its gross investment, then
A) net investment is negative and saving is negative.
B) net investment is positive and saving is negative.
C) net investment must equal saving.
D) net investment is positive and saving is positive.
E) the economy's capital stock decreases.
A) net investment is negative and saving is negative.
B) net investment is positive and saving is negative.
C) net investment must equal saving.
D) net investment is positive and saving is positive.
E) the economy's capital stock decreases.
Unlock Deck
Unlock for access to all 79 flashcards in this deck.
Unlock Deck
k this deck
19
During the year, suppose a country's total purchases of newly produced capital goods are $2,000 million, it issues $1,600 million of stock certificates, and has $500 million in depreciation. Gross investment in this country equals
A) $2,500 million.
B) $2,000 million.
C) $3,600 million.
D) $4,100 million.
E) $2,100 million.
A) $2,500 million.
B) $2,000 million.
C) $3,600 million.
D) $4,100 million.
E) $2,100 million.
Unlock Deck
Unlock for access to all 79 flashcards in this deck.
Unlock Deck
k this deck
20
During this year, Barbara earned $60,000 as a financial analyst, paid taxes of $5,000 and consumed $53,000. If Barbara's wealth was $4,000 at the beginning of the year, at the end of the year Barbara's wealth is
A) $2,000.
B) $5,000.
C) $4,000.
D) $60,000.
E) $6,000.
A) $2,000.
B) $5,000.
C) $4,000.
D) $60,000.
E) $6,000.
Unlock Deck
Unlock for access to all 79 flashcards in this deck.
Unlock Deck
k this deck
21
The demand for loanable funds includes demand for
i. loans.
ii. stocks.
iii. bonds.
A) i and ii
B) i only
C) i, ii and iii
D) ii and iii
E) iii only
i. loans.
ii. stocks.
iii. bonds.
A) i and ii
B) i only
C) i, ii and iii
D) ii and iii
E) iii only
Unlock Deck
Unlock for access to all 79 flashcards in this deck.
Unlock Deck
k this deck
22
The demand for loanable funds curve slopes downward because the
A) expected rate of profit is related positively to the real interest rate.
B) higher the real interest rate, the lower the cost of investment.
C) expected rate of profit is factor that "rewards" firms for their investment.
D) real interest rate is the opportunity cost of investment.
E) price of bonds and stocks is not related to the real interest rate.
Unlock Deck
Unlock for access to all 79 flashcards in this deck.
Unlock Deck
k this deck
23
In the figure above, the rightward shift from the demand for loanable funds curve DLF₁ to the demand for loanable funds curve DLF₂, could be the result of
A) a rise in the interest rate.
B) a fall in the interest rate.
C) a decrease in expected profit.
D) an increase in expected profit.
E) an increase in wealth.
Unlock Deck
Unlock for access to all 79 flashcards in this deck.
Unlock Deck
k this deck
24
If the market value of what it has lent is less than the market value of what it has borrowed, a financial institution's net worth is ________ and it is ________.
A) negative; illiquid and insolvent
B) negative; insolvent but not necessarily illiquid
C) positive; illiquid and insolvent
D) positive; insolvent but not necessarily illiquid
E) negative; illiquid but not necessarily insolvent
A) negative; illiquid and insolvent
B) negative; insolvent but not necessarily illiquid
C) positive; illiquid and insolvent
D) positive; insolvent but not necessarily illiquid
E) negative; illiquid but not necessarily insolvent
Unlock Deck
Unlock for access to all 79 flashcards in this deck.
Unlock Deck
k this deck
25
The quantity of loanable funds demanded increases if the real interest rate falls, all other things remaining the same, because the real interest rate
A) affects the supply of saving which, in turn, determines the quantity of investment.
B) affects the quantity of saving supplied.
C) is not related to the price of bonds and stocks.
D) is the opportunity cost of investment.
E) determines the cost of living.
A) affects the supply of saving which, in turn, determines the quantity of investment.
B) affects the quantity of saving supplied.
C) is not related to the price of bonds and stocks.
D) is the opportunity cost of investment.
E) determines the cost of living.
Unlock Deck
Unlock for access to all 79 flashcards in this deck.
Unlock Deck
k this deck
26
In a business cycle recession, which of the following occurs?
A) The quantity of investment demanded increases and there is a movement down along the demand for loanable funds curve but no shift in the curve.
B) The quantity of investment demanded decreases and there is a rightward shift of the demand for loanable funds curve.
C) The quantity of investment demanded decreases and there is a movement up along the demand for loanable funds curve but no shift in the curve.
D) Investment demand increases and the demand for loanable funds curve shifts rightward.
E) Investment demand decreases and the demand for loanable funds curve shifts leftward.
Unlock Deck
Unlock for access to all 79 flashcards in this deck.
Unlock Deck
k this deck
27
A Wesfarmers bond is $100 and entitles the owner to receive $2 per year, giving an interest rate of 2 per cent. If the price of the bond falls to $50 what happens to the interest rate?
A) It rises to 8 per cent.
B) It falls to 1 per cent.
C) It falls to 0.4 per cent.
D) It stays the same.
E) It rises to 4 per cent.
A) It rises to 8 per cent.
B) It falls to 1 per cent.
C) It falls to 0.4 per cent.
D) It stays the same.
E) It rises to 4 per cent.
Unlock Deck
Unlock for access to all 79 flashcards in this deck.
Unlock Deck
k this deck
28
If the price of a bond increases the interest rate on the bond will
A) fall.
B) stay the same.
C) rise.
D) It is not relevant as the interest on bonds is pre-determined.
E) None of the above.
A) fall.
B) stay the same.
C) rise.
D) It is not relevant as the interest on bonds is pre-determined.
E) None of the above.
Unlock Deck
Unlock for access to all 79 flashcards in this deck.
Unlock Deck
k this deck
29
A financial institution is insolvent if
A) net worth is positive.
B) net investment is positive.
C) net investment is negative.
D) net worth is negative.
E) None of the above.
A) net worth is positive.
B) net investment is positive.
C) net investment is negative.
D) net worth is negative.
E) None of the above.
Unlock Deck
Unlock for access to all 79 flashcards in this deck.
Unlock Deck
k this deck
30
Tech Corp is considering purchasing a new technology that will increase productivity by twenty per cent. If Tech Corp decides to make this investment at the going real interest rate, then
A) the demand for loanable funds increases.
B) the supply of loanable funds increases.
C) the quantity of loanable funds demanded increases.
D) saving increases.
E) Tech Corp's profits will decline.
A) the demand for loanable funds increases.
B) the supply of loanable funds increases.
C) the quantity of loanable funds demanded increases.
D) saving increases.
E) Tech Corp's profits will decline.
Unlock Deck
Unlock for access to all 79 flashcards in this deck.
Unlock Deck
k this deck
31
A financial institution
A) is a firm that lends only to governments.
B) is a firm that issues shares in companies.
C) is a firm that borrows from governments
D) is a firm that borrows in one market and lends in another.
E) None of the above
A) is a firm that lends only to governments.
B) is a firm that issues shares in companies.
C) is a firm that borrows from governments
D) is a firm that borrows in one market and lends in another.
E) None of the above
Unlock Deck
Unlock for access to all 79 flashcards in this deck.
Unlock Deck
k this deck
32
Suppose the real interest rate increases from 4 per cent to 6 per cent. As a result,
A) firms increase their demand for loanable funds.
B) governments decrease their demand for loanable funds.
C) firms decrease the quantity demanded of loanable funds.
D) governments decrease the quantity supplied of loanable funds.
E) governments increase the supply of loanable funds.
A) firms increase their demand for loanable funds.
B) governments decrease their demand for loanable funds.
C) firms decrease the quantity demanded of loanable funds.
D) governments decrease the quantity supplied of loanable funds.
E) governments increase the supply of loanable funds.
Unlock Deck
Unlock for access to all 79 flashcards in this deck.
Unlock Deck
k this deck
33
If a firm wants to borrow $10 million and the real interest rate increases from 5 per cent to 6 per cent, then the cost of the investment has increased by
A) $6 million per year.
B) $600,000 per year.
C) $100,000 per year.
D) $1 million per year.
E) nothing because the real interest rate is the return the firm will earn on its investment.
A) $6 million per year.
B) $600,000 per year.
C) $100,000 per year.
D) $1 million per year.
E) nothing because the real interest rate is the return the firm will earn on its investment.
Unlock Deck
Unlock for access to all 79 flashcards in this deck.
Unlock Deck
k this deck
34
The opportunity cost of the financial resources used to finance the purchase of capital is
A) the quantity of investment demanded.
B) the supply of investment.
C) the real interest rate.
D) the price of the capital goods purchased.
E) capital investment.
A) the quantity of investment demanded.
B) the supply of investment.
C) the real interest rate.
D) the price of the capital goods purchased.
E) capital investment.
Unlock Deck
Unlock for access to all 79 flashcards in this deck.
Unlock Deck
k this deck
35
A financial institution's net worth is
A) the market value of net borrowing capacity.
B) the market value of what it has lent minus the market value of what it has borrowed.
C) its investments in other financial institutions and governments.
D) the market value of net borrowing less depreciation.
E) None of the above.
A) the market value of net borrowing capacity.
B) the market value of what it has lent minus the market value of what it has borrowed.
C) its investments in other financial institutions and governments.
D) the market value of net borrowing less depreciation.
E) None of the above.
Unlock Deck
Unlock for access to all 79 flashcards in this deck.
Unlock Deck
k this deck
36
In the figure above, the shift from DLF₁ to DLF₂ could result from
A) the economy entering a strong expansion.
B) the economy entering a recession.
C) a decrease in the real interest rate.
D) an increase in a government budget surplus.
E) an increase in the nominal interest rate.
Unlock Deck
Unlock for access to all 79 flashcards in this deck.
Unlock Deck
k this deck
37
In the figure above, the leftward shift from the demand for loanable funds curve DLF₁ to the demand for loanable funds curve DLF₃, could be the result of
A) an increase in the population.
B) a rise in the interest rate.
C) a fall in the interest rate.
D) a decrease in expected profit.
E) an advancement in technology.
Unlock Deck
Unlock for access to all 79 flashcards in this deck.
Unlock Deck
k this deck
38
Which of the following decreases the demand for loanable funds and shifts the demand for loanable funds curve leftward?
A) The real interest rate rises.
B) An economy experiences a rapid increase in population.
C) Technology that increases productivity is introduced.
D) Wealth decreases.
E) The economy experiences a recession.
A) The real interest rate rises.
B) An economy experiences a rapid increase in population.
C) Technology that increases productivity is introduced.
D) Wealth decreases.
E) The economy experiences a recession.
Unlock Deck
Unlock for access to all 79 flashcards in this deck.
Unlock Deck
k this deck
39
In the figure above, the leftward shift from the demand for loanable funds curve DLF₁ to the demand for loanable funds curve DLF₃, could be the result of
A) a government budget surplus.
B) the economy entering an expansion.
C) an increase in interest rates during an economic expansion.
D) the economy entering a recession.
E) a decrease in interest rates during an economic recession.
Unlock Deck
Unlock for access to all 79 flashcards in this deck.
Unlock Deck
k this deck
40
The demand for loanable funds curve shows the relationship between the quantity of loanable funds demanded and
A) depreciation.
B) the capital stock.
C) the real interest rate.
D) the expected rate of profit.
E) the price level.
A) depreciation.
B) the capital stock.
C) the real interest rate.
D) the expected rate of profit.
E) the price level.
Unlock Deck
Unlock for access to all 79 flashcards in this deck.
Unlock Deck
k this deck
41
In 2008 the fall in the value of the stock market decreased people's wealth. As a result of this change alone, the supply of loanable funds
A) did not change, and there was an upward movement along the supply of loanable funds curve.
B) did not change, and there was no movement along the supply of loanable funds curve.
C) did not change, and there was a downward movement along the supply of loanable funds curve.
D) increased.
E) decreased.
Unlock Deck
Unlock for access to all 79 flashcards in this deck.
Unlock Deck
k this deck
42
The figure above shows the loanable funds market. The equilibrium real interest rate is ________, and the equilibrium quantity of loanable funds is ________.
A) 6 per cent; $2.0 trillion
B) 4 per cent; $2.5 trillion
C) 8 per cent; $1.5 trillion
D) 4 per cent; $1.5 trillion
E) 0 per cent; $3.5 trillion
Unlock Deck
Unlock for access to all 79 flashcards in this deck.
Unlock Deck
k this deck
43
A decrease in people's disposable income
A) decreases saving.
B) increases saving.
C) increases saving and decreases consumption.
D) increases consumption.
E) increases investment demand.
A) decreases saving.
B) increases saving.
C) increases saving and decreases consumption.
D) increases consumption.
E) increases investment demand.
Unlock Deck
Unlock for access to all 79 flashcards in this deck.
Unlock Deck
k this deck
44
The real interest rate is ________ related to the supply of loanable funds because ________.
A) positively; the opportunity cost of consumption expenditure increases as the real interest rate rises
B) positively; people are motivated to increase their consumption expenditure as the real interest rate rises
C) negatively; the opportunity cost of consumption expenditure increases as the real interest rate rises
D) negatively; people are motivated to save more as the real interest rate rises
E) None of the above answers is correct.
Unlock Deck
Unlock for access to all 79 flashcards in this deck.
Unlock Deck
k this deck
45
The figure above shows the loanable funds market. At an interest rate of
A) 6 per cent, the quantity demanded of loanable funds equals $14 trillion.
B) 4 per cent, there is a surplus of loanable funds.
C) 4 per cent, the quantity supplied of loanable funds equals $18 trillion.
D) 8 per cent, there is a surplus of loanable funds.
E) 8 per cent, the quantity demanded of loanable funds exceeds the quantity supplied.
Unlock Deck
Unlock for access to all 79 flashcards in this deck.
Unlock Deck
k this deck
46
In the figure above, the shift in the supply of loanable funds curve from SLF1 to SLF2 could be the result of
A) an increase in wealth.
B) an increase in the expected rate of profit.
C) a decrease in default risk.
D) a decrease in disposable income.
E) an increase in the real interest rate.
Unlock Deck
Unlock for access to all 79 flashcards in this deck.
Unlock Deck
k this deck
47
When disposable income increases, saving will
A) decrease, and there is a movement downward along the supply of loanable funds curve.
B) decrease, and the supply of loanable funds curve shifts leftward.
C) increase, and the supply of loanable funds curve shifts rightward.
D) not change.
E) increase, and there is a movement upward along the supply of loanable funds curve.
Unlock Deck
Unlock for access to all 79 flashcards in this deck.
Unlock Deck
k this deck
48
If expected profit falls, the demand for loanable funds curve shifts ________, and the real interest rate ________.
A) leftward; falls
B) leftward; rises
C) leftward; does not change
D) rightward; falls
E) rightward; rises
A) leftward; falls
B) leftward; rises
C) leftward; does not change
D) rightward; falls
E) rightward; rises
Unlock Deck
Unlock for access to all 79 flashcards in this deck.
Unlock Deck
k this deck
49
The figure above shows the loanable funds market. If the real interest rate is 8 per cent, then
A) savers will exit the market because of the high opportunity cost of saving.
B) the interest rate must increase.
C) the government must intervene in order to prevent a credit crisis.
D) there is a shortage in the loanable funds market.
E) there is a surplus in the loanable funds market.
Unlock Deck
Unlock for access to all 79 flashcards in this deck.
Unlock Deck
k this deck
50
The quantity of loanable funds supplied increases if the real interest rate rises, all other things remaining the same, because the
A) real interest rate is the opportunity cost of saving.
B) real interest rate is the opportunity cost of consumption.
C) demand for investment increases when the real interest rate rises.
D) cost of living is determined by the real interest rate.
E) real interest rate is inversely related to the cost of buying on credit.
Unlock Deck
Unlock for access to all 79 flashcards in this deck.
Unlock Deck
k this deck
51
Suppose that the initial supply of loanable funds curve is SLF1. In the figure above, an increase in the real interest rate leads to
i. a shift in the supply of loanable funds curve from SLF1 to SLF2.
ii. a shift in the supply of loanable funds curve from SLF1 to SLF3.
iii. a movement along the supply of loanable funds curve SLF1.
iv. no change whatsoever.
A) i only
B) ii only
C) iii only
D) i and iii
E) iv only
Unlock Deck
Unlock for access to all 79 flashcards in this deck.
Unlock Deck
k this deck
52
A fall in the real interest rate brings a
A) movement up along the supply of loanable funds curve.
B) rightward shift of the demand for loanable funds curve.
C) leftward shift of the supply of loanable funds curve.
D) rightward shift of the supply of loanable funds curve.
E) movement down along the supply of loanable funds curve.
A) movement up along the supply of loanable funds curve.
B) rightward shift of the demand for loanable funds curve.
C) leftward shift of the supply of loanable funds curve.
D) rightward shift of the supply of loanable funds curve.
E) movement down along the supply of loanable funds curve.
Unlock Deck
Unlock for access to all 79 flashcards in this deck.
Unlock Deck
k this deck
53
Which of the following factors changes saving supply and hence shifts the supply of loanable funds curve?
i. Disposable income
ii. Default risk
iii. Expected profit
A) i only
B) ii only
C) iii only
D) i and ii
E) i, ii and iii
i. Disposable income
ii. Default risk
iii. Expected profit
A) i only
B) ii only
C) iii only
D) i and ii
E) i, ii and iii
Unlock Deck
Unlock for access to all 79 flashcards in this deck.
Unlock Deck
k this deck
54
The figure above shows the loanable funds market. If the real interest rate is 3 per cent, then
A) there is a shortage in the loanable funds market
B) the demand for loanable funds curve will shift rightward.
C) there will be government intervention in the market to make sure there is no credit crisis.
D) there is a surplus in the loanable funds market.
E) there will be a leftward shift in the demand for loanable funds curve.
Unlock Deck
Unlock for access to all 79 flashcards in this deck.
Unlock Deck
k this deck
55
The supply of loanable funds schedule shows that the
A) higher the real interest rate, the greater the opportunity cost of supplying loanable funds.
B) higher the real interest rate, the lower the profit from making new investment.
C) higher the real interest rate, the greater the quantity of loanable funds supplied.
D) lower the real interest rate, the greater the quantity of loanable funds supplied.
E) higher the real interest rate, the more the supply of loanable funds curve shifts rightward.
Unlock Deck
Unlock for access to all 79 flashcards in this deck.
Unlock Deck
k this deck
56
If a government has a budget deficit, it must
A) increase taxes.
B) decrease taxes.
C) decrease its expenditures.
D) lower the real interest rate.
E) borrow in the loanable funds market.
A) increase taxes.
B) decrease taxes.
C) decrease its expenditures.
D) lower the real interest rate.
E) borrow in the loanable funds market.
Unlock Deck
Unlock for access to all 79 flashcards in this deck.
Unlock Deck
k this deck
57
The figure above shows the loanable funds market. At an interest rate of
A) 6 per cent, savers will exit the market because the return to saving is too low.
B) 8 per cent, the quantity of loanable funds supplied is $14 trillion.
C) 8 per cent, the quantity demanded of loanable funds is $18 trillion.
D) 4 per cent, there is a surplus of loanable funds.
E) 4 per cent, there is a shortage of loanable funds.
Unlock Deck
Unlock for access to all 79 flashcards in this deck.
Unlock Deck
k this deck
58
In the figure above, the shift in the supply of loanable funds curve from SLF1 to SLF3 could be the result of
A) an increase in expected future disposable income.
B) an increase in the expected rate of profit.
C) an increase in the real interest rate.
D) an increase in disposable income.
E) a decrease in wealth.
Unlock Deck
Unlock for access to all 79 flashcards in this deck.
Unlock Deck
k this deck
59
The figure above shows the demand for loanable funds curve.In the figure above, a movement from point A to point C can be the result of
A) an increase in the government budget deficit.
B) a rise in the real interest rate.
C) an increase in expected profit.
D) a fall in the real interest rate.
E) a decrease in expected profit.
Unlock Deck
Unlock for access to all 79 flashcards in this deck.
Unlock Deck
k this deck
60
The supply of loanable funds curve has a positive slope because the
A) lower the real interest rate, the lower the return to saving.
B) quantity of investment increases when the real interest rate increases.
C) average return in the stock market is directly related to the real interest rate.
D) higher the real interest rate, the lower the return to saving.
E) lower the real interest rate, the higher the return to saving.
Unlock Deck
Unlock for access to all 79 flashcards in this deck.
Unlock Deck
k this deck
61
Since the financial crisis of 2008-09, expected profits have fallen, which has resulted in
A) the private demand for loanable funds decreasing.
B) the supply of loanable funds decreasing.
C) a surplus of loanable funds.
D) the supply of loanable funds increasing.
E) real interest rates increasing.
A) the private demand for loanable funds decreasing.
B) the supply of loanable funds decreasing.
C) a surplus of loanable funds.
D) the supply of loanable funds increasing.
E) real interest rates increasing.
Unlock Deck
Unlock for access to all 79 flashcards in this deck.
Unlock Deck
k this deck
62
Suppose the government has a budget deficit of $2 billion. If the Ricardo-Barro effect is correct, then how much crowding out of investment occurs?
A) Some crowding out occurs, but less than $2 billion.
B) No crowding out occurs because investment increases by $2 billion.
C) More than $2 billion.
D) Exactly equal to $2 billion dollars.
E) No crowding out occurs and investment does not change.
A) Some crowding out occurs, but less than $2 billion.
B) No crowding out occurs because investment increases by $2 billion.
C) More than $2 billion.
D) Exactly equal to $2 billion dollars.
E) No crowding out occurs and investment does not change.
Unlock Deck
Unlock for access to all 79 flashcards in this deck.
Unlock Deck
k this deck
63
In the figure above, the DLF curve is the demand for loanable funds curve and the PDLF curve is the private demand for loanable funds curve. If there is no Ricardo-Barro effect, the figure shows a situation in which the government has a budget
A) surplus of $0.5 trillion.
B) surplus of $1 trillion.
C) deficit of $1 trillion.
D) deficit of $0.5 trillion.
E) deficit of $1.5 trillion.
Unlock Deck
Unlock for access to all 79 flashcards in this deck.
Unlock Deck
k this deck
64
A country initially has an equilibrium real interest rate of 4 per cent and an equilibrium quantity of investment of $2 trillion. The government's budget deficit then increases. According to the crowding-out effect, the
A) demand for loanable funds curve shifts rightward, the real interest rate rises and investment decreases.
B) demand for loanable funds curve shifts rightward, the real interest rate falls and investment increases.
C) demand for loanable funds curve shifts leftward, the real interest rate falls and investment increases.
D) supply of loanable funds curve shifts rightward, the real interest rate rises and investment increases.
E) supply of loanable funds curve shifts leftward, the real interest rate falls and investment decreases.
Unlock Deck
Unlock for access to all 79 flashcards in this deck.
Unlock Deck
k this deck
65
The crowding-out effect implies that a government budget deficit ________ the demand for loanable funds and ________ equilibrium investment.
A) does not change; does not change
B) increases; decreases
C) increases; increases
D) decreases; decreases
E) decreases; increases
A) does not change; does not change
B) increases; decreases
C) increases; increases
D) decreases; decreases
E) decreases; increases
Unlock Deck
Unlock for access to all 79 flashcards in this deck.
Unlock Deck
k this deck
66
In the figure above, the SLF curve is the supply of loanable funds curve and the PSLF curve is the private supply of loanable funds curve. The equilibrium interest rate is ________ per cent and the equilibrium quantity of loanable funds is ________.
A) 6; $2.0 trillion
B) 4; $1.8 trillion
C) 4; $1.4 trillion
D) 6; $1.6 trillion
E) 4; $2.0 trillion
Unlock Deck
Unlock for access to all 79 flashcards in this deck.
Unlock Deck
k this deck
67
In the figure above, the SLF curve is the supply of loanable funds curve and the PSLF curve is the private supply of loanable funds curve. The equilibrium interest rate is ________ per cent and the equilibrium quantity of loanable funds is ________.
A) 6; $14 trillion
B) 4; $11 trillion
C) 4; $14 trillion
D) 6; $12 trillion
E) 4; $13 trillion
Unlock Deck
Unlock for access to all 79 flashcards in this deck.
Unlock Deck
k this deck
68
In the figure above, the SLF curve is the supply of loanable funds curve and the PSLF curve is the private supply of loanable funds curve. If there is no Ricardo-Barro effect and the government now runs a balanced budget,
A) the equilibrium interest rate is 4 per cent and investment is $1.8 trillion.
B) the interest rate will increase from 4 per cent to 6 per cent.
C) the equilibrium interest rate is 6 per cent and investment is $1.6 trillion.
D) there is shortage of investment funds of $0.4 trillion.
E) there is a surplus of investment funds and the interest rate falls to 4 per cent.
Unlock Deck
Unlock for access to all 79 flashcards in this deck.
Unlock Deck
k this deck
69
The above table has the private demand for loanable funds and the private supply of loanable funds schedules. If the government budget surplus is $200 billion, and there is no Ricardo-Barro effect, the equilibrium real interest rate is ________ and the equilibrium quantity of loanable funds is ________.
A) 6 per cent; $600 billion
B) 8 per cent; $700 billion
C) 4 per cent; $500 billion
D) 4 per cent; $700 billion
E) 8 per cent, $500 billion
Unlock Deck
Unlock for access to all 79 flashcards in this deck.
Unlock Deck
k this deck
70
The tendency for higher government budget deficits to decrease investment is called the
A) deficit effect.
B) Ricardo-Barro effect.
C) inflation effect.
D) crowding-out effect.
E) wealth effect.
A) deficit effect.
B) Ricardo-Barro effect.
C) inflation effect.
D) crowding-out effect.
E) wealth effect.
Unlock Deck
Unlock for access to all 79 flashcards in this deck.
Unlock Deck
k this deck
71
China's government runs a budget surplus. As a result,
A) saving will exceed investment.
B) the Ricardo-Barro effect predicts that the real interest rate will increase.
C) the quantity of loanable funds decreases.
D) interest rates should increase.
E) if there is no Ricardo-Barro effect, the supply of loanable funds curve lies to the right of the private supply of loanable funds curve.
Unlock Deck
Unlock for access to all 79 flashcards in this deck.
Unlock Deck
k this deck
72
According to the Ricardo-Barro effect, a government budget
A) surplus increases private saving supply.
B) deficit decreases private investment demand.
C) deficit increases private saving supply.
D) surplus decreases private investment demand.
E) deficit decreases private saving supply.
A) surplus increases private saving supply.
B) deficit decreases private investment demand.
C) deficit increases private saving supply.
D) surplus decreases private investment demand.
E) deficit decreases private saving supply.
Unlock Deck
Unlock for access to all 79 flashcards in this deck.
Unlock Deck
k this deck
73
If there is no Ricardo-Barro effect, an increase in the government budget surplus
A) increases the supply of loanable funds.
B) increases private saving.
C) decreases the supply of loanable funds.
D) decreases private saving.
E) has no effect on the demand for loanable funds, the supply of loanable funds, or the real interest rate.
A) increases the supply of loanable funds.
B) increases private saving.
C) decreases the supply of loanable funds.
D) decreases private saving.
E) has no effect on the demand for loanable funds, the supply of loanable funds, or the real interest rate.
Unlock Deck
Unlock for access to all 79 flashcards in this deck.
Unlock Deck
k this deck
74
In the figure above, the DLF curve is the demand for loanable funds curve and the PDLF curve is the private demand for loanable funds curve. If there is no Ricardo-Barro effect, the figure shows the situation in which the government has a ________ so that the equilibrium real interest rate is ________ and the equilibrium quantity of investment is ________.
A) budget deficit; 4 per cent; $1 trillion
B) budget surplus; 6 per cent; $1.5 trillion
C) budget deficit; 6 per cent; $1.5 trillion
D) balanced budget; 6 per cent; $1.5 trillion
E) budget surplus; 4 per cent; $1 trillion
Unlock Deck
Unlock for access to all 79 flashcards in this deck.
Unlock Deck
k this deck
75
The above table has the private demand for loanable funds and the private supply of loanable funds schedules. If the government budget deficit is $200 billion, and there is no Ricardo-Barro effect, the equilibrium real interest rate is ________ and the equilibrium quantity of investment is ________.
A) 8 per cent; $700 billion
B) 8 per cent, $500 billion
C) 6 per cent; $600 billion
D) 4 per cent; $700 billion
E) 4 per cent; $500 billion
Unlock Deck
Unlock for access to all 79 flashcards in this deck.
Unlock Deck
k this deck
76
With no Ricardo-Barro effect, a government budget surplus
A) increases the demand for loanable funds and raises the real interest rate.
B) increases the supply of loanable funds and lowers the real interest rate.
C) decreases the demand for loanable funds and increases the real interest rate.
D) increases the demand for loanable funds and lowers the real interest rate.
E) decreases the supply of loanable funds and lowers the real interest rate.
Unlock Deck
Unlock for access to all 79 flashcards in this deck.
Unlock Deck
k this deck
77
In the figure above, if there is no Ricardo-Barro effect, the government has a budget ________ because the ________.
A) deficit of 0.4 trillion; SLF curve shows a smaller quantity of LF than the PSLF curve.
B) surplus of 0.2 trillion; SLF curve lies to the right of the PSLF curve.
C) deficit of 0.2 trillion; SLF curve lies to the right of the PSLF curve.
D) surplus of -0.2 trillion; SLF curve lies to the right of the PSLF curve.
E) surplus of 0.4 trillion; SLF curve shows a larger quantity of LF than the PSLF curve.
Unlock Deck
Unlock for access to all 79 flashcards in this deck.
Unlock Deck
k this deck
78
The Ricardo-Barro effect argues that the crowding-out effect
A) is stronger when the government runs a budget surplus than when it runs a budget deficit.
B) is the result of a government budget surplus and higher interest rates.
C) is the result of the government budget deficit and higher interest rates.
D) will occur, because the private saving supply will change to offset any change in the government budget deficit.
E) will not occur, because the private saving supply will change to offset any change in the government budget deficit.
Unlock Deck
Unlock for access to all 79 flashcards in this deck.
Unlock Deck
k this deck
79
In the figure above, the SLF curve is the supply of loanable funds curve and the PSLF curve is the private supply of loanable funds curve. Given these curves, there is a government budget ________ and therefore the real interest rate is ________ than it would be otherwise.
A) deficit; lower
B) deficit; higher
C) surplus; higher
D) deficit; no different
E) surplus; lower
Unlock Deck
Unlock for access to all 79 flashcards in this deck.
Unlock Deck
k this deck
Unlock Deck
Unlock for access to all 79 flashcards in this deck.


