Deck 13: Statistical Process Control
Full screen (f)
Question
If all sample averages on an  -chart fall within the control limits,all output will be conforming.
-chart fall within the control limits,all output will be conforming. Question
Question
Question
Question
Question
Question
Question
Question
Question
Question
Question
Question
Question
Question
Question
Question
Question
Process capability indices cannot be computed from data in an  -chart.
-chart. Question
The assumption of normality of observations is more critical fo  -charts than for x-charts.
-charts than for x-charts. Question
Question
Question
Question
Question
Question
Question
Question
Question
Question
Question
Question
Question
Question
Question
Question
Question
Question
Question
Question
Question
The _____ is used to monitor the centering of the process.
A) -chart
B) R-chart
C) p-chart
D) np-chart
A)
-chartB) R-chart
C) p-chart
D) np-chart
Question
Five samples of size 3 were collected for a variable measurement.All sample data were greater than or equal to 4.0.The sample means and sample ranges are provided in the following table.

The values of which sample are identical?
A)sample 1
B)sample 2
C)sample 3
D)sample 4
The values of which sample are identical?
A)sample 1
B)sample 2
C)sample 3
D)sample 4
Question
Question
Question
A delivery company defines a "defect" as a package delivered later than the promised delivery time.Management wants to monitor the proportion of packages per week delivered beyond their promised delivery time.Management plans to sample 150 packages per week.The appropriate control chart is a(n):
A) -chart.
B) R-chart.
C) p-chart.
D) np-chart.
A)
-chart.B) R-chart.
C) p-chart.
D) np-chart.
Question
A manager at a canning company wants to monitor the number of orange juice cans it produces each day that are beyond the upper specification limit for can diameter.Each day an employee will randomly select 150 cans and then determine and plot the number of cans that are beyond the upper specification limit for can diameter.The appropriate control chart is a(n):
A) -chart.
B) R-chart.
C) p-chart.
D) np-chart.
A)
-chart.B) R-chart.
C) p-chart.
D) np-chart.
Question
Question
Question
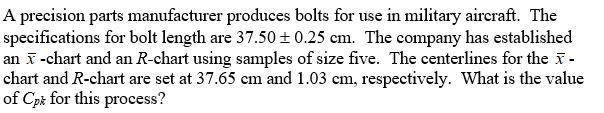
A) 0.08
B) 0.28
C) 0.75
D) 0.03
Question
Question
Question
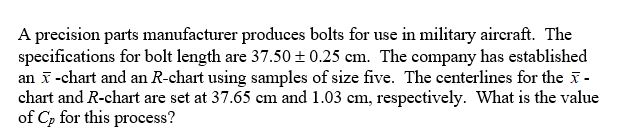
A) 0.188
B) 1.333
C) 0.301
D) 0.166
Question
Six samples of size 10 were collected.The data are provided in the following table.

The upper control limit (UCL)and lower control limit (LCL)for an s-chart are:
A)LCL = 0.2840, UCL = 1.7160
B)LCL = 0.0994, UCL = 0.6006
C)LCL = 4.6256, UCL = 5.3256
D)LCL = 3.6750, UCL = 5.7750
The upper control limit (UCL)and lower control limit (LCL)for an s-chart are:
A)LCL = 0.2840, UCL = 1.7160
B)LCL = 0.0994, UCL = 0.6006
C)LCL = 4.6256, UCL = 5.3256
D)LCL = 3.6750, UCL = 5.7750
Question
Question
A company wishes to monitor the variation in the length of time it takes to process and send a bill to a customer.Five bills will be randomly selected each day and the length of time it takes to process and send the bill to a customer will be recorded for each bill.The appropriate control chart is a(n):
A) -chart.
B) R-chart.
C) p-chart.
D) u-chart.
A)
-chart.B) R-chart.
C) p-chart.
D) u-chart.
Question
Question
Question
Which of the following pairs of charts are used together?
A) -chart and p-chart
B)R-chart and p-chart
C)R-chart and s-chart
D) -chart and R-chart
A)
-chart and p-chartB)R-chart and p-chart
C)R-chart and s-chart
D)
-chart and R-chart Question
Question
Each day,a manufacturing company producing circuit boards will randomly sample 60 circuit boards and then determine and plot the number of defects contained in each of these boards.The appropriate control chart is a:
A) -chart.
B) p-chart.
C) np-chart.
D) c-chart.
A)
-chart.B) p-chart.
C) np-chart.
D) c-chart.
Question
Question
An  -chart is used to monitor the process:
A)range.
B)median.
C)variance.
D)mean.
-chart is used to monitor the process:A)range.
B)median.
C)variance.
D)mean.
Question
Question
Question
Question
In an  -chart,the upper control limit is equal to the overall sample mean plus three times the:
A)process standard deviation.
B)average range.
C)standard error of the mean.
D)sample variance.
-chart,the upper control limit is equal to the overall sample mean plus three times the:A)process standard deviation.
B)average range.
C)standard error of the mean.
D)sample variance.
Question
Question
Question
Question
Question
Question
Question
The sample size for an x-chart:
A)should be greater than or equal to 30.
B)is larger than that for an -chart.
C)is equal to one.
D)depends on the number of measurements taken.
A)should be greater than or equal to 30.
B)is larger than that for an
-chart.C)is equal to one.
D)depends on the number of measurements taken.
Question
Because of high test costs,a single sample of wastewater sludge is tested daily for dissolved oxygen content.The appropriate control chart method is:
A) -chart and R-chart.
B)u-chart.
C)x-chart and moving range chart.
D)x-chart and R-chart.
A)
-chart and R-chart.B)u-chart.
C)x-chart and moving range chart.
D)x-chart and R-chart.
Question
To form rational sub-groups for an  -chart,the goal is to have the samples be as _____ as possible.
A)heterogeneous
B)homogeneous
C)large
D)equally spaced
-chart,the goal is to have the samples be as _____ as possible.A)heterogeneous
B)homogeneous
C)large
D)equally spaced
Question
Question
Question
Question
Question
The control chart most appropriate for plotting the daily percentage of students that wait longer than 5 minutes in line at the undergraduate admissions office is a(n):
A)p-chart.
B)np-chart.
C)x-chart.
D) -chart.
A)p-chart.
B)np-chart.
C)x-chart.
D)
-chart. Question
Which of the following is CORRECT regarding an x-chart?
A)Individual data require averaging before being plotted on it.
B)It is less sensitive to many conditions that can be detected by -chart and R-chart.
C)Specification limits cannot be drawn on the chart for direct comparison with the control limits.
D)The assumption of normality of observations is less critical than for -chart and R-charts.
A)Individual data require averaging before being plotted on it.
B)It is less sensitive to many conditions that can be detected by
-chart and R-chart.C)Specification limits cannot be drawn on the chart for direct comparison with the control limits.
D)The assumption of normality of observations is less critical than for
-chart and R-charts.
Unlock Deck
Sign up to unlock the cards in this deck!
Unlock Deck
Unlock Deck
1/100
Play
Full screen (f)
Deck 13: Statistical Process Control
1
If all sample averages on an -chart fall within the control limits,all output will be conforming.
-chart fall within the control limits,all output will be conforming.False
2
A histogram of data that resembles the normal distribution indicates that the process is in control.
False
3
If points on a control chart are determined to be the result of special causes,the points should be eliminated and new control limit values should be computed.
True
4
Control limits for variables and attribute data utilize the same mathematical formulas.
Unlock Deck
Unlock for access to all 100 flashcards in this deck.
Unlock Deck
k this deck
5
The most commonly applied control limits for variables data are 3-sigma control limits.
Unlock Deck
Unlock for access to all 100 flashcards in this deck.
Unlock Deck
k this deck
6
The centerline for the np-chart is equal to the average number of nonconforming items per sample.
Unlock Deck
Unlock for access to all 100 flashcards in this deck.
Unlock Deck
k this deck
7
A "hugging the centerline limit" pattern in a control chart can be the result of using two different lots of material in one process.
Unlock Deck
Unlock for access to all 100 flashcards in this deck.
Unlock Deck
k this deck
8
If all the points on a control chart are within the control limits,then the process is in statistical control.
Unlock Deck
Unlock for access to all 100 flashcards in this deck.
Unlock Deck
k this deck
9
For variables data,the necessary sample size can be estimated by specifying the desired minimum shift in the process mean to be detected.
Unlock Deck
Unlock for access to all 100 flashcards in this deck.
Unlock Deck
k this deck
10
Assignable causes are more difficult to identify in unstable processes.
Unlock Deck
Unlock for access to all 100 flashcards in this deck.
Unlock Deck
k this deck
11
Attribute control charts require larger sample sizes than variable control charts.
Unlock Deck
Unlock for access to all 100 flashcards in this deck.
Unlock Deck
k this deck
12
A p-chart is used with attribute data.
Unlock Deck
Unlock for access to all 100 flashcards in this deck.
Unlock Deck
k this deck
13
Common and special causes must be eliminated before process capability can be determined.
Unlock Deck
Unlock for access to all 100 flashcards in this deck.
Unlock Deck
k this deck
14
Variation in process output can occur as a result of chance or as a result of assignable causes.
Unlock Deck
Unlock for access to all 100 flashcards in this deck.
Unlock Deck
k this deck
15
Histograms allow you to distinguish between common and special causes of variation.
Unlock Deck
Unlock for access to all 100 flashcards in this deck.
Unlock Deck
k this deck
16
A c-chart is more appropriate than a u-chart if the nature of the process does not yield discrete measurable units of output.
Unlock Deck
Unlock for access to all 100 flashcards in this deck.
Unlock Deck
k this deck
17
If the cost of investigating the cause of an apparent out-of-control situation is high,narrower control limits should be adopted.
Unlock Deck
Unlock for access to all 100 flashcards in this deck.
Unlock Deck
k this deck
18
Process capability indices cannot be computed from data in an -chart.
-chart. Unlock Deck
Unlock for access to all 100 flashcards in this deck.
Unlock Deck
k this deck
19
The assumption of normality of observations is more critical fo -charts than for x-charts.
-charts than for x-charts. Unlock Deck
Unlock for access to all 100 flashcards in this deck.
Unlock Deck
k this deck
20
If the cost of a Type II error is low,narrower control limits should be selected.
Unlock Deck
Unlock for access to all 100 flashcards in this deck.
Unlock Deck
k this deck
21
Process capability calculations make little sense if the process:
A)data were taken over a period of time.
B)is not in statistical control.
C)variations are due to special causes.
D)has control but is not capable.
A)data were taken over a period of time.
B)is not in statistical control.
C)variations are due to special causes.
D)has control but is not capable.
Unlock Deck
Unlock for access to all 100 flashcards in this deck.
Unlock Deck
k this deck
22
For large samples,and when data are analyzed by computer programs,the _____ is a better measure of variability.
A)variation in control limits
B)tolerance variance
C)median range
D)standard deviation
A)variation in control limits
B)tolerance variance
C)median range
D)standard deviation
Unlock Deck
Unlock for access to all 100 flashcards in this deck.
Unlock Deck
k this deck
23
The acronym "SPC" stands for:
A)statistical probability charting.
B)statistical performance control.
C)statistical process control.
D)scientific problem solving.
A)statistical probability charting.
B)statistical performance control.
C)statistical process control.
D)scientific problem solving.
Unlock Deck
Unlock for access to all 100 flashcards in this deck.
Unlock Deck
k this deck
24
Collecting _____ data is usually easier than collecting _____ data because the assessment can usually be done more quickly by a simple inspection or count.
A)attribute; variable
B)concrete; continuous
C)random; discrete
D)simple; continuous
A)attribute; variable
B)concrete; continuous
C)random; discrete
D)simple; continuous
Unlock Deck
Unlock for access to all 100 flashcards in this deck.
Unlock Deck
k this deck
25
In determining whether a process is in statistical control,the _____ is/are generally analyzed first.
A)R-chart
B)control limits
C)average range
D)nonconformance
A)R-chart
B)control limits
C)average range
D)nonconformance
Unlock Deck
Unlock for access to all 100 flashcards in this deck.
Unlock Deck
k this deck
26
A process is deemed "out of control" when:
A)common causes are present.
B)special causes are present.
C)data varies around the mean.
D)random variation is present.
A)common causes are present.
B)special causes are present.
C)data varies around the mean.
D)random variation is present.
Unlock Deck
Unlock for access to all 100 flashcards in this deck.
Unlock Deck
k this deck
27
A(n)_____ is the result of some cause that gradually affects the quality characteristics of the product and causes the points on a control chart to gradually move up or down from the center line.
A)instability
B)process shift
C)cycle
D)trend
A)instability
B)process shift
C)cycle
D)trend
Unlock Deck
Unlock for access to all 100 flashcards in this deck.
Unlock Deck
k this deck
28
Control limits are often confused with _____.
A)control charts
B)tolerance limits
C)specification limits
D)variance limits
A)control charts
B)tolerance limits
C)specification limits
D)variance limits
Unlock Deck
Unlock for access to all 100 flashcards in this deck.
Unlock Deck
k this deck
29
Variable measurements are generally expressed as _____ and _____.
A)percentages; ratios
B)averages; standard deviations
C)median values; approximates
D)upper limits; lower limits
A)percentages; ratios
B)averages; standard deviations
C)median values; approximates
D)upper limits; lower limits
Unlock Deck
Unlock for access to all 100 flashcards in this deck.
Unlock Deck
k this deck
30
Control limits relate to _____,while specification limits relate to individual measurements.
A)values within the upper and lower control limits
B)total values in the range
C)median values
D)averages of samples
A)values within the upper and lower control limits
B)total values in the range
C)median values
D)averages of samples
Unlock Deck
Unlock for access to all 100 flashcards in this deck.
Unlock Deck
k this deck
31
Statistical process control relies on _____.
A)capability models
B)variance analyses
C)control charts
D)conformance reports
A)capability models
B)variance analyses
C)control charts
D)conformance reports
Unlock Deck
Unlock for access to all 100 flashcards in this deck.
Unlock Deck
k this deck
32
If the variation in the process is due to common causes alone,the process is said to be:
A)out of control.
B)in statistical control.
C)in controlled variance.
D)within capability.
A)out of control.
B)in statistical control.
C)in controlled variance.
D)within capability.
Unlock Deck
Unlock for access to all 100 flashcards in this deck.
Unlock Deck
k this deck
33
Variable data are _____.
A)discrete
B)discontinuous
C)random
D)continuous
A)discrete
B)discontinuous
C)random
D)continuous
Unlock Deck
Unlock for access to all 100 flashcards in this deck.
Unlock Deck
k this deck
34
In service applications,we generally use the term _____ to describe a nonconformance.
A)error
B)defect
C)mistake
D)concern
A)error
B)defect
C)mistake
D)concern
Unlock Deck
Unlock for access to all 100 flashcards in this deck.
Unlock Deck
k this deck
35
Which of the following is NOT one of the basic applications of a control chart?
A)To calculate the average-range.
B)To establish a state of statistical control.
C)To monitor a process and signal when the process goes out of control.
D)To determine process capability.
A)To calculate the average-range.
B)To establish a state of statistical control.
C)To monitor a process and signal when the process goes out of control.
D)To determine process capability.
Unlock Deck
Unlock for access to all 100 flashcards in this deck.
Unlock Deck
k this deck
36
Compared to variable inspection,attributes inspection requires _____ to obtain the same amount of statistical information about the quality of the product.
A)a more distributed population
B)a larger range of variance
C)a larger sample
D)a smaller sample
A)a more distributed population
B)a larger range of variance
C)a larger sample
D)a smaller sample
Unlock Deck
Unlock for access to all 100 flashcards in this deck.
Unlock Deck
k this deck
37
A _____ monitors the fraction of nonconforming items.
A)p-chart
B)x-chart
C)s-chart
D)c-chart
A)p-chart
B)x-chart
C)s-chart
D)c-chart
Unlock Deck
Unlock for access to all 100 flashcards in this deck.
Unlock Deck
k this deck
38
A(n)_____ is a performance characteristic that is either present or absent in the product or service under consideration.
A)variable
B)control limit
C)attribute
D)performance range
A)variable
B)control limit
C)attribute
D)performance range
Unlock Deck
Unlock for access to all 100 flashcards in this deck.
Unlock Deck
k this deck
39
If a unit of work has one or more nonconformances,we term the entire unit _____.
A)dysfunctional
B)out of variance
C)nonconforming
D)static
A)dysfunctional
B)out of variance
C)nonconforming
D)static
Unlock Deck
Unlock for access to all 100 flashcards in this deck.
Unlock Deck
k this deck
40
The _____ is used to monitor the centering of the process.
A) -chart
B) R-chart
C) p-chart
D) np-chart
A)
-chartB) R-chart
C) p-chart
D) np-chart
Unlock Deck
Unlock for access to all 100 flashcards in this deck.
Unlock Deck
k this deck
41
Five samples of size 3 were collected for a variable measurement.All sample data were greater than or equal to 4.0.The sample means and sample ranges are provided in the following table.
The values of which sample are identical?
A)sample 1
B)sample 2
C)sample 3
D)sample 4
The values of which sample are identical?
A)sample 1
B)sample 2
C)sample 3
D)sample 4
Unlock Deck
Unlock for access to all 100 flashcards in this deck.
Unlock Deck
k this deck
42
A p-chart is also called a:
A)pre-control chart.
B)probability chart.
C)fraction defective chart.
D)process capability chart.
A)pre-control chart.
B)probability chart.
C)fraction defective chart.
D)process capability chart.
Unlock Deck
Unlock for access to all 100 flashcards in this deck.
Unlock Deck
k this deck
43
Which of the following is NOT an indication of an out-of-control process?
A)Five consecutive points fall on one side of the center line.
B)Four of five consecutive points fall within the outer two-thirds region between the center line and one of the control limits.
C)Two of three consecutive points fall in the outer one-third region between the center line and one of the control limits.
D)A single point falls above the upper control limit.
Unlock Deck
Unlock for access to all 100 flashcards in this deck.
Unlock Deck
k this deck
44
A delivery company defines a "defect" as a package delivered later than the promised delivery time.Management wants to monitor the proportion of packages per week delivered beyond their promised delivery time.Management plans to sample 150 packages per week.The appropriate control chart is a(n):
A) -chart.
B) R-chart.
C) p-chart.
D) np-chart.
A)
-chart.B) R-chart.
C) p-chart.
D) np-chart.
Unlock Deck
Unlock for access to all 100 flashcards in this deck.
Unlock Deck
k this deck
45
A manager at a canning company wants to monitor the number of orange juice cans it produces each day that are beyond the upper specification limit for can diameter.Each day an employee will randomly select 150 cans and then determine and plot the number of cans that are beyond the upper specification limit for can diameter.The appropriate control chart is a(n):
A) -chart.
B) R-chart.
C) p-chart.
D) np-chart.
A)
-chart.B) R-chart.
C) p-chart.
D) np-chart.
Unlock Deck
Unlock for access to all 100 flashcards in this deck.
Unlock Deck
k this deck
46
The s-chart is recommended when:
A)the sample size equals one.
B)tight control of variability is required.
C)loose control of variability is acceptable.
D)the sample size needs to be reduced.
A)the sample size equals one.
B)tight control of variability is required.
C)loose control of variability is acceptable.
D)the sample size needs to be reduced.
Unlock Deck
Unlock for access to all 100 flashcards in this deck.
Unlock Deck
k this deck
47
If the process mean and variance do not change over time,the process is considered to be:
A)in control.
B)symmetric.
C)stable.
D)capable.
A)in control.
B)symmetric.
C)stable.
D)capable.
Unlock Deck
Unlock for access to all 100 flashcards in this deck.
Unlock Deck
k this deck
48
A) 0.08
B) 0.28
C) 0.75
D) 0.03
Unlock Deck
Unlock for access to all 100 flashcards in this deck.
Unlock Deck
k this deck
49
Which of the following is a likely cause of the control chart pattern known as a "trend?"
A)Aging equipment
B)Change in setup method
C)New operator
D)A mixture of two materials
A)Aging equipment
B)Change in setup method
C)New operator
D)A mixture of two materials
Unlock Deck
Unlock for access to all 100 flashcards in this deck.
Unlock Deck
k this deck
50
Determine the sample standard deviation for the following sample data: 7,9,2,0,1,and 5.
A)3.347
B)3.266
C)2.993
D)3.578
A)3.347
B)3.266
C)2.993
D)3.578
Unlock Deck
Unlock for access to all 100 flashcards in this deck.
Unlock Deck
k this deck
51
A) 0.188
B) 1.333
C) 0.301
D) 0.166
Unlock Deck
Unlock for access to all 100 flashcards in this deck.
Unlock Deck
k this deck
52
Six samples of size 10 were collected.The data are provided in the following table.
The upper control limit (UCL)and lower control limit (LCL)for an s-chart are:
A)LCL = 0.2840, UCL = 1.7160
B)LCL = 0.0994, UCL = 0.6006
C)LCL = 4.6256, UCL = 5.3256
D)LCL = 3.6750, UCL = 5.7750
The upper control limit (UCL)and lower control limit (LCL)for an s-chart are:
A)LCL = 0.2840, UCL = 1.7160
B)LCL = 0.0994, UCL = 0.6006
C)LCL = 4.6256, UCL = 5.3256
D)LCL = 3.6750, UCL = 5.7750
Unlock Deck
Unlock for access to all 100 flashcards in this deck.
Unlock Deck
k this deck
53
For variables data,the sample means are assumed to be:
A)uniformly distributed.
B)normally distributed.
C)Poisson distributed.
D)binomially distributed.
A)uniformly distributed.
B)normally distributed.
C)Poisson distributed.
D)binomially distributed.
Unlock Deck
Unlock for access to all 100 flashcards in this deck.
Unlock Deck
k this deck
54
A company wishes to monitor the variation in the length of time it takes to process and send a bill to a customer.Five bills will be randomly selected each day and the length of time it takes to process and send the bill to a customer will be recorded for each bill.The appropriate control chart is a(n):
A) -chart.
B) R-chart.
C) p-chart.
D) u-chart.
A)
-chart.B) R-chart.
C) p-chart.
D) u-chart.
Unlock Deck
Unlock for access to all 100 flashcards in this deck.
Unlock Deck
k this deck
55
The output of a process is stable and normally distributed.If the process mean equals 23.5,the percentage of output expected to be less than or equal to the mean:
A)is less than 25% .
B)is 50%.
C)is greater than 75%.
D)cannot be determined without knowing the standard deviation value.
A)is less than 25% .
B)is 50%.
C)is greater than 75%.
D)cannot be determined without knowing the standard deviation value.
Unlock Deck
Unlock for access to all 100 flashcards in this deck.
Unlock Deck
k this deck
56
Short repeated patterns in a control chart,with alternating high peaks and low valleys,are known as:
A)trends.
B)cycles.
C)spikes.
D)reciprocals.
A)trends.
B)cycles.
C)spikes.
D)reciprocals.
Unlock Deck
Unlock for access to all 100 flashcards in this deck.
Unlock Deck
k this deck
57
Which of the following pairs of charts are used together?
A) -chart and p-chart
B)R-chart and p-chart
C)R-chart and s-chart
D) -chart and R-chart
A)
-chart and p-chartB)R-chart and p-chart
C)R-chart and s-chart
D)
-chart and R-chart Unlock Deck
Unlock for access to all 100 flashcards in this deck.
Unlock Deck
k this deck
58
If a process is neither capable nor in control,the appropriate first step is to:
A)remove common causes.
B)redesign the equipment.
C)remove sources of special cause variation.
D)determine the process capability index.
A)remove common causes.
B)redesign the equipment.
C)remove sources of special cause variation.
D)determine the process capability index.
Unlock Deck
Unlock for access to all 100 flashcards in this deck.
Unlock Deck
k this deck
59
Each day,a manufacturing company producing circuit boards will randomly sample 60 circuit boards and then determine and plot the number of defects contained in each of these boards.The appropriate control chart is a:
A) -chart.
B) p-chart.
C) np-chart.
D) c-chart.
A)
-chart.B) p-chart.
C) np-chart.
D) c-chart.
Unlock Deck
Unlock for access to all 100 flashcards in this deck.
Unlock Deck
k this deck
60
An alternative to using the R-chart is the:
A)np-chart.
B)s-chart.
C)c-chart.
D)p-chart.
A)np-chart.
B)s-chart.
C)c-chart.
D)p-chart.
Unlock Deck
Unlock for access to all 100 flashcards in this deck.
Unlock Deck
k this deck
61
An -chart is used to monitor the process:
A)range.
B)median.
C)variance.
D)mean.
-chart is used to monitor the process:A)range.
B)median.
C)variance.
D)mean.
Unlock Deck
Unlock for access to all 100 flashcards in this deck.
Unlock Deck
k this deck
62
The control chart most appropriate for data that represent the average number of packing slip errors per package shipped each day is the:
A)np-chart.
B)u-chart.
C)p-chart.
D)x-chart.
A)np-chart.
B)u-chart.
C)p-chart.
D)x-chart.
Unlock Deck
Unlock for access to all 100 flashcards in this deck.
Unlock Deck
k this deck
63
Which of the following charts is used to monitor the total number of defects per unit when a constant subgroup size is employed?
A)s-chart
B)c-chart
C)p-chart
D)u-chart
A)s-chart
B)c-chart
C)p-chart
D)u-chart
Unlock Deck
Unlock for access to all 100 flashcards in this deck.
Unlock Deck
k this deck
64
c-charts are based on the _____ probability distribution.
A)normal
B)binomial
C)Poisson
D)uniform
A)normal
B)binomial
C)Poisson
D)uniform
Unlock Deck
Unlock for access to all 100 flashcards in this deck.
Unlock Deck
k this deck
65
In an -chart,the upper control limit is equal to the overall sample mean plus three times the:
A)process standard deviation.
B)average range.
C)standard error of the mean.
D)sample variance.
-chart,the upper control limit is equal to the overall sample mean plus three times the:A)process standard deviation.
B)average range.
C)standard error of the mean.
D)sample variance.
Unlock Deck
Unlock for access to all 100 flashcards in this deck.
Unlock Deck
k this deck
66
Fifteen samples,of size 100 were collected and a total of 96 nonconforming items were found.The 3-sigma upper control limit for a p-chart would be:
A)0.066.
B)0.083.
C)0.137.
D)0.254.
A)0.066.
B)0.083.
C)0.137.
D)0.254.
Unlock Deck
Unlock for access to all 100 flashcards in this deck.
Unlock Deck
k this deck
67
Twenty samples of size 6 were collected for a variable measurement.Determine the upper control limit (UCL)and lower control limit (LCL)for an R-chart if the sum of the sample ranges equals 88.0.
A)UCL = 8.8176, LCL = 0.0000
B)UCL = 9.3016, LCL = 0.3344
C)UCL = 13.2000, LCL = 0.0000
D)UCL = 29.3921, LCL = 0.0000
A)UCL = 8.8176, LCL = 0.0000
B)UCL = 9.3016, LCL = 0.3344
C)UCL = 13.2000, LCL = 0.0000
D)UCL = 29.3921, LCL = 0.0000
Unlock Deck
Unlock for access to all 100 flashcards in this deck.
Unlock Deck
k this deck
68
Which of the following is a major advantage of np-charts?
A)They can be used for variable sample sizes.
B)They are more accurate than p-charts.
C)They are easier to understand for production personnel.
D)The control limits are based on binomial distribution.
A)They can be used for variable sample sizes.
B)They are more accurate than p-charts.
C)They are easier to understand for production personnel.
D)The control limits are based on binomial distribution.
Unlock Deck
Unlock for access to all 100 flashcards in this deck.
Unlock Deck
k this deck
69
x-charts are used for:
A)averages of variables data.
B)individual attribute data.
C)individual variables data.
D)averages of attributes data.
A)averages of variables data.
B)individual attribute data.
C)individual variables data.
D)averages of attributes data.
Unlock Deck
Unlock for access to all 100 flashcards in this deck.
Unlock Deck
k this deck
70
For statistical process control,a good sampling method should always:
A)require frequent sampling.
B)minimize sampling cost.
C)maximize sample size.
D)use rational sub-groups.
A)require frequent sampling.
B)minimize sampling cost.
C)maximize sample size.
D)use rational sub-groups.
Unlock Deck
Unlock for access to all 100 flashcards in this deck.
Unlock Deck
k this deck
71
If the sample size in a p-chart increases from 100 to 120,the upper and lower control limits will:
A)move farther apart.
B)move closer together.
C)remain the same distance apart.
D)both shift upward.
A)move farther apart.
B)move closer together.
C)remain the same distance apart.
D)both shift upward.
Unlock Deck
Unlock for access to all 100 flashcards in this deck.
Unlock Deck
k this deck
72
The sample size for an x-chart:
A)should be greater than or equal to 30.
B)is larger than that for an -chart.
C)is equal to one.
D)depends on the number of measurements taken.
A)should be greater than or equal to 30.
B)is larger than that for an
-chart.C)is equal to one.
D)depends on the number of measurements taken.
Unlock Deck
Unlock for access to all 100 flashcards in this deck.
Unlock Deck
k this deck
73
Because of high test costs,a single sample of wastewater sludge is tested daily for dissolved oxygen content.The appropriate control chart method is:
A) -chart and R-chart.
B)u-chart.
C)x-chart and moving range chart.
D)x-chart and R-chart.
A)
-chart and R-chart.B)u-chart.
C)x-chart and moving range chart.
D)x-chart and R-chart.
Unlock Deck
Unlock for access to all 100 flashcards in this deck.
Unlock Deck
k this deck
74
To form rational sub-groups for an -chart,the goal is to have the samples be as _____ as possible.
A)heterogeneous
B)homogeneous
C)large
D)equally spaced
-chart,the goal is to have the samples be as _____ as possible.A)heterogeneous
B)homogeneous
C)large
D)equally spaced
Unlock Deck
Unlock for access to all 100 flashcards in this deck.
Unlock Deck
k this deck
75
In the application of control charts,as the sample size is increased:
A)Type I errors are reduced, and Type II errors are increased.
B)Type I errors are increased, and Type II errors are reduced.
C)both Type I and Type II errors are increased.
D)both Type I and Type II errors are reduced.
A)Type I errors are reduced, and Type II errors are increased.
B)Type I errors are increased, and Type II errors are reduced.
C)both Type I and Type II errors are increased.
D)both Type I and Type II errors are reduced.
Unlock Deck
Unlock for access to all 100 flashcards in this deck.
Unlock Deck
k this deck
76
If the lower limit for a p-chart computes to a number less than zero,this indicates:
A)that a calculation error has been made.
B)an out of control process.
C)an incorrect use of an attribute measure.
D)that the limit should be set at zero.
A)that a calculation error has been made.
B)an out of control process.
C)an incorrect use of an attribute measure.
D)that the limit should be set at zero.
Unlock Deck
Unlock for access to all 100 flashcards in this deck.
Unlock Deck
k this deck
77
Which of the following would be used to monitor the number of nonconforming items?
A)np-chart
B)p-chart
C)u-chart
D)n-chart
A)np-chart
B)p-chart
C)u-chart
D)n-chart
Unlock Deck
Unlock for access to all 100 flashcards in this deck.
Unlock Deck
k this deck
78
Which of the following charts is used to monitor the average number of defects per unit when subgroup sizes vary?
A)s-chart
B)c-chart
C)p-chart
D)u-chart
A)s-chart
B)c-chart
C)p-chart
D)u-chart
Unlock Deck
Unlock for access to all 100 flashcards in this deck.
Unlock Deck
k this deck
79
The control chart most appropriate for plotting the daily percentage of students that wait longer than 5 minutes in line at the undergraduate admissions office is a(n):
A)p-chart.
B)np-chart.
C)x-chart.
D) -chart.
A)p-chart.
B)np-chart.
C)x-chart.
D)
-chart. Unlock Deck
Unlock for access to all 100 flashcards in this deck.
Unlock Deck
k this deck
80
Which of the following is CORRECT regarding an x-chart?
A)Individual data require averaging before being plotted on it.
B)It is less sensitive to many conditions that can be detected by -chart and R-chart.
C)Specification limits cannot be drawn on the chart for direct comparison with the control limits.
D)The assumption of normality of observations is less critical than for -chart and R-charts.
A)Individual data require averaging before being plotted on it.
B)It is less sensitive to many conditions that can be detected by
-chart and R-chart.C)Specification limits cannot be drawn on the chart for direct comparison with the control limits.
D)The assumption of normality of observations is less critical than for
-chart and R-charts. Unlock Deck
Unlock for access to all 100 flashcards in this deck.
Unlock Deck
k this deck
Unlock Deck
Unlock for access to all 100 flashcards in this deck.


