Deck 5: Biomes and Biodiversity
Full screen (f)
Question
Question
Question
Question
Question
Question
Why are exotic or invasive species a threat to biodiversity? Give several examples of exotic invasive species (see fig. 5.26).
FIGURE 5.26: A few of the approximately 50,000 invasive species in North America. Do you recognize any that occur where you live? What others can you think of?
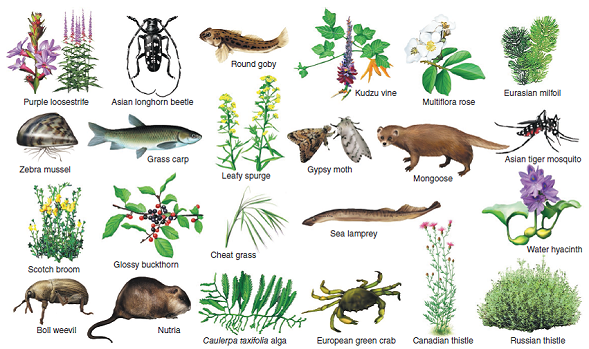
FIGURE 5.26: A few of the approximately 50,000 invasive species in North America. Do you recognize any that occur where you live? What others can you think of?
Question
Question
Question
Explain how climate graphs (as in fig. 5.6) should be read.
FIGURE 5.6: Moisture availability depends on temperature as well as precipitation. The horizontal axis on these climate diagrams shows months of the year; vertical axes show temperature ( left side ) and precipitation ( right ). The number of dry months (shaded yellow) and wetter months (blue) varies with geographic location. Yearly annual temperature (°C) and precipitation (mm) are shown at the top of each graph.
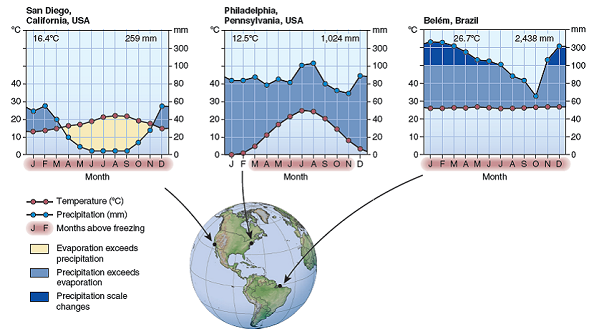
FIGURE 5.6: Moisture availability depends on temperature as well as precipitation. The horizontal axis on these climate diagrams shows months of the year; vertical axes show temperature ( left side ) and precipitation ( right ). The number of dry months (shaded yellow) and wetter months (blue) varies with geographic location. Yearly annual temperature (°C) and precipitation (mm) are shown at the top of each graph.
Question
Question
Question
Question
Question
Question
Question
Question
Figure 5.15 shows chlorophyll (plant growth) in oceans and on land. Explain why green, photosynthesizing organisms occur in bands at the equator and along the edges of continents. Explain the very dark green areas and yellow/orange areas on the continents.
FIGURE 5.15: Satellite measurements of chlorophyll levels in the oceans and on land. Dark green to blue land areas have high biological productivity. Dark blue oceans have little chlorophyll and are biologically impoverished. Light green to yellow ocean zones are biologically rich. SOURCE: SeaWiFS/NASA.
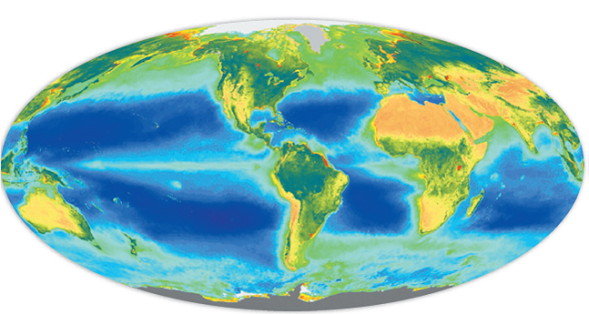
FIGURE 5.15: Satellite measurements of chlorophyll levels in the oceans and on land. Dark green to blue land areas have high biological productivity. Dark blue oceans have little chlorophyll and are biologically impoverished. Light green to yellow ocean zones are biologically rich. SOURCE: SeaWiFS/NASA.
Question
Question
What is a biodiversity hot spot? List several of them (see fig. 5.22).
FIGURE 5.22: Biodiversity "hot spots" identified by Conservation International tend to be in tropical or Mediterranean climates and on islands, coastlines, or mountains where many habitats exist and physical barriers encourage speciation. Numbers represent estimated endemic (locally unique) species in each area. SOURCE: Data from Conservation International.
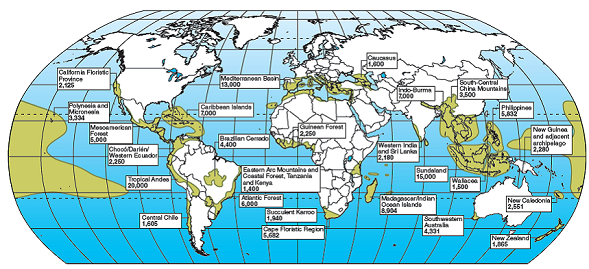
FIGURE 5.22: Biodiversity "hot spots" identified by Conservation International tend to be in tropical or Mediterranean climates and on islands, coastlines, or mountains where many habitats exist and physical barriers encourage speciation. Numbers represent estimated endemic (locally unique) species in each area. SOURCE: Data from Conservation International.
Question
Question

Unlock Deck
Sign up to unlock the cards in this deck!
Unlock Deck
Unlock Deck
1/21
Play
Full screen (f)
Deck 5: Biomes and Biodiversity
1
Why are scientists studying the effects of warming on boreal forests? How far might this forest biome move if climate projections are correct?
NO Answer
2
What does the acronym HIPPO refer to?
Life expectancy:
Explanation
The mean age of a newborn infant, which is expected to live in a society, is known as Life expectancy.
Life span:
The species of oldest age survived by the particular species is known as Life span.
Difference between life expectancy and life span includes the following:
1. Life expectancy is defined as an average age of newborn infant that is expected to attain in any society. In contrast, life span is defined as the oldest age to which a species is known to survive.
2. Life span includes maximum age possible by any person in a population, whereas life expectancy is the average age at death of everyone in a population.
3. Life expectancy in most societies probably has been 35 to 40 years, while the oldest age means Life span that can be certified by written records was 122 years.
3
Apply the principles you have learned in this chapter to discuss these questions with other students.
Genetic diversity, or diversity of genetic types, is believed to enhance stability in a population. Most agricultural crops are genetically very uniform. Why might the usual importance of genetic diversity not apply to food crops? Why might it apply?
Genetic diversity, or diversity of genetic types, is believed to enhance stability in a population. Most agricultural crops are genetically very uniform. Why might the usual importance of genetic diversity not apply to food crops? Why might it apply?
Extinction:
Extinction is a normal process of the elimination of a species from the natural world. Extinctions have occurred in the past, but human involvement has improved the extinction rate by senseless amounts.
During the evolutionary change, species die out and are replaced by other species. In a healthy ecosystem the velocity of extinction, looks to be about one species lost every decade. Over the past century, though, human effects on populations and ecosystems have accelerated that velocity, perhaps causing untold thousands of species, subspecies, and varieties to become extinct every year.
Extinctions are common in the past. Studies of the fossil record advice that more than 99 % different types of species that are existed in the past are faced exaction. Most of the ancient species are extended before the origin of human race.
4
Have extinctions occurred in the past? Is there anything unusual about current extinctions?
Unlock Deck
Unlock for access to all 21 flashcards in this deck.
Unlock Deck
k this deck
5
Describe nine major types of terrestrial biomes.
Unlock Deck
Unlock for access to all 21 flashcards in this deck.
Unlock Deck
k this deck
6
Why are exotic or invasive species a threat to biodiversity? Give several examples of exotic invasive species (see fig. 5.26).
FIGURE 5.26: A few of the approximately 50,000 invasive species in North America. Do you recognize any that occur where you live? What others can you think of?
FIGURE 5.26: A few of the approximately 50,000 invasive species in North America. Do you recognize any that occur where you live? What others can you think of?
Unlock Deck
Unlock for access to all 21 flashcards in this deck.
Unlock Deck
k this deck
7
Apply the principles you have learned in this chapter to discuss these questions with other students.
Scientists need to be cautious about their theories and assumptions. What arguments could you make for and against the statement that humans are causing extinctions unlike any in the history of the earth?
Scientists need to be cautious about their theories and assumptions. What arguments could you make for and against the statement that humans are causing extinctions unlike any in the history of the earth?
Unlock Deck
Unlock for access to all 21 flashcards in this deck.
Unlock Deck
k this deck
8
What does the Endangered Species Act do?
Unlock Deck
Unlock for access to all 21 flashcards in this deck.
Unlock Deck
k this deck
9
Explain how climate graphs (as in fig. 5.6) should be read.
FIGURE 5.6: Moisture availability depends on temperature as well as precipitation. The horizontal axis on these climate diagrams shows months of the year; vertical axes show temperature ( left side ) and precipitation ( right ). The number of dry months (shaded yellow) and wetter months (blue) varies with geographic location. Yearly annual temperature (°C) and precipitation (mm) are shown at the top of each graph.
FIGURE 5.6: Moisture availability depends on temperature as well as precipitation. The horizontal axis on these climate diagrams shows months of the year; vertical axes show temperature ( left side ) and precipitation ( right ). The number of dry months (shaded yellow) and wetter months (blue) varies with geographic location. Yearly annual temperature (°C) and precipitation (mm) are shown at the top of each graph.
Unlock Deck
Unlock for access to all 21 flashcards in this deck.
Unlock Deck
k this deck
10
Apply the principles you have learned in this chapter to discuss these questions with other students.
A conservation organization has hired you to lead efforts to reduce the loss of biodiversity in a tropical country. Which of the following problems would you focus on first, and why: habitat destruction and fragmentation, hunting and fishing activity, harvesting of wild species for commercial sale, or introduction of exotic organisms?
A conservation organization has hired you to lead efforts to reduce the loss of biodiversity in a tropical country. Which of the following problems would you focus on first, and why: habitat destruction and fragmentation, hunting and fishing activity, harvesting of wild species for commercial sale, or introduction of exotic organisms?
Unlock Deck
Unlock for access to all 21 flashcards in this deck.
Unlock Deck
k this deck
11
Describe conditions under which coral reefs, mangroves, estuaries, and tide pools occur.
Unlock Deck
Unlock for access to all 21 flashcards in this deck.
Unlock Deck
k this deck
12
Apply the principles you have learned in this chapter to discuss these questions with other students.
Many ecologists and resource scientists work for government agencies to study resources and resource management. Do these scientists serve the public best if they try to do pure science, or if they try to support the political positions of democratically elected representatives, who, after all, represent the positions of their constituents?
Many ecologists and resource scientists work for government agencies to study resources and resource management. Do these scientists serve the public best if they try to do pure science, or if they try to support the political positions of democratically elected representatives, who, after all, represent the positions of their constituents?
Unlock Deck
Unlock for access to all 21 flashcards in this deck.
Unlock Deck
k this deck
13
Throughout the central portion of North America is a large biome once dominated by grasses. Describe how physical conditions and other factors control this biome.
Unlock Deck
Unlock for access to all 21 flashcards in this deck.
Unlock Deck
k this deck
14
Apply the principles you have learned in this chapter to discuss these questions with other students.
You are a forest ecologist living and working in a logging community. An endangered salamander has recently been discovered in your area. What arguments would you make for and against adding the salamander to the official endangered species list?
You are a forest ecologist living and working in a logging community. An endangered salamander has recently been discovered in your area. What arguments would you make for and against adding the salamander to the official endangered species list?
Unlock Deck
Unlock for access to all 21 flashcards in this deck.
Unlock Deck
k this deck
15
Explain the difference between swamps, marshes, and bogs.
Unlock Deck
Unlock for access to all 21 flashcards in this deck.
Unlock Deck
k this deck
16
How do elevation (on mountains) and depth (in water) affect environmental conditions and life-forms?
Unlock Deck
Unlock for access to all 21 flashcards in this deck.
Unlock Deck
k this deck
17
Figure 5.15 shows chlorophyll (plant growth) in oceans and on land. Explain why green, photosynthesizing organisms occur in bands at the equator and along the edges of continents. Explain the very dark green areas and yellow/orange areas on the continents.
FIGURE 5.15: Satellite measurements of chlorophyll levels in the oceans and on land. Dark green to blue land areas have high biological productivity. Dark blue oceans have little chlorophyll and are biologically impoverished. Light green to yellow ocean zones are biologically rich. SOURCE: SeaWiFS/NASA.
FIGURE 5.15: Satellite measurements of chlorophyll levels in the oceans and on land. Dark green to blue land areas have high biological productivity. Dark blue oceans have little chlorophyll and are biologically impoverished. Light green to yellow ocean zones are biologically rich. SOURCE: SeaWiFS/NASA.
Unlock Deck
Unlock for access to all 21 flashcards in this deck.
Unlock Deck
k this deck
18
Define biodiversity , and give three types of biodiversity essential in preserving ecological systems and functions.
Unlock Deck
Unlock for access to all 21 flashcards in this deck.
Unlock Deck
k this deck
19
What is a biodiversity hot spot? List several of them (see fig. 5.22).
FIGURE 5.22: Biodiversity "hot spots" identified by Conservation International tend to be in tropical or Mediterranean climates and on islands, coastlines, or mountains where many habitats exist and physical barriers encourage speciation. Numbers represent estimated endemic (locally unique) species in each area. SOURCE: Data from Conservation International.
FIGURE 5.22: Biodiversity "hot spots" identified by Conservation International tend to be in tropical or Mediterranean climates and on islands, coastlines, or mountains where many habitats exist and physical barriers encourage speciation. Numbers represent estimated endemic (locally unique) species in each area. SOURCE: Data from Conservation International.
Unlock Deck
Unlock for access to all 21 flashcards in this deck.
Unlock Deck
k this deck
20
Apply the principles you have learned in this chapter to discuss these questions with other students.
Many poor tropical countries point out that a hectare of shrimp ponds can provide 1,000 times as much annual income as the same area in an intact mangrove forest. Debate this point with a friend or classmate. What are the arguments for and against saving mangroves?
Many poor tropical countries point out that a hectare of shrimp ponds can provide 1,000 times as much annual income as the same area in an intact mangrove forest. Debate this point with a friend or classmate. What are the arguments for and against saving mangroves?
Unlock Deck
Unlock for access to all 21 flashcards in this deck.
Unlock Deck
k this deck
21
How do humans benefit from biodiversity?
Unlock Deck
Unlock for access to all 21 flashcards in this deck.
Unlock Deck
k this deck
Unlock Deck
Unlock for access to all 21 flashcards in this deck.


