Deck 3: Retail Customers
Full screen (f)
Question
Sonic Drive-Ins: Surviving in Difficult Times
Shawnee, Oklahoma, in 1953 was the stage for the first Sonic Drive-In restaurant to be opened. By 2010 there are 3,500 Sonic Drive-Ins in the United States, operating at year-end 2011 in 43 states. However, Oklahoma and three bordering states (Texas, Kansas, Arkansas) have nearly half of the system-wide drive-ins and Texas itself over one-third). Sonic is primarily a franchise organization with roughly 87 percent of drive-ins operated by franchisees.
Sonic views itself as in the quick-serve restaurant industry where all items are made when ordered and can be highly customized with condiments. Sonic strives to establish a unique dining experience. This experience is built around personalized Carhop service where smiling carhops deliver a customer's order to their car. Customers can eat in their vehicles or also have the option of drive-thru service or patio dining. Sonic Drive-Ins are open all day; usually from 6 or 7 a.m. until 10 p.m. or a bit later. In 2011, 49 percent of sales occurred during lunchtime and dinnertime; 23 percent in the afternoon, 16 percent after dinner and 12 percent in the morning.
The quick-service restaurant industry is highly competitive and can be significantly affected by many factors, including changes in local, regional, and national economic conditions, changes in consumer tastes, consumer concerns about nutritional quality of quick-service food, and increases in the number of, and particular locations of, competing quick-service restaurants. Increases in food and energy costs can also play a significant role.
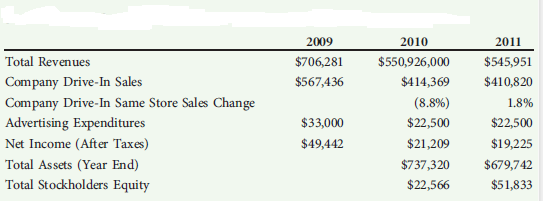
Unfortunately, after experiencing explosive growth from the late 1980s up until the mid 2000s, performance began to falter. To put this in historical perspective, in 1984 average annual sales per drive-in were $292,000 and in 1990 they were $445,000, and by 2011 were $1,037,000, or a couple percent lower than in 2009. Clearly sales per drive-in had recently pla-teaued. Another indicator of faltering performance was that total revenues for fiscal year 2007 (fiscal year ends August 31) were $767 million but by 2011 had fallen to $546 million. It should be noted that the total revenues reflect both sales from company-owned drive-ins and franchise fees and leases that franchisees pay to Sonic (the franchisor). The accompanying exhibit provides a variety of financial and operating data on Sonic.
Sonic Corp. Selected Financial (all in 1,000) and Operating Data
Sonic has attempted to make a variety of strategic changes to reverse its declining performance. Since 2005, it has expanded into states in the Northeast, Northwest, and along the U.S. and Canadian border. In 2010 Sonic placed increased emphasis on more high quality food. This included the introduction of real ice cream, footlong quarter pound chili cheese hot dogs, a new line of premium beef hot dogs, bigger and better burgers, and new premium burritos with meat and cheese options. In addition, there was a renewed emphasis on improved customer service and a focus on greater consistency across visits over time and across different locations (both company owned and franchised). As it ended fiscal 2011, the company announced a $30 million common stock repurchase plan effective through August 31, 2012.
1. What are some of the population, social, and economic trends that may be influencing Sonic's performance
2. Apply the "consumer shopping and purchasing model" (see Exhibit 3.7) to gain insights into how Sonic can attract more customers.
3. Evaluate whether the strategies that Sonic is pursuing to improve performance are optimal.
4. Analyze Sonic's financial performance over the last couple of years.
Note: This case was prepared as a basis for class discussion rather than to illustrate either effective or ineffective handling of a retail situation. This case is based on the authors' patronage of Sonic Drive-Ins for 30 years, parts of the 1991 Prospectus which was used to take the company public, and 2009-2011 Annual Report to Stockholders.
Shawnee, Oklahoma, in 1953 was the stage for the first Sonic Drive-In restaurant to be opened. By 2010 there are 3,500 Sonic Drive-Ins in the United States, operating at year-end 2011 in 43 states. However, Oklahoma and three bordering states (Texas, Kansas, Arkansas) have nearly half of the system-wide drive-ins and Texas itself over one-third). Sonic is primarily a franchise organization with roughly 87 percent of drive-ins operated by franchisees.
Sonic views itself as in the quick-serve restaurant industry where all items are made when ordered and can be highly customized with condiments. Sonic strives to establish a unique dining experience. This experience is built around personalized Carhop service where smiling carhops deliver a customer's order to their car. Customers can eat in their vehicles or also have the option of drive-thru service or patio dining. Sonic Drive-Ins are open all day; usually from 6 or 7 a.m. until 10 p.m. or a bit later. In 2011, 49 percent of sales occurred during lunchtime and dinnertime; 23 percent in the afternoon, 16 percent after dinner and 12 percent in the morning.
The quick-service restaurant industry is highly competitive and can be significantly affected by many factors, including changes in local, regional, and national economic conditions, changes in consumer tastes, consumer concerns about nutritional quality of quick-service food, and increases in the number of, and particular locations of, competing quick-service restaurants. Increases in food and energy costs can also play a significant role.
Unfortunately, after experiencing explosive growth from the late 1980s up until the mid 2000s, performance began to falter. To put this in historical perspective, in 1984 average annual sales per drive-in were $292,000 and in 1990 they were $445,000, and by 2011 were $1,037,000, or a couple percent lower than in 2009. Clearly sales per drive-in had recently pla-teaued. Another indicator of faltering performance was that total revenues for fiscal year 2007 (fiscal year ends August 31) were $767 million but by 2011 had fallen to $546 million. It should be noted that the total revenues reflect both sales from company-owned drive-ins and franchise fees and leases that franchisees pay to Sonic (the franchisor). The accompanying exhibit provides a variety of financial and operating data on Sonic.
Sonic Corp. Selected Financial (all in 1,000) and Operating Data
Sonic has attempted to make a variety of strategic changes to reverse its declining performance. Since 2005, it has expanded into states in the Northeast, Northwest, and along the U.S. and Canadian border. In 2010 Sonic placed increased emphasis on more high quality food. This included the introduction of real ice cream, footlong quarter pound chili cheese hot dogs, a new line of premium beef hot dogs, bigger and better burgers, and new premium burritos with meat and cheese options. In addition, there was a renewed emphasis on improved customer service and a focus on greater consistency across visits over time and across different locations (both company owned and franchised). As it ended fiscal 2011, the company announced a $30 million common stock repurchase plan effective through August 31, 2012.
1. What are some of the population, social, and economic trends that may be influencing Sonic's performance
2. Apply the "consumer shopping and purchasing model" (see Exhibit 3.7) to gain insights into how Sonic can attract more customers.
3. Evaluate whether the strategies that Sonic is pursuing to improve performance are optimal.
4. Analyze Sonic's financial performance over the last couple of years.
Note: This case was prepared as a basis for class discussion rather than to illustrate either effective or ineffective handling of a retail situation. This case is based on the authors' patronage of Sonic Drive-Ins for 30 years, parts of the 1991 Prospectus which was used to take the company public, and 2009-2011 Annual Report to Stockholders.
Question
Question
Question
Question
Question
Question
Question
Question
Question
Question
Question
Question
Question

Unlock Deck
Sign up to unlock the cards in this deck!
Unlock Deck
Unlock Deck
1/14
Play
Full screen (f)
Deck 3: Retail Customers
1
Sonic Drive-Ins: Surviving in Difficult Times
Shawnee, Oklahoma, in 1953 was the stage for the first Sonic Drive-In restaurant to be opened. By 2010 there are 3,500 Sonic Drive-Ins in the United States, operating at year-end 2011 in 43 states. However, Oklahoma and three bordering states (Texas, Kansas, Arkansas) have nearly half of the system-wide drive-ins and Texas itself over one-third). Sonic is primarily a franchise organization with roughly 87 percent of drive-ins operated by franchisees.
Sonic views itself as in the quick-serve restaurant industry where all items are made when ordered and can be highly customized with condiments. Sonic strives to establish a unique dining experience. This experience is built around personalized Carhop service where smiling carhops deliver a customer's order to their car. Customers can eat in their vehicles or also have the option of drive-thru service or patio dining. Sonic Drive-Ins are open all day; usually from 6 or 7 a.m. until 10 p.m. or a bit later. In 2011, 49 percent of sales occurred during lunchtime and dinnertime; 23 percent in the afternoon, 16 percent after dinner and 12 percent in the morning.
The quick-service restaurant industry is highly competitive and can be significantly affected by many factors, including changes in local, regional, and national economic conditions, changes in consumer tastes, consumer concerns about nutritional quality of quick-service food, and increases in the number of, and particular locations of, competing quick-service restaurants. Increases in food and energy costs can also play a significant role.
Unfortunately, after experiencing explosive growth from the late 1980s up until the mid 2000s, performance began to falter. To put this in historical perspective, in 1984 average annual sales per drive-in were $292,000 and in 1990 they were $445,000, and by 2011 were $1,037,000, or a couple percent lower than in 2009. Clearly sales per drive-in had recently pla-teaued. Another indicator of faltering performance was that total revenues for fiscal year 2007 (fiscal year ends August 31) were $767 million but by 2011 had fallen to $546 million. It should be noted that the total revenues reflect both sales from company-owned drive-ins and franchise fees and leases that franchisees pay to Sonic (the franchisor). The accompanying exhibit provides a variety of financial and operating data on Sonic.
Sonic Corp. Selected Financial (all in 1,000) and Operating Data
Sonic has attempted to make a variety of strategic changes to reverse its declining performance. Since 2005, it has expanded into states in the Northeast, Northwest, and along the U.S. and Canadian border. In 2010 Sonic placed increased emphasis on more high quality food. This included the introduction of real ice cream, footlong quarter pound chili cheese hot dogs, a new line of premium beef hot dogs, bigger and better burgers, and new premium burritos with meat and cheese options. In addition, there was a renewed emphasis on improved customer service and a focus on greater consistency across visits over time and across different locations (both company owned and franchised). As it ended fiscal 2011, the company announced a $30 million common stock repurchase plan effective through August 31, 2012.
1. What are some of the population, social, and economic trends that may be influencing Sonic's performance
2. Apply the "consumer shopping and purchasing model" (see Exhibit 3.7) to gain insights into how Sonic can attract more customers.
3. Evaluate whether the strategies that Sonic is pursuing to improve performance are optimal.
4. Analyze Sonic's financial performance over the last couple of years.
Note: This case was prepared as a basis for class discussion rather than to illustrate either effective or ineffective handling of a retail situation. This case is based on the authors' patronage of Sonic Drive-Ins for 30 years, parts of the 1991 Prospectus which was used to take the company public, and 2009-2011 Annual Report to Stockholders.
The decline of the sales at SD-Ins may be attributed to changes in the market. It is indicated that the drive in restaurant has been serving the customers for decades, and the sales has been growing every year. However, in the year 2011, the signs of decline of sales were experienced. This decline may be due the changing preferences of the customers.
The customers, who were once young and had the life style of eating outside, were the customers of SD-Ins. But, those customers would have become old and may not be driving to the restaurants. Second, the generation Y may be interested in other kinds of eating joints. The advent of internet and tele-commuting jobs may have affected the travelling patterns of the customers. The income of the people is also on the rise that makes them to seek higher end restaurants, rather than go for low priced and standard meals. A large part of the population may have shifted to super-urban localities such as New York, Chicago, Los Angeles, Boston, etc. The SD-Ins needs to understand the market, and alter its strategy to revive the falling sales.
The customers, who were once young and had the life style of eating outside, were the customers of SD-Ins. But, those customers would have become old and may not be driving to the restaurants. Second, the generation Y may be interested in other kinds of eating joints. The advent of internet and tele-commuting jobs may have affected the travelling patterns of the customers. The income of the people is also on the rise that makes them to seek higher end restaurants, rather than go for low priced and standard meals. A large part of the population may have shifted to super-urban localities such as New York, Chicago, Los Angeles, Boston, etc. The SD-Ins needs to understand the market, and alter its strategy to revive the falling sales.
2
In this chapter, you learned that a major determinant of retail performance is how broadly or narrowly you define your market. In addition, when planning your retail business it will be important that you develop your retail marketing strategy to appeal to this particular market. For example, a women's apparel store could cater to all age groups, professional working women, or teens; it could also target various income groups such as low, moderate, or high income. Further, it could target women of different sizes from petite to full-figured.
For the store you are planning, assume that there are 21,000 households in your community and that these are within a reasonable driving distance. You have determined that if you broadly define your store's market, 64 percent of households in the community would be shoppers at your store and would shop there an average of 3.3 times per year. On the other hand, if you define your market much more selectively by focusing on a well-defined niche, you estimate only 26 percent of households would shop your store; however, they would shop an average of 9.2 times annually.
In this situation, would a broadly or more narrowly defined market create more customer visits to the store (Hint: Total store visitors, also referred to as traffic, is equal to the total number of households in the market multiplied by the proportion that would shop your store, multiplied by their average shopping frequency.) What other factors should you consider when deciding how narrowly or broadly to define your market
While performing the retail business the organization will have to define their markets in order to determine the traffic which can approach the retail shop. From this the productivity of the organization can be estimated. While defining a market, the management can focus broadly as well as narrowly.
Here a retail organization XYZ is taken into consideration and its market is defined appropriately. If the market is defined broadly the total number of store visitors will be
TSV= 2100064%×3.3
=40320 per year
If the market is defined narrowly the total number of store visitors will be
TSV= 21000×26%×9.2
=50232 per year
From the above calculation it can be determined that the total number of visitors for the retail store in a year is higher when the market is defined narrowly. This visiting will be the repetition of the same customers. This can enhance the sales of the retail shop. Through defining the market narrowly the customers can be focused closely and they can be easily persuaded to visit the shop. Through this the need and the requirement of the customers are identified and then they are approached accordingly. This type of targeting can generate huge inflow of the customers.
While deciding on defining the market narrowly, the management will have to identify the demographic conditions, their buying behaviour, their requirements, buying potential etc. through focusing on these factors the organization can target their customers too narrowly.
3
Explain the importance of population trends on retail planning.
During the recent recession, some so-called retail experts urged retailers to cut expenses to the bone and not to worry about their customer service levels. Was this a good idea What is the reasoning behind your answer
During the recent recession, some so-called retail experts urged retailers to cut expenses to the bone and not to worry about their customer service levels. Was this a good idea What is the reasoning behind your answer
Cutting costs in retail as such is not a mistake, but neglecting the customer in business is a misdeed. The historical data indicates that even when the prices of products increased due to the increase in global oil prices, customers shown high satisfaction with some of the retail brands. On analysis, it was discovered that those highly rated retail chains have deliberately executed customer care services at their outlets. Being indifferent to customers and offering low priced products is a bad choice in retailing.
.
.
4
Explain the importance of population trends on retail planning.
Between 2010 and 2050, what type of retailers will be most affected by changes in the ethnic makeup of the population Will these same retailers be affected by the changing age distribution
Between 2010 and 2050, what type of retailers will be most affected by changes in the ethnic makeup of the population Will these same retailers be affected by the changing age distribution
Unlock Deck
Unlock for access to all 14 flashcards in this deck.
Unlock Deck
k this deck
5
Explain the importance of population trends on retail planning.
It is important for a retailer to understand that as boomers age, they change their shopping behavior. Can you provide one example from current events where a retailer successfully adapted to this changing behavior Can you provide an example where a retailer hasn't done a good job of adapting to these changes
It is important for a retailer to understand that as boomers age, they change their shopping behavior. Can you provide one example from current events where a retailer successfully adapted to this changing behavior Can you provide an example where a retailer hasn't done a good job of adapting to these changes
Unlock Deck
Unlock for access to all 14 flashcards in this deck.
Unlock Deck
k this deck
6
What social trends should be monitored, and what are their impacts on retailing
What strategies should retailers develop given the higher level of educational attainment today Explain your reasoning.
What strategies should retailers develop given the higher level of educational attainment today Explain your reasoning.
Unlock Deck
Unlock for access to all 14 flashcards in this deck.
Unlock Deck
k this deck
7
What social trends should be monitored, and what are their impacts on retailing
Should retailers care about trends such as the delay or even postponement of marriage by modern Americans After all, how does this affect apparel retailing restaurant retailing home furnishing retailers
Should retailers care about trends such as the delay or even postponement of marriage by modern Americans After all, how does this affect apparel retailing restaurant retailing home furnishing retailers
Unlock Deck
Unlock for access to all 14 flashcards in this deck.
Unlock Deck
k this deck
8
What social trends should be monitored, and what are their impacts on retailing
Which recent trend-parents returning to live with their children or children returning to live with their parents-is going to have the most significant impact on retailers What can retailers do to take advantage of these trends
Which recent trend-parents returning to live with their children or children returning to live with their parents-is going to have the most significant impact on retailers What can retailers do to take advantage of these trends
Unlock Deck
Unlock for access to all 14 flashcards in this deck.
Unlock Deck
k this deck
9
How do the changing economic trends affect retailing
Why is it more difficult for retailers to manage their businesses when economic turbulence is high
Why is it more difficult for retailers to manage their businesses when economic turbulence is high
Unlock Deck
Unlock for access to all 14 flashcards in this deck.
Unlock Deck
k this deck
10
How do the changing economic trends affect retailing
In recent years, the net wealth of the average American has grown at a slower rate, if not declined. Should retailers worry about this Why
In recent years, the net wealth of the average American has grown at a slower rate, if not declined. Should retailers worry about this Why
Unlock Deck
Unlock for access to all 14 flashcards in this deck.
Unlock Deck
k this deck
11
How do the changing economic trends affect retailing
How are retailers affected by the fact that today's college students are graduating with a highest amount of student debt ever Can you give an example where this will help a retailer Will this hurt any retailers
How are retailers affected by the fact that today's college students are graduating with a highest amount of student debt ever Can you give an example where this will help a retailer Will this hurt any retailers
Unlock Deck
Unlock for access to all 14 flashcards in this deck.
Unlock Deck
k this deck
12
What is involved in the consumer behavior model, including the key stages in the buying process
Why is the consumer shopping and purchasing model presented within the text called a process model Explain how understanding this process could affect a retailer's actions.
Why is the consumer shopping and purchasing model presented within the text called a process model Explain how understanding this process could affect a retailer's actions.
Unlock Deck
Unlock for access to all 14 flashcards in this deck.
Unlock Deck
k this deck
13
What is involved in the consumer behavior model, including the key stages in the buying process
Does a consumer begin the shopping and purchasing process at the need-recognition stage
Does a consumer begin the shopping and purchasing process at the need-recognition stage
Unlock Deck
Unlock for access to all 14 flashcards in this deck.
Unlock Deck
k this deck
14
What is involved in the consumer behavior model, including the key stages in the buying process
Why should a retailer care about a customer after a sale has been made
Why should a retailer care about a customer after a sale has been made
Unlock Deck
Unlock for access to all 14 flashcards in this deck.
Unlock Deck
k this deck
Unlock Deck
Unlock for access to all 14 flashcards in this deck.


