Deck 15: Job Order Costing
Full screen (f)
Question
Question
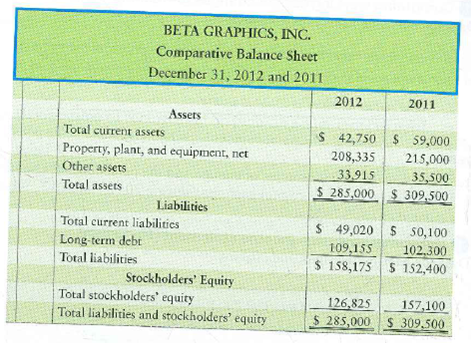
Vertical analysis of a balance sheet
Beta Graphics, Inc., has the following data:
Requirement
1. Perform a vertical analysis of Beta's balance sheet for each year.
Beta Graphics, Inc., has the following data:
Requirement
1. Perform a vertical analysis of Beta's balance sheet for each year.
Question
Effects of business transactions on selected ratios
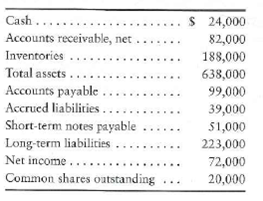
Financial statement data of Road Trip Magazine include the following items:
Requirements
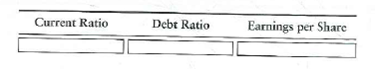
1. Compute Road Trip's current ratio, debt ratio, and earnings per share. Round all ratios to two decimal places, and use the following format for your answer:
2. Compute the three ratios after evaluating the effect of each transaction that follows. Consider each transaction separately.
a. Purchased inventory of $45,000 on account.
b. Borrowed $127,000 on a long-term note payable.
c. Issued 2,000 shares of common stock, receiving cash of $105,000.
d. Received cash on account, $7,000.
Financial statement data of Road Trip Magazine include the following items:
Requirements
1. Compute Road Trip's current ratio, debt ratio, and earnings per share. Round all ratios to two decimal places, and use the following format for your answer:
2. Compute the three ratios after evaluating the effect of each transaction that follows. Consider each transaction separately.
a. Purchased inventory of $45,000 on account.
b. Borrowed $127,000 on a long-term note payable.
c. Issued 2,000 shares of common stock, receiving cash of $105,000.
d. Received cash on account, $7,000.
Question
Question
Question
Using ratios to evaluate a stock investment
Comparative financial statement data of Tanfield, Inc., follow:
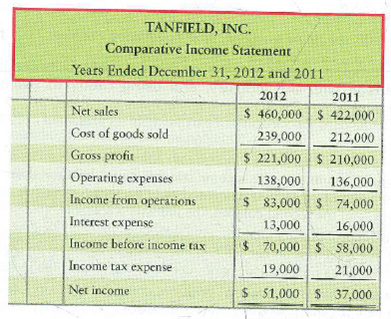
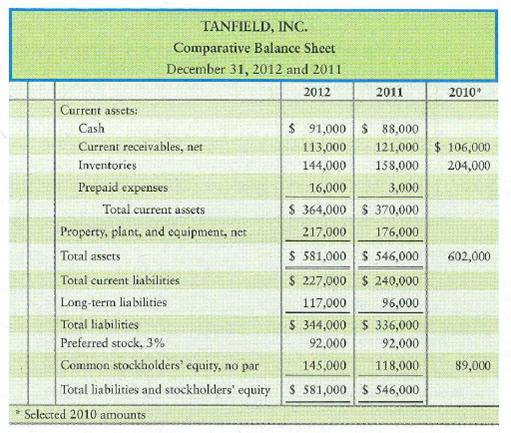
1. Market price of Tanfield's common stock: $59.36 at December 31, 2012, and $46.65 at December 31, 2011.
2. Common shares outstanding: 13,000 during 2012 and 11,000 during 2011 and 2010.
3. All sales on credit.
Requirements
1. Compute the following ratios for 2012 and 2011:
a. Current ratio
b. Times-interest-earned ratio
c. Inventory turnover
d. Gross profit percentage
e. Debt to equity ratio
f. Rate of return on common stockholders' equity
g. Earnings per share of common stock
h. Price/earnings ratio
2. Decide (a) whether Tanfield's ability to pay debts and to sell inventory improved or deteriorated during 2012 and (b) whether the investment attractiveness of its common stock appears to have increased or decreased.
Comparative financial statement data of Tanfield, Inc., follow:
1. Market price of Tanfield's common stock: $59.36 at December 31, 2012, and $46.65 at December 31, 2011.
2. Common shares outstanding: 13,000 during 2012 and 11,000 during 2011 and 2010.
3. All sales on credit.
Requirements
1. Compute the following ratios for 2012 and 2011:
a. Current ratio
b. Times-interest-earned ratio
c. Inventory turnover
d. Gross profit percentage
e. Debt to equity ratio
f. Rate of return on common stockholders' equity
g. Earnings per share of common stock
h. Price/earnings ratio
2. Decide (a) whether Tanfield's ability to pay debts and to sell inventory improved or deteriorated during 2012 and (b) whether the investment attractiveness of its common stock appears to have increased or decreased.
Question
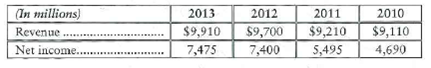
Trend analysis
Mariner, Corp., reported the following revenues and net income amounts:
Requirements
1. Calculate Mariner's trend analysis for revenues and net income. Use 2010 as the base year, and round to the nearest percent.
2. Which measure increased faster during 2011-2013
Mariner, Corp., reported the following revenues and net income amounts:
Requirements
1. Calculate Mariner's trend analysis for revenues and net income. Use 2010 as the base year, and round to the nearest percent.
2. Which measure increased faster during 2011-2013
Question
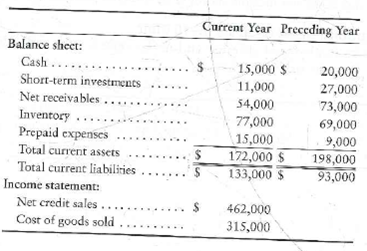
Computing six key ratios
The financial statements of Victor's Natural Foods include the following items:
Requirement
1. Compute the following ratios for the current year:
a. Current ratio
b. Acid-test ratio
c. Inventory turnover
d. Days in inventory
e. Days' sales in receivables
f. Gross profit percentage
The financial statements of Victor's Natural Foods include the following items:
Requirement
1. Compute the following ratios for the current year:
a. Current ratio
b. Acid-test ratio
c. Inventory turnover
d. Days in inventory
e. Days' sales in receivables
f. Gross profit percentage
Question
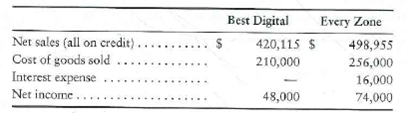
Using ratios to decide between two stock investments
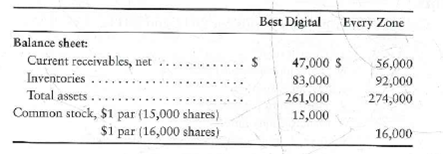
Assume that you are purchasing an investment and have decided to invest in a company in the digital phone business. You have narrowed the choice to Best Digital, Corp., and Every Zone, Inc., and have assembled the following data.
Selected income statement data for the current year:
Selected balance sheet and market price data at the end of the current year:
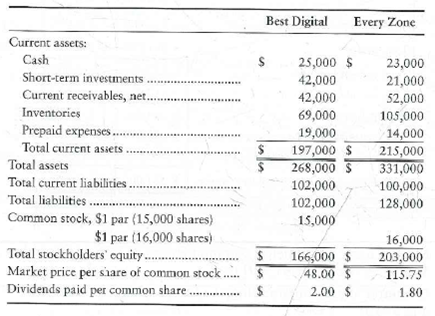
Selected balance sheet data at the beginning of the current year:
Your strategy is to invest in companies that have low price/earnings ratios but appear to be in good shape financially. Assume that you have analyzed all other factors and that your decision depends on the results of ratio analysis.
Requirement
1. Compute the following ratios for both companies for the current year, and decide which company's stock better fits your investment strategy.
a. Acid-test ratio
b. Inventory turnover
c. Days'sales in receivables
d. Debt ratio
e. Earnings per share of common stock
f. Price/earnings ratio
g. Dividend payout
Assume that you are purchasing an investment and have decided to invest in a company in the digital phone business. You have narrowed the choice to Best Digital, Corp., and Every Zone, Inc., and have assembled the following data.
Selected income statement data for the current year:
Selected balance sheet and market price data at the end of the current year:
Selected balance sheet data at the beginning of the current year:
Your strategy is to invest in companies that have low price/earnings ratios but appear to be in good shape financially. Assume that you have analyzed all other factors and that your decision depends on the results of ratio analysis.
Requirement
1. Compute the following ratios for both companies for the current year, and decide which company's stock better fits your investment strategy.
a. Acid-test ratio
b. Inventory turnover
c. Days'sales in receivables
d. Debt ratio
e. Earnings per share of common stock
f. Price/earnings ratio
g. Dividend payout
Question
Question
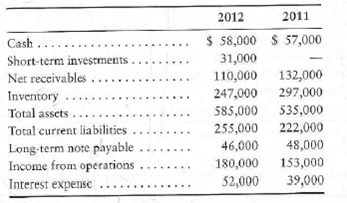
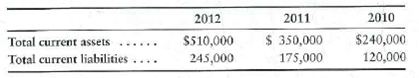
Analyzing the ability to pay liabilities
Large Land Photo Shop has asked you to determine whether the company's ability to pay current liabilities and total liabilities improved or deteriorated during 2012. To answer this question, you gather the following data:
Requirement
1. Compute the following ratios for 2012 and 2011:
a. Current ratio
b. Acid-test ratio
c. Debt ratio
d. Debt to equity ratio.
Question
Question
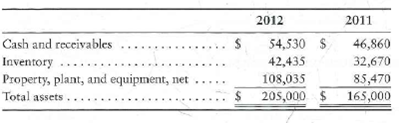
Vertical analysis
Tri-State Optical Company reported the following amounts on its balance sheet at December 31, 2012 and 2011:
Requirement
1. Prepare a vertical analysis of Tri-State assets for 2012 and 2011.
Tri-State Optical Company reported the following amounts on its balance sheet at December 31, 2012 and 2011:
Requirement
1. Prepare a vertical analysis of Tri-State assets for 2012 and 2011.
Question
Analyzing profitability
The CJ, Inc., comparative income statement follows. The 2010 data are given as needed.
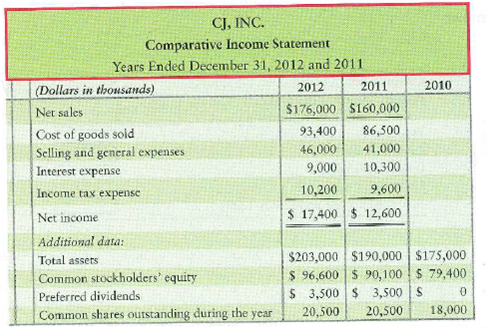
Requirements
1. Calculate the rate of return on net sales.
2. Calculate the rate of return on total assets.
3. Calculate the asset turnover ratio.
4. Calculate the rate of return on common stockholders' equity.
5. Calculate the EPS.
6. Calculate the 2012 dividend payout on common stock.
7. Did the company's operating performance improve or deteriorate during 2012
The CJ, Inc., comparative income statement follows. The 2010 data are given as needed.
Requirements
1. Calculate the rate of return on net sales.
2. Calculate the rate of return on total assets.
3. Calculate the asset turnover ratio.
4. Calculate the rate of return on common stockholders' equity.
5. Calculate the EPS.
6. Calculate the 2012 dividend payout on common stock.
7. Did the company's operating performance improve or deteriorate during 2012
Question
Question
Common-size income statement
Data for Martinez, Inc., and Rosado, Corp., follow:
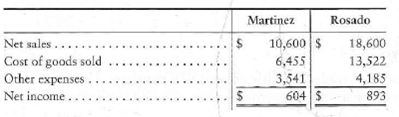
Requirements
1. Prepare common-size income statements.
2. Which company earns more net income
3. Which company's net income is a higher percentage of its net sales
Data for Martinez, Inc., and Rosado, Corp., follow:
Requirements
1. Prepare common-size income statements.
2. Which company earns more net income
3. Which company's net income is a higher percentage of its net sales
Question
Evaluating a stock as an investment
Data for Shamrock State Bank follows:
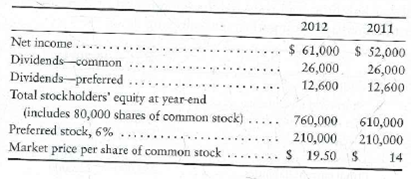
Requirement
1. Evaluate the common stock of Shamrock State Bank as an investment. Specifically, use the four stock ratios to determine whether the common stock has increased or decreased in attractiveness during the past year.
Data for Shamrock State Bank follows:
Requirement
1. Evaluate the common stock of Shamrock State Bank as an investment. Specifically, use the four stock ratios to determine whether the common stock has increased or decreased in attractiveness during the past year.
Question
Evaluating current ratio
Win's Companies, a home improvement store chain, reported the following summarized figures:
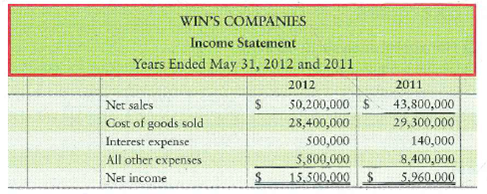
Requirements
1. Compute Win's Companies' current ratio at May 31, 2012 and 2011.
2. Did Win's Companies' current ratio improve, deteriorate, or hold steady during 2012
Win's Companies, a home improvement store chain, reported the following summarized figures:
Requirements
1. Compute Win's Companies' current ratio at May 31, 2012 and 2011.
2. Did Win's Companies' current ratio improve, deteriorate, or hold steady during 2012
Question
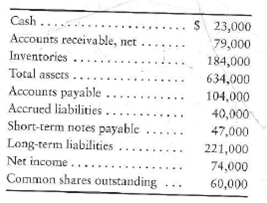
Using ratios to reconstruct a balance sheet
The following data are adapted from the financial statements of Betty's Shops, Inc.:
Requirement
1. Complete Betty's condensed balance sheet.
The following data are adapted from the financial statements of Betty's Shops, Inc.:
Requirement
1. Complete Betty's condensed balance sheet.
Question
Question
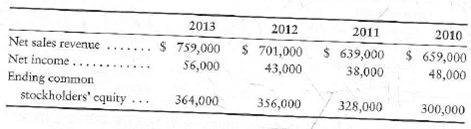
Trend analysis and return on common equity
Net sales revenue, net income, and common stockholders' equity for Azbel Mission Corporation, a manufacturer of contact lenses, follow for a four-year period.
Requirements
1. Compute trend analyses for each item for 2011-2013. Use 2010 as the base year, and round to the nearest whole percent.
2. Compute the rate of return on common stockholders' equity for 2011-2013, rounding to three decimal places.
Question
Question
Vertical analysis
The McConnell Department Stores, Inc., chief executive officer (CEO) has asked you to compare the company's profit performance and financial position with the average for the industry. The CEO has given you the company's income statement and balance sheet, as well as the industry average data for retailers.
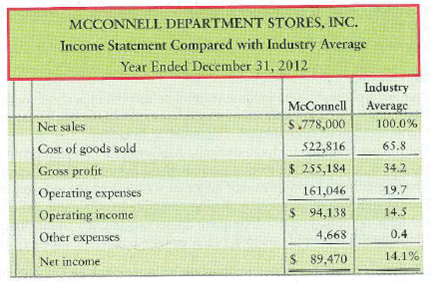
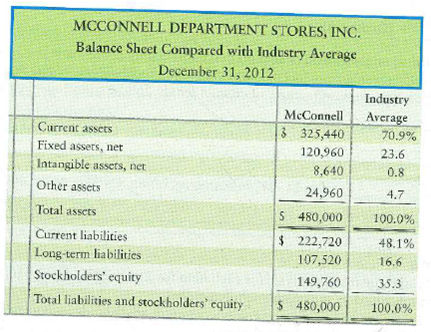
Requirement
1. Prepare a vertical analysis for McConnell for both its income statement and balance sheet.
The McConnell Department Stores, Inc., chief executive officer (CEO) has asked you to compare the company's profit performance and financial position with the average for the industry. The CEO has given you the company's income statement and balance sheet, as well as the industry average data for retailers.
Requirement
1. Prepare a vertical analysis for McConnell for both its income statement and balance sheet.
Question
Question
Question
Question
Analyzing a Company for Its Investment Potential
In its annual report, WRS Athletic Supply, Inc., includes the following five-year financial summary.
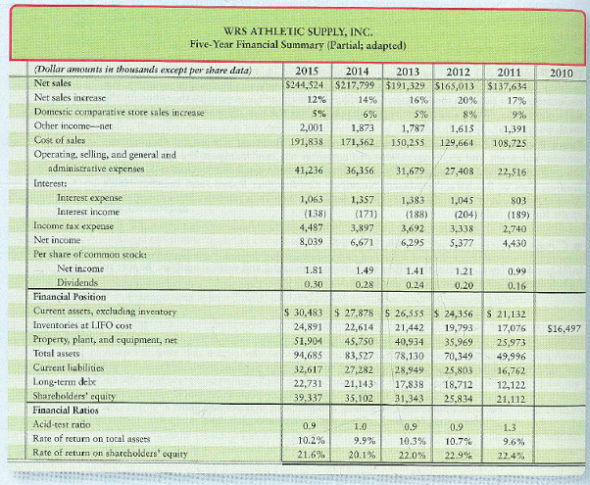
Requirement
1. Analyze the company's financial summary for the fiscal years 2011-2015 to decide whether to invest in the common stock of WRS.. Include the following sections in your analysis, and fully explain your final decision.
a. Trend analysis for net sales and net income (use 2011 as the base year).
b. Profitability analysis.
c. Evaluate the ability to sell inventory (WRS uses the LIFO method).
d. Evaluate the ability to pay debts.
e. Evaluate the dividends.
In its annual report, WRS Athletic Supply, Inc., includes the following five-year financial summary.
Requirement
1. Analyze the company's financial summary for the fiscal years 2011-2015 to decide whether to invest in the common stock of WRS.. Include the following sections in your analysis, and fully explain your final decision.
a. Trend analysis for net sales and net income (use 2011 as the base year).
b. Profitability analysis.
c. Evaluate the ability to sell inventory (WRS uses the LIFO method).
d. Evaluate the ability to pay debts.
e. Evaluate the dividends.
Question
Question
Effects of business transactions on selected ratios
Financial statement data of American Traveler Magazine include the following items:
Requirements
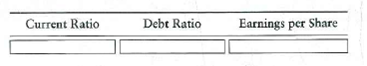
1. Compute American Traveler's current ratio, debt ratio, and earnings per share. Round all ratios to two decimal places, and use the following format for your answer:
2. Compute the three ratios after evaluating the effect of each transaction that follows. Consider each transaction separately.
a. Purchased inventory of $49,000 on account.
b. Borrowed $122,000 on a long-term note payable.
c. Issued 6,000 shares of common stock, receiving cash of $103,000.
d. Received cash on account, $3,000.
Financial statement data of American Traveler Magazine include the following items:
Requirements
1. Compute American Traveler's current ratio, debt ratio, and earnings per share. Round all ratios to two decimal places, and use the following format for your answer:
2. Compute the three ratios after evaluating the effect of each transaction that follows. Consider each transaction separately.
a. Purchased inventory of $49,000 on account.
b. Borrowed $122,000 on a long-term note payable.
c. Issued 6,000 shares of common stock, receiving cash of $103,000.
d. Received cash on account, $3,000.
Question
Question
Using ratios to reconstruct an income statement
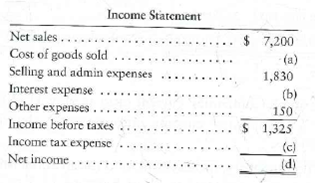
A skeleton of Landmark Mills' income statement appears as follows (amounts in thousands):
Requirement
1. Use the following ratio data to complete Landmark Mills' income statement:
a. Inventory turnover was 3.50 (beginning inventory was $850; ending inventory was $810).
b. Rate of return on net sales is 0.11.
Question
Using ratios to evaluate a stock investment
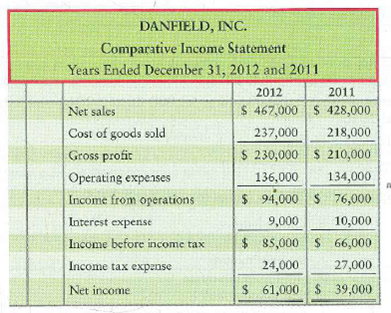
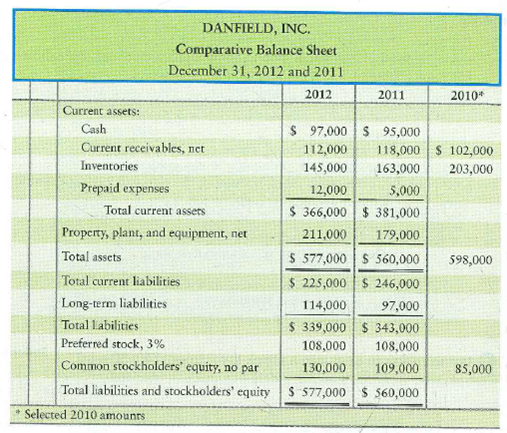
Comparative financial statement data of Danfield, Inc., follow:
1. Market price of Danfield's common stock: $86.58 at December 31, 2012, and $46.54 at December 31, 2011.
2. Common shares outstanding: 12,000 during 2012 and 10,000 during 2011 and 2010.
3. All sales on credit.
Requirements
1. Compute the following ratios for 2012 and 2011:
a. Current ratio
b. Times-interest-earned ratio
c. Inventory turnover
d. Gross profit percentage
e. Debt to equity ratio
f. Rate of return on common stockholders' equity
g. Earnings per share of common stock
h. Price/earnings ratio
2. Decide (a) whether Danfield's ability to pay debts and to sell inventory improved or deteriorated during 2012 and (b) whether the investment attractiveness of its common stock appears to have increased or decreased.
Question
Question
Using ratios to reconstruct a balance sheet
A skeleton of Vintage Mills' balance sheet appears as follows (amounts in thousands):
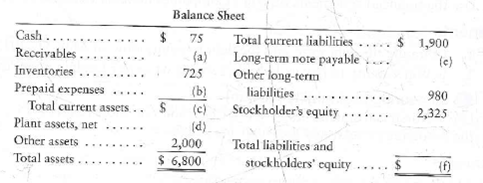
Requirement
1. Use the following ratio data to complete Vintage Mills' balance sheet.
a. Current ratio is 0.80.
b. Acid-test ratio is 0.40.
A skeleton of Vintage Mills' balance sheet appears as follows (amounts in thousands):
Requirement
1. Use the following ratio data to complete Vintage Mills' balance sheet.
a. Current ratio is 0.80.
b. Acid-test ratio is 0.40.
Question
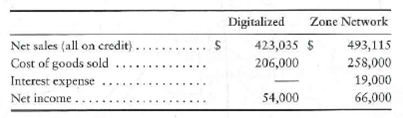
Using ratios to decide between two stock investments
Assume that you are purchasing an investment and have decided to invest in a company in the digital phone business. You have narrowed the choice to Digitalized, Corp., and Zone Network, Inc., and have assembled the following data:
Selected income statement data for the current year:
Selected balance sheet and market price data at the end of the current year:
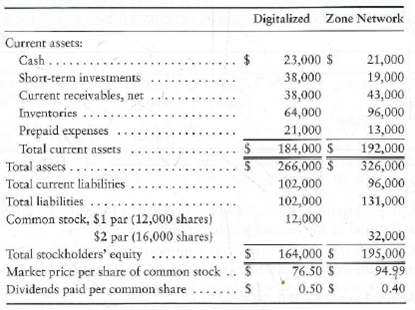
Selected balance sheet data at the beginning of the current year:
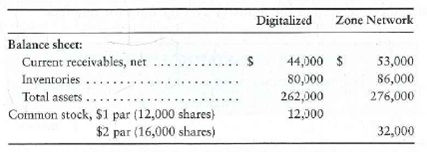
Your strategy is to invest in companies that have low price/earnings ratios but appear to be in good shape financially. Assume that you have analyzed all other factors and that your decision depends on the results of ratio analysis.
Requirement
1. Compute the following ratios for both companies for the current year, and decide which company's stock better fits your investment strategy.
a. Acid-test ratio
b. Inventory turnover
c. Days' sales in receivables
d. Debt ratio
e. Earnings per share of common stock
f. Price/earnings ratio
g. Dividend payout
Assume that you are purchasing an investment and have decided to invest in a company in the digital phone business. You have narrowed the choice to Digitalized, Corp., and Zone Network, Inc., and have assembled the following data:
Selected income statement data for the current year:
Selected balance sheet and market price data at the end of the current year:
Selected balance sheet data at the beginning of the current year:
Your strategy is to invest in companies that have low price/earnings ratios but appear to be in good shape financially. Assume that you have analyzed all other factors and that your decision depends on the results of ratio analysis.
Requirement
1. Compute the following ratios for both companies for the current year, and decide which company's stock better fits your investment strategy.
a. Acid-test ratio
b. Inventory turnover
c. Days' sales in receivables
d. Debt ratio
e. Earnings per share of common stock
f. Price/earnings ratio
g. Dividend payout
Question
Question
Computing working capital changes
Data for Beverage Enterprises follows:
Requirement
1. Compute the dollar amount of change and the percentage of change in Beverage Enterprises' working capital each year during 2011 and 2012. What do the calculated changes indicate
Data for Beverage Enterprises follows:
Requirement
1. Compute the dollar amount of change and the percentage of change in Beverage Enterprises' working capital each year during 2011 and 2012. What do the calculated changes indicate
Question
Trend analyses and return on common equity
Net sales revenue, net income, and common stockholders' equity for Shawnee Mission Corporation, a manufacturer of contact lenses, follow for a four-year period.
Requirements
1. Compute trend analyses for each item for 2011-2013. Use 2010 as the base year, and round to the nearest whole percent.
2. Compute the rate of return on common stockholders' equity for 2011-2013, rounding to three decimal places.
Question
Question
Horizontal analysis-income statement
Data for Mariner Designs, Inc., follow:
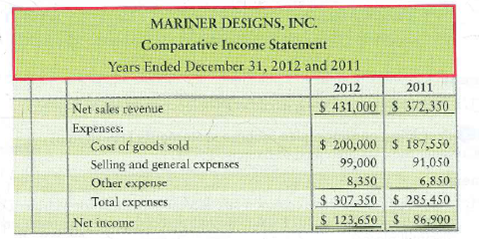
Requirements
1. Prepare a horizontal analysis of the comparative income statement of Mariner Designs, Inc. Round percentage changes to one decimal place.
2. Why did 2012 net income increase by a higher percentage than net sales revenue
Data for Mariner Designs, Inc., follow:
Requirements
1. Prepare a horizontal analysis of the comparative income statement of Mariner Designs, Inc. Round percentage changes to one decimal place.
2. Why did 2012 net income increase by a higher percentage than net sales revenue
Question
Vertical analysis
The Specialty Department Stores, Inc., chief executive officer (CEO) has asked you to compare the company's profit performance and financial position with the average for the industry. The CEO has given you the company's income statement and balance sheet, as well as the industry average data for retailers.
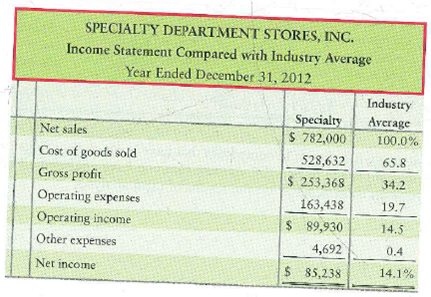
Requirement
1. Prepare a vertical analysis for Specialty for both its income statement and balance sheet.
The Specialty Department Stores, Inc., chief executive officer (CEO) has asked you to compare the company's profit performance and financial position with the average for the industry. The CEO has given you the company's income statement and balance sheet, as well as the industry average data for retailers.
Requirement
1. Prepare a vertical analysis for Specialty for both its income statement and balance sheet.
Question
Horizontal analysis
McCormick, Corp., reported the following on its comparative income statement:
Requirement
1. Prepare a horizontal analysis of revenues and gross profit-both in dollar amounts and in percentages-for 2012 and 2011.
McCormick, Corp., reported the following on its comparative income statement:
Requirement
1. Prepare a horizontal analysis of revenues and gross profit-both in dollar amounts and in percentages-for 2012 and 2011.
Question
Computing trend analysis
Magic Oaks Realty's net revenue and net income for the following five-year period, using 2010 as the base year, follow:
Requirements
1. Compute trend analysis for net revenue and net income. Round to the nearest full percent.
2. Which grew faster during the period, net revenue or net income
Magic Oaks Realty's net revenue and net income for the following five-year period, using 2010 as the base year, follow:
Requirements
1. Compute trend analysis for net revenue and net income. Round to the nearest full percent.
2. Which grew faster during the period, net revenue or net income
Question

Unlock Deck
Sign up to unlock the cards in this deck!
Unlock Deck
Unlock Deck
1/44
Play
Full screen (f)
Deck 15: Job Order Costing
1
Select an industry you are interested in, and pick any company in that industry to use as the benchmark. Then select two other companies in the same industry. For each category of ratios in the Decision Guidelines in the chapter, compute all the ratios for the three companies. Write a two-page report that compares the two companies with the benchmark company.
NO ANSWER
2
Vertical analysis of a balance sheet
Beta Graphics, Inc., has the following data:
Requirement
1. Perform a vertical analysis of Beta's balance sheet for each year.
Beta Graphics, Inc., has the following data:
Requirement
1. Perform a vertical analysis of Beta's balance sheet for each year.
• In order to efficiently perceive the company's financial statements and provide sufficient changes if needed, the company needs to compare its statements in three ways: from year to year, with a competitor, within the industry as a whole.
• Vertical analysis compares a change in dollar amounts for every single item in the company's statement and then divides it by the base amount.
• To compute vertical analysis percentage change, we need to divide each item of the company's statement (expenses, profits, assets, liabilities) by the company's total revenues.
3
Effects of business transactions on selected ratios
Financial statement data of Road Trip Magazine include the following items:
Requirements
1. Compute Road Trip's current ratio, debt ratio, and earnings per share. Round all ratios to two decimal places, and use the following format for your answer:
2. Compute the three ratios after evaluating the effect of each transaction that follows. Consider each transaction separately.
a. Purchased inventory of $45,000 on account.
b. Borrowed $127,000 on a long-term note payable.
c. Issued 2,000 shares of common stock, receiving cash of $105,000.
d. Received cash on account, $7,000.
2.
4
Lance Berkrnan is the controller of Saturn, a dance club whose year-end is December 31. Berkrnan prepares checks for suppliers in December makes the proper journal entries, and posts them to the appropriate accounts in that month. However, he holds on to the checks and mails them to the suppliers in January.
Requirements
1. What financial ratio(s) is(are) most affected by the action
2. What is Berkman's purpose in undertaking this activity
Requirements
1. What financial ratio(s) is(are) most affected by the action
2. What is Berkman's purpose in undertaking this activity
Unlock Deck
Unlock for access to all 44 flashcards in this deck.
Unlock Deck
k this deck
5
Preparing common-size income statements
Consider the data presented in Exercise 15-13.
Requirements
1. Prepare a comparative common-size income statement for Mariner Designs, Inc., using the 2012 and 2011 data. Round percentages to one-tenth percent (three decimal places).
2. To an investor, how does 2012 compare with 2011 Explain your reasoning.
Unlock Deck
Unlock for access to all 44 flashcards in this deck.
Unlock Deck
k this deck
6
Using ratios to evaluate a stock investment
Comparative financial statement data of Tanfield, Inc., follow:
1. Market price of Tanfield's common stock: $59.36 at December 31, 2012, and $46.65 at December 31, 2011.
2. Common shares outstanding: 13,000 during 2012 and 11,000 during 2011 and 2010.
3. All sales on credit.
Requirements
1. Compute the following ratios for 2012 and 2011:
a. Current ratio
b. Times-interest-earned ratio
c. Inventory turnover
d. Gross profit percentage
e. Debt to equity ratio
f. Rate of return on common stockholders' equity
g. Earnings per share of common stock
h. Price/earnings ratio
2. Decide (a) whether Tanfield's ability to pay debts and to sell inventory improved or deteriorated during 2012 and (b) whether the investment attractiveness of its common stock appears to have increased or decreased.
Unlock Deck
Unlock for access to all 44 flashcards in this deck.
Unlock Deck
k this deck
7
Trend analysis
Mariner, Corp., reported the following revenues and net income amounts:
Requirements
1. Calculate Mariner's trend analysis for revenues and net income. Use 2010 as the base year, and round to the nearest percent.
2. Which measure increased faster during 2011-2013
Mariner, Corp., reported the following revenues and net income amounts:
Requirements
1. Calculate Mariner's trend analysis for revenues and net income. Use 2010 as the base year, and round to the nearest percent.
2. Which measure increased faster during 2011-2013
Unlock Deck
Unlock for access to all 44 flashcards in this deck.
Unlock Deck
k this deck
8
Computing six key ratios
The financial statements of Victor's Natural Foods include the following items:
Requirement
1. Compute the following ratios for the current year:
a. Current ratio
b. Acid-test ratio
c. Inventory turnover
d. Days in inventory
e. Days' sales in receivables
f. Gross profit percentage
The financial statements of Victor's Natural Foods include the following items:
Requirement
1. Compute the following ratios for the current year:
a. Current ratio
b. Acid-test ratio
c. Inventory turnover
d. Days in inventory
e. Days' sales in receivables
f. Gross profit percentage
Unlock Deck
Unlock for access to all 44 flashcards in this deck.
Unlock Deck
k this deck
9
Using ratios to decide between two stock investments
Assume that you are purchasing an investment and have decided to invest in a company in the digital phone business. You have narrowed the choice to Best Digital, Corp., and Every Zone, Inc., and have assembled the following data.
Selected income statement data for the current year:
Selected balance sheet and market price data at the end of the current year:
Selected balance sheet data at the beginning of the current year:
Your strategy is to invest in companies that have low price/earnings ratios but appear to be in good shape financially. Assume that you have analyzed all other factors and that your decision depends on the results of ratio analysis.
Requirement
1. Compute the following ratios for both companies for the current year, and decide which company's stock better fits your investment strategy.
a. Acid-test ratio
b. Inventory turnover
c. Days'sales in receivables
d. Debt ratio
e. Earnings per share of common stock
f. Price/earnings ratio
g. Dividend payout
Unlock Deck
Unlock for access to all 44 flashcards in this deck.
Unlock Deck
k this deck
10
Select a company and obtain its financial statements. Convert the income statement and the balance sheet to common size, and compare the company you selected to the industry average. The Risk Management Association's Annual Statement Studies , Dun Bradstreet's Industry Norms Key Business Ratios , and Prentice Hall's Almanac of Business and Industrial Financial Ratios , by Leo Troy, publish common-size statements for most industries.
Unlock Deck
Unlock for access to all 44 flashcards in this deck.
Unlock Deck
k this deck
11
Analyzing the ability to pay liabilities
Large Land Photo Shop has asked you to determine whether the company's ability to pay current liabilities and total liabilities improved or deteriorated during 2012. To answer this question, you gather the following data:
Requirement
1. Compute the following ratios for 2012 and 2011:
a. Current ratio
b. Acid-test ratio
c. Debt ratio
d. Debt to equity ratio.
Large Land Photo Shop has asked you to determine whether the company's ability to pay current liabilities and total liabilities improved or deteriorated during 2012. To answer this question, you gather the following data:
Requirement
1. Compute the following ratios for 2012 and 2011:
a. Current ratio
b. Acid-test ratio
c. Debt ratio
d. Debt to equity ratio.
Unlock Deck
Unlock for access to all 44 flashcards in this deck.
Unlock Deck
k this deck
12
Vertical analysis of a balance sheet
This exercise continues the Lawlor Lawn Service, Inc., situation from Exercise 14-32 of Chapter 14.
Requirement
1. Prepare a vertical analysis from the income statement you prepared in Chapter 4.
This exercise continues the Lawlor Lawn Service, Inc., situation from Exercise 14-32 of Chapter 14.
Requirement
1. Prepare a vertical analysis from the income statement you prepared in Chapter 4.
Unlock Deck
Unlock for access to all 44 flashcards in this deck.
Unlock Deck
k this deck
13
Vertical analysis
Tri-State Optical Company reported the following amounts on its balance sheet at December 31, 2012 and 2011:
Requirement
1. Prepare a vertical analysis of Tri-State assets for 2012 and 2011.
Tri-State Optical Company reported the following amounts on its balance sheet at December 31, 2012 and 2011:
Requirement
1. Prepare a vertical analysis of Tri-State assets for 2012 and 2011.
Unlock Deck
Unlock for access to all 44 flashcards in this deck.
Unlock Deck
k this deck
14
Analyzing profitability
The CJ, Inc., comparative income statement follows. The 2010 data are given as needed.
Requirements
1. Calculate the rate of return on net sales.
2. Calculate the rate of return on total assets.
3. Calculate the asset turnover ratio.
4. Calculate the rate of return on common stockholders' equity.
5. Calculate the EPS.
6. Calculate the 2012 dividend payout on common stock.
7. Did the company's operating performance improve or deteriorate during 2012
Unlock Deck
Unlock for access to all 44 flashcards in this deck.
Unlock Deck
k this deck
15
Using ratios to evaluate a stock investment
This problem continues the Draper Consulting, Inc., situation from Problem 14-33 of Chapter 14.
Requirement
1. Using the results from Chapter 4, and knowing that the current market price of Draper's stock is $200 per share, calculate the following ratios for the company:
a. Current ratio
b. Debt ratio
c. Debt to equity ratio
d. Earnings per share
e. P/E ratio
f. Rate of return on total assets
g. Rate of return on common stockholders' equity
Unlock Deck
Unlock for access to all 44 flashcards in this deck.
Unlock Deck
k this deck
16
Common-size income statement
Data for Martinez, Inc., and Rosado, Corp., follow:
Requirements
1. Prepare common-size income statements.
2. Which company earns more net income
3. Which company's net income is a higher percentage of its net sales
Data for Martinez, Inc., and Rosado, Corp., follow:
Requirements
1. Prepare common-size income statements.
2. Which company earns more net income
3. Which company's net income is a higher percentage of its net sales
Unlock Deck
Unlock for access to all 44 flashcards in this deck.
Unlock Deck
k this deck
17
Evaluating a stock as an investment
Data for Shamrock State Bank follows:
Requirement
1. Evaluate the common stock of Shamrock State Bank as an investment. Specifically, use the four stock ratios to determine whether the common stock has increased or decreased in attractiveness during the past year.
Data for Shamrock State Bank follows:
Requirement
1. Evaluate the common stock of Shamrock State Bank as an investment. Specifically, use the four stock ratios to determine whether the common stock has increased or decreased in attractiveness during the past year.
Unlock Deck
Unlock for access to all 44 flashcards in this deck.
Unlock Deck
k this deck
18
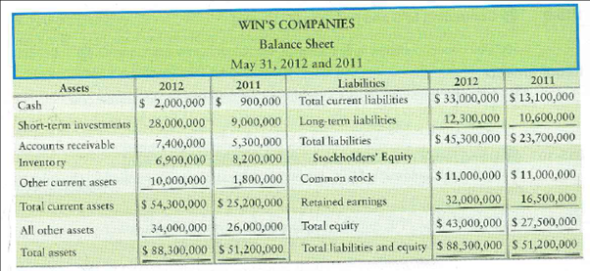
Evaluating current ratio
Win's Companies, a home improvement store chain, reported the following summarized figures:
Requirements
1. Compute Win's Companies' current ratio at May 31, 2012 and 2011.
2. Did Win's Companies' current ratio improve, deteriorate, or hold steady during 2012
Win's Companies, a home improvement store chain, reported the following summarized figures:
Requirements
1. Compute Win's Companies' current ratio at May 31, 2012 and 2011.
2. Did Win's Companies' current ratio improve, deteriorate, or hold steady during 2012
Unlock Deck
Unlock for access to all 44 flashcards in this deck.
Unlock Deck
k this deck
19
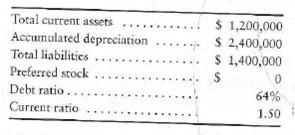
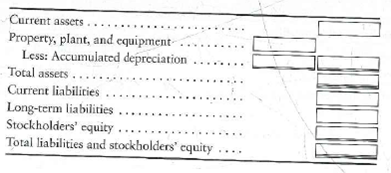
Using ratios to reconstruct a balance sheet
The following data are adapted from the financial statements of Betty's Shops, Inc.:
Requirement
1. Complete Betty's condensed balance sheet.
The following data are adapted from the financial statements of Betty's Shops, Inc.:
Requirement
1. Complete Betty's condensed balance sheet.
Unlock Deck
Unlock for access to all 44 flashcards in this deck.
Unlock Deck
k this deck
20
Computing inventory, gross profit, and receivables ratios
Use the Win's Companies data in Short Exercise 15-5 to complete the following requirements*
Requirements
1. Compute the rate of inventory turnover, days in inventory, and gross profit percentage for 2012.
2. Compute days' sales in average receivables during 2012. Round dollar amounts to three decimal places.
Unlock Deck
Unlock for access to all 44 flashcards in this deck.
Unlock Deck
k this deck
21
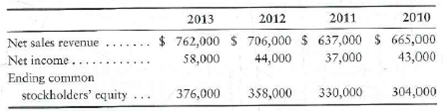
Trend analysis and return on common equity
Net sales revenue, net income, and common stockholders' equity for Azbel Mission Corporation, a manufacturer of contact lenses, follow for a four-year period.
Requirements
1. Compute trend analyses for each item for 2011-2013. Use 2010 as the base year, and round to the nearest whole percent.
2. Compute the rate of return on common stockholders' equity for 2011-2013, rounding to three decimal places.
Net sales revenue, net income, and common stockholders' equity for Azbel Mission Corporation, a manufacturer of contact lenses, follow for a four-year period.
Requirements
1. Compute trend analyses for each item for 2011-2013. Use 2010 as the base year, and round to the nearest whole percent.
2. Compute the rate of return on common stockholders' equity for 2011-2013, rounding to three decimal places.
Unlock Deck
Unlock for access to all 44 flashcards in this deck.
Unlock Deck
k this deck
22
Measuring ability to pay liabilities
Use the financial statements of Win's Companies in Short Exercise 15-5.
Requirements
1. Compute the debt ratio and the debt to equity ratio at May 31, 2012.
2. Is Win's ability to pay its liabilities strong or weak Explain your reasoning.
Use the financial statements of Win's Companies in Short Exercise 15-5.
Requirements
1. Compute the debt ratio and the debt to equity ratio at May 31, 2012.
2. Is Win's ability to pay its liabilities strong or weak Explain your reasoning.
Unlock Deck
Unlock for access to all 44 flashcards in this deck.
Unlock Deck
k this deck
23
Vertical analysis
The McConnell Department Stores, Inc., chief executive officer (CEO) has asked you to compare the company's profit performance and financial position with the average for the industry. The CEO has given you the company's income statement and balance sheet, as well as the industry average data for retailers.
Requirement
1. Prepare a vertical analysis for McConnell for both its income statement and balance sheet.
Unlock Deck
Unlock for access to all 44 flashcards in this deck.
Unlock Deck
k this deck
24
In 75 words or fewer, explain the difference between horizontal and vertical analysis. Be sure to include in your answer how each might be used.
Unlock Deck
Unlock for access to all 44 flashcards in this deck.
Unlock Deck
k this deck
25
Measuring profitability
Use the financial statements of Win's Companies in Short Exercise 15-5 to complete the following profitability measures for 2012.
Requirements
1. Compute the rate of return on net sales.
2. Compute the rate of return on total assets.
3. Compute the asset turnover ratio.
4. Compute the rate of return on common stockholders' equity.
5. Are these rates of return strong or weak Explain your reasoning.
Unlock Deck
Unlock for access to all 44 flashcards in this deck.
Unlock Deck
k this deck
26
Common-size statements, analysis of profitability and financial position, comparison with the industry, and using ratios to evaluate a company
Consider the data for McConnell Department Stores presented in P15-23A.
Requirements
1. Prepare a common-size income statement and balance sheet for McConnell. The first column of each statement should present McConnell's common-size statement, and the second column, the industry averages.
2. For the profitability analysis, compute McConnell's (a) gross profit percentage and (b) rate of return on net sales. Compare these figures with the industry averages. Is McConnell's profit performance better or worse than the industry average
3. For the analysis of financial position, compute McConnell's (a) current ratio and (b) debt to equity ratio. Compare these ratios with the industry averages. Is McConnell's financial position better or worse than the industry averages
Unlock Deck
Unlock for access to all 44 flashcards in this deck.
Unlock Deck
k this deck
27
Analyzing a Company for Its Investment Potential
In its annual report, WRS Athletic Supply, Inc., includes the following five-year financial summary.
Requirement
1. Analyze the company's financial summary for the fiscal years 2011-2015 to decide whether to invest in the common stock of WRS.. Include the following sections in your analysis, and fully explain your final decision.
a. Trend analysis for net sales and net income (use 2011 as the base year).
b. Profitability analysis.
c. Evaluate the ability to sell inventory (WRS uses the LIFO method).
d. Evaluate the ability to pay debts.
e. Evaluate the dividends.
Unlock Deck
Unlock for access to all 44 flashcards in this deck.
Unlock Deck
k this deck
28
Computing EPS and P/E ratio
Use the financial statements of Win's Companies in Short Exercise 15-5. Win's has 500,000 common shares outstanding during 2012.
Requirements
1. Compute earnings per share (EPS) for Win's. Round to the nearest cent.
2. Compute Win's Companies' price/earnings ratio. The market price per share of Win's stock is $68.50.
Unlock Deck
Unlock for access to all 44 flashcards in this deck.
Unlock Deck
k this deck
29
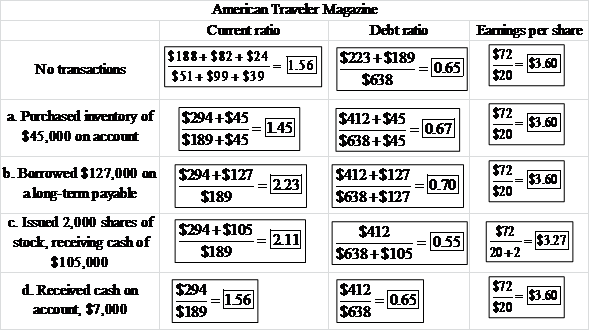
Effects of business transactions on selected ratios
Financial statement data of American Traveler Magazine include the following items:
Requirements
1. Compute American Traveler's current ratio, debt ratio, and earnings per share. Round all ratios to two decimal places, and use the following format for your answer:
2. Compute the three ratios after evaluating the effect of each transaction that follows. Consider each transaction separately.
a. Purchased inventory of $49,000 on account.
b. Borrowed $122,000 on a long-term note payable.
c. Issued 6,000 shares of common stock, receiving cash of $103,000.
d. Received cash on account, $3,000.
Unlock Deck
Unlock for access to all 44 flashcards in this deck.
Unlock Deck
k this deck
30
ABC and XYZ companies both had a bad year in 2010; the companies' suffered net losses. Due to the losses, some of the measures of return deteriorated for both companies. Assume top management of ABC and XYZ are pondering ways to improve their ratios for the following year. In particular, management is considering the following transactions:
1. Borrow $100 million on long-term debt.
2. Purchase treasury stock for $500 million cash.
3. Expense one-fourth of the goodwill carried on the books.
4. Create a new design division at a cash cost of $300 million.
5. Purchase patents from Johnson, Co., paying $20 million cash.
Requirement
1. Top management wants to know the effects of these transactions (increase, decrease, or no effect) on the following ratios:
a. Current ratio
b. Debt ratio
c. Rate of return on common stockholders' equity
Unlock Deck
Unlock for access to all 44 flashcards in this deck.
Unlock Deck
k this deck
31
Using ratios to reconstruct an income statement
A skeleton of Landmark Mills' income statement appears as follows (amounts in thousands):
Requirement
1. Use the following ratio data to complete Landmark Mills' income statement:
a. Inventory turnover was 3.50 (beginning inventory was $850; ending inventory was $810).
b. Rate of return on net sales is 0.11.
Unlock Deck
Unlock for access to all 44 flashcards in this deck.
Unlock Deck
k this deck
32
Using ratios to evaluate a stock investment
Comparative financial statement data of Danfield, Inc., follow:
1. Market price of Danfield's common stock: $86.58 at December 31, 2012, and $46.54 at December 31, 2011.
2. Common shares outstanding: 12,000 during 2012 and 10,000 during 2011 and 2010.
3. All sales on credit.
Requirements
1. Compute the following ratios for 2012 and 2011:
a. Current ratio
b. Times-interest-earned ratio
c. Inventory turnover
d. Gross profit percentage
e. Debt to equity ratio
f. Rate of return on common stockholders' equity
g. Earnings per share of common stock
h. Price/earnings ratio
2. Decide (a) whether Danfield's ability to pay debts and to sell inventory improved or deteriorated during 2012 and (b) whether the investment attractiveness of its common stock appears to have increased or decreased.
Unlock Deck
Unlock for access to all 44 flashcards in this deck.
Unlock Deck
k this deck
33
Ross's Ripstick Company's long-term debt agreements make certain demands on the business. For example, Ross may not purchase treasury stock in excess of the balance of retained earnings. Also, long-term debt may not exceed stockholders' equity, and the current ratio may not fall below 1.50. If Ross fails to meet any of these requirements, the company's lenders have the authority to take over management of the company.
Changes in consumer demand have made it hard for Ross to attract customers. Current liabilities have mounted faster than current assets, causing the current ratio to fall to 1.47. Before releasing financial statements, Ross's management is scrambling to improve the current ratio. The controller points out that an investment can be classified as either long-term or short-term, depending on management's intention. By deciding to convert an investment to cash within one year, Ross can classify the investment as short-term-a current asset. On the controller's recommendation, Ross's board of directors votes to reclassify long-term investments as short-term.
Requirements
1. What effect will reclassifying the investments have on the current ratio Is Ross's true financial position stronger as a result of reclassifying the investments
2. Shortly after the financial statements are released, sales improve; so, too, does the current ratio. As a result, Ross's management decides not to sell the investments it had reclassified as short-term. Accordingly, the company reclassifies the investments as long-term. Has management behaved unethically Give the reasoning underlying your answer.
Unlock Deck
Unlock for access to all 44 flashcards in this deck.
Unlock Deck
k this deck
34
Using ratios to reconstruct a balance sheet
A skeleton of Vintage Mills' balance sheet appears as follows (amounts in thousands):
Requirement
1. Use the following ratio data to complete Vintage Mills' balance sheet.
a. Current ratio is 0.80.
b. Acid-test ratio is 0.40.
A skeleton of Vintage Mills' balance sheet appears as follows (amounts in thousands):
Requirement
1. Use the following ratio data to complete Vintage Mills' balance sheet.
a. Current ratio is 0.80.
b. Acid-test ratio is 0.40.
Unlock Deck
Unlock for access to all 44 flashcards in this deck.
Unlock Deck
k this deck
35
Using ratios to decide between two stock investments
Assume that you are purchasing an investment and have decided to invest in a company in the digital phone business. You have narrowed the choice to Digitalized, Corp., and Zone Network, Inc., and have assembled the following data:
Selected income statement data for the current year:
Selected balance sheet and market price data at the end of the current year:
Selected balance sheet data at the beginning of the current year:
Your strategy is to invest in companies that have low price/earnings ratios but appear to be in good shape financially. Assume that you have analyzed all other factors and that your decision depends on the results of ratio analysis.
Requirement
1. Compute the following ratios for both companies for the current year, and decide which company's stock better fits your investment strategy.
a. Acid-test ratio
b. Inventory turnover
c. Days' sales in receivables
d. Debt ratio
e. Earnings per share of common stock
f. Price/earnings ratio
g. Dividend payout
Unlock Deck
Unlock for access to all 44 flashcards in this deck.
Unlock Deck
k this deck
36
Allen Software was a relatively new tech company led by aggressive founder Benjamin Allen. His strategy relied not so much on producing new products as using new equity capital to buy up other software companies. To keep attracting investors, Allen had to show year-to-year revenue growth. When his normal revenue streams stalled, he resorted to the tried and true "channel stuffing" technique. First, he improperly recorded shipments to his distributors as sales revenue, shipments that far exceeded the market demand for his products. Then he offered the distributors large payments to hold the excess inventory instead of returning it for a refund. Those payments were disguised as sales promotion expenses. He was able to show a considerable growth in revenues for two years running until one savvy investor group started asking questions. That led to a complaint filed with the SEC (Securities and Exchange Commission). The company is now in bankruptcy and several criminal cases are pending.
Requirements
1. What factor may have tipped off the investor group that something was wrong
2. In what way would those investors have been harmed
3. If Allen had attracted enough equity capital, do you think he would have been able to conceal the scheme
Requirements
1. What factor may have tipped off the investor group that something was wrong
2. In what way would those investors have been harmed
3. If Allen had attracted enough equity capital, do you think he would have been able to conceal the scheme
Unlock Deck
Unlock for access to all 44 flashcards in this deck.
Unlock Deck
k this deck
37
Computing working capital changes
Data for Beverage Enterprises follows:
Requirement
1. Compute the dollar amount of change and the percentage of change in Beverage Enterprises' working capital each year during 2011 and 2012. What do the calculated changes indicate
Data for Beverage Enterprises follows:
Requirement
1. Compute the dollar amount of change and the percentage of change in Beverage Enterprises' working capital each year during 2011 and 2012. What do the calculated changes indicate
Unlock Deck
Unlock for access to all 44 flashcards in this deck.
Unlock Deck
k this deck
38
Trend analyses and return on common equity
Net sales revenue, net income, and common stockholders' equity for Shawnee Mission Corporation, a manufacturer of contact lenses, follow for a four-year period.
Requirements
1. Compute trend analyses for each item for 2011-2013. Use 2010 as the base year, and round to the nearest whole percent.
2. Compute the rate of return on common stockholders' equity for 2011-2013, rounding to three decimal places.
Net sales revenue, net income, and common stockholders' equity for Shawnee Mission Corporation, a manufacturer of contact lenses, follow for a four-year period.
Requirements
1. Compute trend analyses for each item for 2011-2013. Use 2010 as the base year, and round to the nearest whole percent.
2. Compute the rate of return on common stockholders' equity for 2011-2013, rounding to three decimal places.
Unlock Deck
Unlock for access to all 44 flashcards in this deck.
Unlock Deck
k this deck
39
Amazon.com's financial statements in Appendix A at the end of this book reveal some interest-ing relationships. Answer these questions about Amazon :
Requirements
1. Compute trend analyses for net sales and net income. Use 2007 as the base year. What is the most notable aspect of this data
2. Compute inventory turnover for 2009 and 2008. The inventory balance at December 31, 2009, was $2,171 million. Do the trend of net income from 2008 to 2009 and the change in the rate of inventory turnover tell the same story or a different story Explain your answer.
Unlock Deck
Unlock for access to all 44 flashcards in this deck.
Unlock Deck
k this deck
40
Horizontal analysis-income statement
Data for Mariner Designs, Inc., follow:
Requirements
1. Prepare a horizontal analysis of the comparative income statement of Mariner Designs, Inc. Round percentage changes to one decimal place.
2. Why did 2012 net income increase by a higher percentage than net sales revenue
Data for Mariner Designs, Inc., follow:
Requirements
1. Prepare a horizontal analysis of the comparative income statement of Mariner Designs, Inc. Round percentage changes to one decimal place.
2. Why did 2012 net income increase by a higher percentage than net sales revenue
Unlock Deck
Unlock for access to all 44 flashcards in this deck.
Unlock Deck
k this deck
41
Vertical analysis
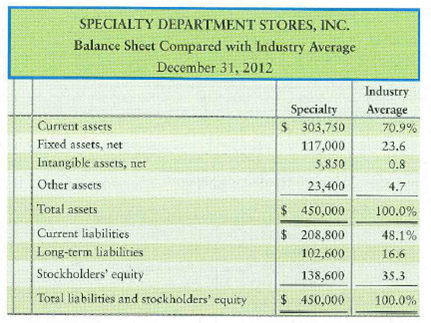
The Specialty Department Stores, Inc., chief executive officer (CEO) has asked you to compare the company's profit performance and financial position with the average for the industry. The CEO has given you the company's income statement and balance sheet, as well as the industry average data for retailers.
Requirement
1. Prepare a vertical analysis for Specialty for both its income statement and balance sheet.
Unlock Deck
Unlock for access to all 44 flashcards in this deck.
Unlock Deck
k this deck
42
Horizontal analysis
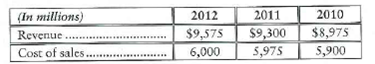
McCormick, Corp., reported the following on its comparative income statement:
Requirement
1. Prepare a horizontal analysis of revenues and gross profit-both in dollar amounts and in percentages-for 2012 and 2011.
McCormick, Corp., reported the following on its comparative income statement:
Requirement
1. Prepare a horizontal analysis of revenues and gross profit-both in dollar amounts and in percentages-for 2012 and 2011.
Unlock Deck
Unlock for access to all 44 flashcards in this deck.
Unlock Deck
k this deck
43
Computing trend analysis
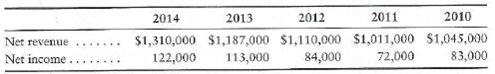
Magic Oaks Realty's net revenue and net income for the following five-year period, using 2010 as the base year, follow:
Requirements
1. Compute trend analysis for net revenue and net income. Round to the nearest full percent.
2. Which grew faster during the period, net revenue or net income
Magic Oaks Realty's net revenue and net income for the following five-year period, using 2010 as the base year, follow:
Requirements
1. Compute trend analysis for net revenue and net income. Round to the nearest full percent.
2. Which grew faster during the period, net revenue or net income
Unlock Deck
Unlock for access to all 44 flashcards in this deck.
Unlock Deck
k this deck
44
Common-size statements, analysis of profitability and financial position, comparison with the industry, and using ratios to evaluate a company
Consider the data for Specialty Department Stores presented in P15-29B.
Requirements
1. Prepare a common-size income statement and balance sheet for Specialty. The first column of each statement should present Specialty's common-size statement, and the second column, the industry averages.
2. For the profitability analysis, compute Specialty's (a) gross profit percentage and (b) rate of return on net sales. Compare these figures with the industry averages. Is Specialty's profit performance better or worse than the industry average
3. For the analysis of financial position, compute Specialty's (a) current ratio and (b) debt to equity. Compare these ratios with the industry averages. Is Specialty's financial position better or worse than the industry averages
Unlock Deck
Unlock for access to all 44 flashcards in this deck.
Unlock Deck
k this deck
Unlock Deck
Unlock for access to all 44 flashcards in this deck.


