Deck 16: Monetary Policy: Goals and Tradeoffs
Full screen (f)
Question
Question
Question
Consider three alternative policies, each with a different set of outcomes in terms of output and inflation, as shown in the following table:
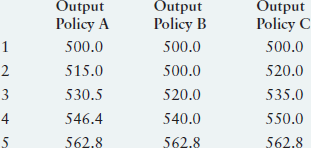
Potential output is 500 in period 1 and rises 3 percent per year. The Fed's objective function is
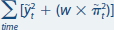
where w = 1, and the inflation target is 2.0 percent.
a Calculate the value of the objective function over the five-year period for each of the three policies.
b Which policy is best Why Which policy is worst
c Would your answer to part b change if w = 5 Explain.
Potential output is 500 in period 1 and rises 3 percent per year. The Fed's objective function is
where w = 1, and the inflation target is 2.0 percent.
a Calculate the value of the objective function over the five-year period for each of the three policies.
b Which policy is best Why Which policy is worst
c Would your answer to part b change if w = 5 Explain.
Question
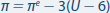
The relationship between infl ation and unemployment is given by
a Graph the long-run Phillips curve and three different short-run Phillips curves.
b What is the value of the natural rate of unemployment
c If actual infl ation is 2 percent and expected infl ation is 5 percent, what is the unemployment rate
d If actual infl ation is 8 percent and expected infl ation is 5 percent, what is the unemployment rate
Question
Question
Question
Question
Question
Question
Question
Question
Question
Question
Question
Question

Unlock Deck
Sign up to unlock the cards in this deck!
Unlock Deck
Unlock Deck
1/16
Play
Full screen (f)
Deck 16: Monetary Policy: Goals and Tradeoffs
1
What caused the increase in infl ation in the 1960s and 1970s
The relationship between inflation and unemployment rate is given by the Phillips curve. The Phillips curve suggests that there exists a negative tradeoff between inflation and unemployment. The Phillips curve can be represented as
 Here, p is the inflation rate and U is the unemployment rate, and a, ß are parameters.
However, after 1960s the tradeoff between inflation and unemployment ceased to exists. This is because people started incorporating the expected inflation rate into their decision making. As the people expect the inflation rate to be higher in the future, they demand a higher nominal wage rate. This decreases the demand for labor and unemployment increases in the market. Hence, with same inflation rate we have higher unemployment; this means the Phillips curve shifted upward. Each time the expected inflation rate gets revised, the cure shifted upward giving practically no tradeoff between inflation and unemployment in the long run.
This is shown in the figure below; initially the economy was on P1, with actual inflation rate equal to expected rate and the economy was at A. Then, the Fed increases the supply of money. This prompted the individuals to expect a higher inflation rate. The short run Phillips curve shifted upward. The economy moves to B with lower unemployment and higher inflation. As inflation rises, the demand for goods falls, the producers faces a falling demand and cut back its production. The firm laid off some worker for this and unemployment increases in the economy. The economy moves to C, a point on long run supply curve, with higher inflation and same unemployment as in A.
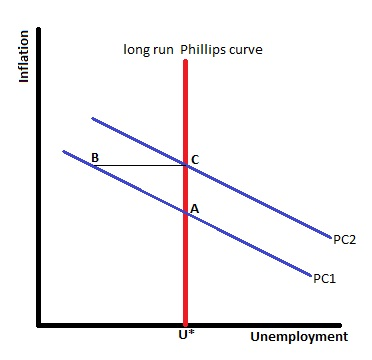 Figure 1
In 1970s and 1960s when Fed tried to exploit the relationship between two variable, the expected inflation get revised and the short run Phillips curve shifted upward. This increases the inflation rate in the short run and decreases unemployment. However, in the long run the unemployment gets back to its earlier level with a higher inflation rate. The change in money supply prompted individuals to expect higher inflation rate and the short run Phillips curve shifted upward and inflation rate increases in the long run.
Here, p is the inflation rate and U is the unemployment rate, and a, ß are parameters.However, after 1960s the tradeoff between inflation and unemployment ceased to exists. This is because people started incorporating the expected inflation rate into their decision making. As the people expect the inflation rate to be higher in the future, they demand a higher nominal wage rate. This decreases the demand for labor and unemployment increases in the market. Hence, with same inflation rate we have higher unemployment; this means the Phillips curve shifted upward. Each time the expected inflation rate gets revised, the cure shifted upward giving practically no tradeoff between inflation and unemployment in the long run.
This is shown in the figure below; initially the economy was on P1, with actual inflation rate equal to expected rate and the economy was at A. Then, the Fed increases the supply of money. This prompted the individuals to expect a higher inflation rate. The short run Phillips curve shifted upward. The economy moves to B with lower unemployment and higher inflation. As inflation rises, the demand for goods falls, the producers faces a falling demand and cut back its production. The firm laid off some worker for this and unemployment increases in the economy. The economy moves to C, a point on long run supply curve, with higher inflation and same unemployment as in A.
Figure 1In 1970s and 1960s when Fed tried to exploit the relationship between two variable, the expected inflation get revised and the short run Phillips curve shifted upward. This increases the inflation rate in the short run and decreases unemployment. However, in the long run the unemployment gets back to its earlier level with a higher inflation rate. The change in money supply prompted individuals to expect higher inflation rate and the short run Phillips curve shifted upward and inflation rate increases in the long run.
2
Where is the Phillips curve now compared with its location in the 1970s and 1980s
The relationship between inflation and unemployment rate is given by the Phillips curve. The Phillips curve suggests that there exists a negative tradeoff between inflation and unemployment. The Phillips curve can be represented as
 Here, p is the inflation rate and U is the unemployment rate, and a, ß are parameters.
However, after 1960s the tradeoff between inflation and unemployment ceased to exists. This is because people started incorporating the expected inflation rate into their decision making. As the people expect the inflation rate to be higher in the future, they demand a higher nominal wage rate. This decreases the demand for labor and unemployment increases in the market. Hence, with same inflation rate we have higher unemployment; this means the Phillips curve shifted upward. Each time the expected inflation rate gets revised, the cure shifted upward giving practically no tradeoff between inflation and unemployment in the long run.
This is shown in the figure below; initially the economy was on P1, with actual inflation rate equal to expected rate and the economy was at A. Then, the Fed increases the supply of money. This prompted the individuals to expect a higher inflation rate. The short run Phillips curve shifted upward. The economy moves to B with lower unemployment and higher inflation. As inflation rises, the demand for goods falls, the producers faces a falling demand and cut back its production. The firm laid off some worker for this and unemployment increases in the economy. The economy moves to C, a point on long run supply curve, with higher inflation and same unemployment as in A.
 Figure
In 1970s and 1960s when Fed tried to exploit the relationship between two variable, the expected inflation get revised and the short run Phillips curve shifted upward. This increases the inflation rate in the short run and decreases unemployment. However, in the long run the unemployment gets back to its earlier level with a higher inflation rate. The change in money supply prompted individuals to expect higher inflation rate and the short run Phillips curve shifted upward and inflation rate increases in the long run.
The short run Phillips curve shifted upward from its 1965 level to 1975 giving a higher inflation rate. It shifted downward in 1984 and remained there until 1996. After that it again shifted downward given an even lower inflation rate. The short run Phillips curve is at that level until now.
Here, p is the inflation rate and U is the unemployment rate, and a, ß are parameters.However, after 1960s the tradeoff between inflation and unemployment ceased to exists. This is because people started incorporating the expected inflation rate into their decision making. As the people expect the inflation rate to be higher in the future, they demand a higher nominal wage rate. This decreases the demand for labor and unemployment increases in the market. Hence, with same inflation rate we have higher unemployment; this means the Phillips curve shifted upward. Each time the expected inflation rate gets revised, the cure shifted upward giving practically no tradeoff between inflation and unemployment in the long run.
This is shown in the figure below; initially the economy was on P1, with actual inflation rate equal to expected rate and the economy was at A. Then, the Fed increases the supply of money. This prompted the individuals to expect a higher inflation rate. The short run Phillips curve shifted upward. The economy moves to B with lower unemployment and higher inflation. As inflation rises, the demand for goods falls, the producers faces a falling demand and cut back its production. The firm laid off some worker for this and unemployment increases in the economy. The economy moves to C, a point on long run supply curve, with higher inflation and same unemployment as in A.
Figure In 1970s and 1960s when Fed tried to exploit the relationship between two variable, the expected inflation get revised and the short run Phillips curve shifted upward. This increases the inflation rate in the short run and decreases unemployment. However, in the long run the unemployment gets back to its earlier level with a higher inflation rate. The change in money supply prompted individuals to expect higher inflation rate and the short run Phillips curve shifted upward and inflation rate increases in the long run.
The short run Phillips curve shifted upward from its 1965 level to 1975 giving a higher inflation rate. It shifted downward in 1984 and remained there until 1996. After that it again shifted downward given an even lower inflation rate. The short run Phillips curve is at that level until now.
3
Consider three alternative policies, each with a different set of outcomes in terms of output and inflation, as shown in the following table:
Potential output is 500 in period 1 and rises 3 percent per year. The Fed's objective function is
where w = 1, and the inflation target is 2.0 percent.
a Calculate the value of the objective function over the five-year period for each of the three policies.
b Which policy is best Why Which policy is worst
c Would your answer to part b change if w = 5 Explain.
NO ANSWER
4
The relationship between infl ation and unemployment is given by
a Graph the long-run Phillips curve and three different short-run Phillips curves.
b What is the value of the natural rate of unemployment
c If actual infl ation is 2 percent and expected infl ation is 5 percent, what is the unemployment rate
d If actual infl ation is 8 percent and expected infl ation is 5 percent, what is the unemployment rate
a Graph the long-run Phillips curve and three different short-run Phillips curves.
b What is the value of the natural rate of unemployment
c If actual infl ation is 2 percent and expected infl ation is 5 percent, what is the unemployment rate
d If actual infl ation is 8 percent and expected infl ation is 5 percent, what is the unemployment rate
Unlock Deck
Unlock for access to all 16 flashcards in this deck.
Unlock Deck
k this deck
5
Policymaking is much easier when the state of the economy is easily observable than when there is uncertainty about how the economy is doing, as this problem illustrates. Suppose that the economy is either in an expansion or a recession. Suppose that in an expansion, monetary policy ideally sets the interest rate on federal funds (loans between banks) at 6 percent, whereas if the economy is in a recession, the federal funds rate is ideally set at 2 percent. If monetary policymakers know the state of the economy when they set policy, then policymaking is easy-set the fed funds rate at 6 percent when in expansion and at 2 percent when in recession. Suppose, however, that policymakers cannot easily observe the current state of the economy. They know only what the state of the economy was three months ago. Suppose that if the economy was in an expansion three months ago, there is a 90 percent chance the economy is still in an expansion (and thus a 10 percent chance that it is now in a recession). And suppose that if the economy was in a recession three months ago, there is a 75 percent chance that it is still in a recession (and a 25 percent chance that it is now in an expansion). Given these probabilities, what would you guess is the right setting for the federal funds rate if the economy was in a recession three months ago What is the right setting for the federal funds rate if the economy was in an expansion three months ago ( Note: To answer these questions, you must make an assumption about the ideal federal funds rate when you do not know what the state of the economy is-you may make any reasonable assumption you want, but you must justify it.)
Unlock Deck
Unlock for access to all 16 flashcards in this deck.
Unlock Deck
k this deck
6
Why doesn't the Fed simply keep increasing the growth rate of the money supply at faster and faster rates to drive the unemployment rate lower and lower Wouldn't the gains in terms of faster output growth far exceed the losses from infl ation
Unlock Deck
Unlock for access to all 16 flashcards in this deck.
Unlock Deck
k this deck
7
A new Fed governor argues during FOMC meetings that the Fed has not suffi ciently achieved the goal of helping the economy reach its potential level of output. She asks the committee to be more aggressive, using expansionary monetary policy to increase the growth rate of output. What are the likely consequences of such a policy Illustrate your answer using the expectationsaugmented Phillips curve.
Unlock Deck
Unlock for access to all 16 flashcards in this deck.
Unlock Deck
k this deck
8
Suppose that the members of the FOMC agree about the state of the economy at any time but have widely different views about the weight that should be placed on infl ation in the Fed's objective function. How is monetary policy likely to be determined
Unlock Deck
Unlock for access to all 16 flashcards in this deck.
Unlock Deck
k this deck
9
What is the main goal of stabilization policy If successful, what does stabilization policy do
Unlock Deck
Unlock for access to all 16 flashcards in this deck.
Unlock Deck
k this deck
10
Why might stabilization policy lead to an outcome that is worse than if the Fed used neutral monetary policy
Unlock Deck
Unlock for access to all 16 flashcards in this deck.
Unlock Deck
k this deck
11
Describe the major goals of the Fed and how well they have been achieved in the past 20 years.
Unlock Deck
Unlock for access to all 16 flashcards in this deck.
Unlock Deck
k this deck
12
What is the output gap Is it measured precisely
Unlock Deck
Unlock for access to all 16 flashcards in this deck.
Unlock Deck
k this deck
13
What is the unemployment gap How is it related to the output gap
Unlock Deck
Unlock for access to all 16 flashcards in this deck.
Unlock Deck
k this deck
14
What is the infl ation gap What is the ideal infl ation rate Is there widespread agreement about the value of the ideal infl ation rate
Unlock Deck
Unlock for access to all 16 flashcards in this deck.
Unlock Deck
k this deck
15
Describe the Fed's objective function and how it can be used with an economic model to evaluate alternative monetary policies.
Unlock Deck
Unlock for access to all 16 flashcards in this deck.
Unlock Deck
k this deck
16
Why didn't policy based on the Phillips curve work to help the Fed reduce the unemployment rate to a lower level than before What happened in the 1970s as the Fed tried to take advantage of the tradeoff between infl ation and unemployment
Unlock Deck
Unlock for access to all 16 flashcards in this deck.
Unlock Deck
k this deck
Unlock Deck
Unlock for access to all 16 flashcards in this deck.


