Deck 7: Economic Growth: Malthus and Solow
Full screen (f)
Question
Question
Question
Question
Question
Question
Question
Question
Question
Question
Question
Question
Question
Question
Question
Question
Question
Question
Question
Question
Question
Question
Question
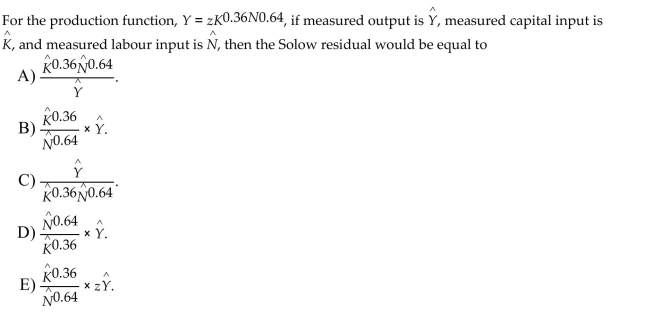
In Solow's model of economic growth, suppose that s represents the savings rate, z represents total factor productivity, k represents the level of capital per worker, and  represents the per worker
Production function. Also suppose that n represents the population growth rate and d represents
The depreciation rate of capital. The equilibrium level of capital per worker, *, will satisfy the
Equation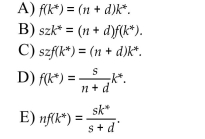
represents the per workerProduction function. Also suppose that n represents the population growth rate and d represents
The depreciation rate of capital. The equilibrium level of capital per worker,
*, will satisfy theEquation
Question
Question
Question
Question
Question
Question
Question
Question
Question
Question
Question
Question
Question
Question
Question
Question
Question
Question
Question
Question
Question
Question
Question
Question
Question
Question
Question
Question
Question
Question
Question
Question
Question
Question
Question
Question
Question
Question
Question
Question
Question
Question
Question

Unlock Deck
Sign up to unlock the cards in this deck!
Unlock Deck
Unlock Deck
1/66
Play
Full screen (f)
Deck 7: Economic Growth: Malthus and Solow
1
When capital is accumulated at the rate that maximizes consumption per worker in the steady state, the marginal product of capital is equal to the
A)savings rate plus the population growth rate.
B)savings rate divided by the marginal product of labour.
C)depreciation rate plus the savings rate.
D)population growth rate plus the depreciation rate.
E)consumption per worker plus the population growth rate.
A)savings rate plus the population growth rate.
B)savings rate divided by the marginal product of labour.
C)depreciation rate plus the savings rate.
D)population growth rate plus the depreciation rate.
E)consumption per worker plus the population growth rate.
D
2
The Solow model suggests that, to improve a country's standard of living in the long run
A)production technology must become more efficient.
B)standards of living must increase.
C)more natural resources must be found.
D)total factor productivity must decline.
E)people have to be more educated.
A)production technology must become more efficient.
B)standards of living must increase.
C)more natural resources must be found.
D)total factor productivity must decline.
E)people have to be more educated.
A
3
In the Malthusian model, when z increases, initially consumption
A)increases and remains above the original steady state level forever.
B)increases and then falls to its steady state level.
C)decreases and remains below the original steady state level forever.
D)decreases and then increases to its steady state level.
E)is unaffected by the change in z.
A)increases and remains above the original steady state level forever.
B)increases and then falls to its steady state level.
C)decreases and remains below the original steady state level forever.
D)decreases and then increases to its steady state level.
E)is unaffected by the change in z.
B
4
In the United States, the skill premium has contributed to
A)a broken Phillips curve.
B)a decline in the Gini coefficient.
C)a decrease in income inequality since the 1980s.
D)an increase in income inequality since the 1980s.
E)an increase in the labour share of income since the 1980s.
A)a broken Phillips curve.
B)a decline in the Gini coefficient.
C)a decrease in income inequality since the 1980s.
D)an increase in income inequality since the 1980s.
E)an increase in the labour share of income since the 1980s.
Unlock Deck
Unlock for access to all 66 flashcards in this deck.
Unlock Deck
k this deck
5
In Canada during the 1870-2017 period, the average annual growth in per capita income
A)rose with total factor productivity.
B)remained constant until World War II.
C)remained steady at about 2%.
D)fluctuated substantially.
E)rose with the population growth.
A)rose with total factor productivity.
B)remained constant until World War II.
C)remained steady at about 2%.
D)fluctuated substantially.
E)rose with the population growth.
Unlock Deck
Unlock for access to all 66 flashcards in this deck.
Unlock Deck
k this deck
6
Recent evidence suggests that the level of output per worker is
A)positively correlated with the growth rate in output per worker.
B)positively correlated with the rate of population growth.
C)negatively correlated with the rate of population growth.
D)negatively correlated with growth rate in output per worker.
E)not correlated with the growth rate in output per worker.
Unlock Deck
Unlock for access to all 66 flashcards in this deck.
Unlock Deck
k this deck
7
Long-run growth in the standard of living in the Solow growth model is explained by
A)consumption spending.
B)technological change.
C)growth in the capital stock.
D)a decline in the importance of the government sector.
E)growth in government.
A)consumption spending.
B)technological change.
C)growth in the capital stock.
D)a decline in the importance of the government sector.
E)growth in government.
Unlock Deck
Unlock for access to all 66 flashcards in this deck.
Unlock Deck
k this deck
8
In the steady state of Solow's exogenous growth model, an increase in the population growth rate
A)increases output per worker and increases capital per worker.
B)decreases output per worker and increases capital per worker.
C)decreases output per worker and decreases capital per worker.
D)increases output per worker and decreases capital per worker.
E)decreases output per worker and the marginal product of labour.
Unlock Deck
Unlock for access to all 66 flashcards in this deck.
Unlock Deck
k this deck
9
In the Malthusian model, the steady state effects of an increase in z are to
A)increase the quantity of land per worker, increase the population, and leave consumption per worker unchanged.
B)decrease the quantity of land per worker, increase the population, and increase consumption per worker.
C)shift the production function upwards, but leave the steady state unchanged.
D)decrease the quantity of land per worker, decrease the population, and leave consumption per worker unchanged.
E)decrease the quantity of land per worker, increase the population, and leave consumption per worker unchanged.
Unlock Deck
Unlock for access to all 66 flashcards in this deck.
Unlock Deck
k this deck
10
In the steady state of Solow's exogenous growth model, an increase in the savings rate
A)decreases output per worker and increases capital per worker.
B)decreases output per worker and decreases capital per worker.
C)increases output per worker and decreases capital per worker.
D)increases output per worker and increases capital per worker.
E)increases output per worker, reduces consumption per worker and decreases capital per worker.
Unlock Deck
Unlock for access to all 66 flashcards in this deck.
Unlock Deck
k this deck
11
Growth accounting attributes growth in real GDP to
A)international trade.
B)the savings rate and population growth.
C)growth in consumption expenditure, investment expenditure, and government expenditure.
D)growth in the capital and labour inputs to production, and growth in total factor productivity.
E)government programs that increase research and development.
Unlock Deck
Unlock for access to all 66 flashcards in this deck.
Unlock Deck
k this deck
12
Unlock Deck
Unlock for access to all 66 flashcards in this deck.
Unlock Deck
k this deck
13
The golden rule savings rate is achieved when capital is accumulated at a rate that
A)population growth exceeds the depreciation rate.
B)keeps consumption per worker constant in the steady state.
C)minimizes consumption per worker in the steady state.
D)maximizes consumption per worker in the steady state.
E)minimizes the effects of consumption growth on population growth.
A)population growth exceeds the depreciation rate.
B)keeps consumption per worker constant in the steady state.
C)minimizes consumption per worker in the steady state.
D)maximizes consumption per worker in the steady state.
E)minimizes the effects of consumption growth on population growth.
Unlock Deck
Unlock for access to all 66 flashcards in this deck.
Unlock Deck
k this deck
14
The idea that an improvement in technology causes an increase in population but causes no increase in the average standard of living is attributed to
A)Robert Lucas.
B)Thomas Malthus.
C)Robert Solow.
D)Adam Smith.
E)Milton Friedman.
A)Robert Lucas.
B)Thomas Malthus.
C)Robert Solow.
D)Adam Smith.
E)Milton Friedman.
Unlock Deck
Unlock for access to all 66 flashcards in this deck.
Unlock Deck
k this deck
15
Countries in which a relatively small fraction of output is channeled into investment tend to have a
A)relatively high level of government spending.
B)relatively low standard of living.
C)relatively high level of capital stock.
D)relatively high rate of consumption.
E)relatively low rate of population growth.
A)relatively high level of government spending.
B)relatively low standard of living.
C)relatively high level of capital stock.
D)relatively high rate of consumption.
E)relatively low rate of population growth.
Unlock Deck
Unlock for access to all 66 flashcards in this deck.
Unlock Deck
k this deck
16
Malthus was too pessimistic because he did not foresee the effects of
A)ever increasing amounts of land for cultivation.
B)improved nutrition and health care.
C)improved family planning practices.
D)increases in the capital stock and the effects of such increases on production.
E)increase productivity of land.
A)ever increasing amounts of land for cultivation.
B)improved nutrition and health care.
C)improved family planning practices.
D)increases in the capital stock and the effects of such increases on production.
E)increase productivity of land.
Unlock Deck
Unlock for access to all 66 flashcards in this deck.
Unlock Deck
k this deck
17
The Lorenz curve illustrates
A)the distribution of income in a country.
B)the capital share of income across countries.
C)the relationship between the level of per capital income and the population growth rate.
D)the same thing as the Phillips curve tradeoff.
E)the time series of the GDP per capita.
A)the distribution of income in a country.
B)the capital share of income across countries.
C)the relationship between the level of per capital income and the population growth rate.
D)the same thing as the Phillips curve tradeoff.
E)the time series of the GDP per capita.
Unlock Deck
Unlock for access to all 66 flashcards in this deck.
Unlock Deck
k this deck
18
Growth accounting, popularized by Robert Solow, attempts to attribute a change in aggregate output
A)separately between changes in total factor productivity and changes in the supplies of factors of production.
B)separately between changes in total factor productivity and changes in government policy.
C)separately between changes in the supplies of factors of production and changes in government policy.
D)to its most important single cause.
E)separately between changes in government policy and changes in total factor productivity.
Unlock Deck
Unlock for access to all 66 flashcards in this deck.
Unlock Deck
k this deck
19
In Solow's exogenous growth model, the principal obstacle to continuous growth in output per capita is due to
A)not enough consumption per worker.
B)limits in the ability of government policy makers.
C)too little savings.
D)the declining marginal product of labour.
E)the declining marginal product of capital.
A)not enough consumption per worker.
B)limits in the ability of government policy makers.
C)too little savings.
D)the declining marginal product of labour.
E)the declining marginal product of capital.
Unlock Deck
Unlock for access to all 66 flashcards in this deck.
Unlock Deck
k this deck
20
The Malthusian model performs poorly in explaining economic growth after the
A)American Revolution.
B)French Revolution.
C)Industrial Revolution.
D)Bio-technology Revolution.
E)Second World War.
A)American Revolution.
B)French Revolution.
C)Industrial Revolution.
D)Bio-technology Revolution.
E)Second World War.
Unlock Deck
Unlock for access to all 66 flashcards in this deck.
Unlock Deck
k this deck
21
The Golden Rule Quantity of capital per worker maximizes the steady-state level of
A)savings per worker.
B)output per worker.
C)capital per worker.
D)consumption per worker.
E)investment per worker.
A)savings per worker.
B)output per worker.
C)capital per worker.
D)consumption per worker.
E)investment per worker.
Unlock Deck
Unlock for access to all 66 flashcards in this deck.
Unlock Deck
k this deck
22
Growth in real GDP per-capita in Canada is roughly consistent with which of the following predictions of the Solow model?
A)convergence to a steady state level of real GDP per-capita
B)a steady increase in the savings rate
C)a convergence with lower income countries
D)a constant growth rate in the growth rate of the labour force
E)exogenous TFP growth at a constant rate
A)convergence to a steady state level of real GDP per-capita
B)a steady increase in the savings rate
C)a convergence with lower income countries
D)a constant growth rate in the growth rate of the labour force
E)exogenous TFP growth at a constant rate
Unlock Deck
Unlock for access to all 66 flashcards in this deck.
Unlock Deck
k this deck
23
In Solow's model of economic growth, suppose that s represents the savings rate, z represents total factor productivity, k represents the level of capital per worker, and represents the per worker
Production function. Also suppose that n represents the population growth rate and d represents
The depreciation rate of capital. The equilibrium level of capital per worker, *, will satisfy the
Equation
represents the per workerProduction function. Also suppose that n represents the population growth rate and d represents
The depreciation rate of capital. The equilibrium level of capital per worker,
*, will satisfy theEquation
Unlock Deck
Unlock for access to all 66 flashcards in this deck.
Unlock Deck
k this deck
24
According to the Solow growth model, in the long-run steady state, all real aggregate quantities grow
A)at the same rate as per worker capital.
B)depending on how consumption affects population growth.
C)according to the savings rate in the economy, s.
D)at the same rate as consumption per worker.
E)at the rate n, the growth rate of the labour force.
A)at the same rate as per worker capital.
B)depending on how consumption affects population growth.
C)according to the savings rate in the economy, s.
D)at the same rate as consumption per worker.
E)at the rate n, the growth rate of the labour force.
Unlock Deck
Unlock for access to all 66 flashcards in this deck.
Unlock Deck
k this deck
25
The Solow growth model accounts for
A)the patterns of international trade among countries.
B)why richer countries have higher savings rates.
C)the level of research and development spending in an economy.
D)business cycles.
E)why people consume too much.
A)the patterns of international trade among countries.
B)why richer countries have higher savings rates.
C)the level of research and development spending in an economy.
D)business cycles.
E)why people consume too much.
Unlock Deck
Unlock for access to all 66 flashcards in this deck.
Unlock Deck
k this deck
26
If income in a country is equally distributed across the population, then
A)the Gini coefficient is equal to 0.
B)the Gini coefficient is equal to 1.
C)the Lorenz curve is L-shaped.
D)the Gini coefficient is undefined.
E)the Gini coefficient is equal to 1/2.
A)the Gini coefficient is equal to 0.
B)the Gini coefficient is equal to 1.
C)the Lorenz curve is L-shaped.
D)the Gini coefficient is undefined.
E)the Gini coefficient is equal to 1/2.
Unlock Deck
Unlock for access to all 66 flashcards in this deck.
Unlock Deck
k this deck
27
In the Malthusian model, state-mandated population control policies are likely to
A)have no effect on the equilibrium size of the population or the equilibrium level of consumption per worker.
B)decrease the equilibrium size of the population and increase the equilibrium level of consumption per worker.
C)decrease the equilibrium size of the population and have no effect on the equilibrium level of consumption per worker.
D)have no effect on the equilibrium size of the population and increase the equilibrium level of consumption per worker.
E)have no effect on the either equilibrium size of the population and the equilibrium level of consumption per worker.
Unlock Deck
Unlock for access to all 66 flashcards in this deck.
Unlock Deck
k this deck
28
In the Solow growth model, the law of motion of capital takes into account
A)the depreciation of old capital.
B)the residential nature of houses.
C)the impact of consumption on population growth.
D)the mobility of capital.
E)the costs of shipping and installing capital.
A)the depreciation of old capital.
B)the residential nature of houses.
C)the impact of consumption on population growth.
D)the mobility of capital.
E)the costs of shipping and installing capital.
Unlock Deck
Unlock for access to all 66 flashcards in this deck.
Unlock Deck
k this deck
29
The biggest contribution to real Canadian GDP growth in the 1970s was due to growth in
A)the capital stock.
B)both the capital stock and the labour force.
C)total factor productivity.
D)the size of government.
E)the labour force.
A)the capital stock.
B)both the capital stock and the labour force.
C)total factor productivity.
D)the size of government.
E)the labour force.
Unlock Deck
Unlock for access to all 66 flashcards in this deck.
Unlock Deck
k this deck
30
The Solow growth model predicts that a country's standard of living can continue to increase in the long run only if
A)there is sustained increases in government spending.
B)there is sustained increases in total factor productivity.
C)there is sustained increases in the population.
D)there is sustained increases in the labour force.
E)there is sustained increases in the capital stock.
A)there is sustained increases in government spending.
B)there is sustained increases in total factor productivity.
C)there is sustained increases in the population.
D)there is sustained increases in the labour force.
E)there is sustained increases in the capital stock.
Unlock Deck
Unlock for access to all 66 flashcards in this deck.
Unlock Deck
k this deck
31
The per worker production function relates output per worker
A)total factor productivity.
B)to capital per worker.
C)to the participation rate.
D)in different countries.
E)to production per worker.
A)total factor productivity.
B)to capital per worker.
C)to the participation rate.
D)in different countries.
E)to production per worker.
Unlock Deck
Unlock for access to all 66 flashcards in this deck.
Unlock Deck
k this deck
32
In the Malthusian model, the population growth rate is
A)exogenous.
B)not related to consumption per worker.
C)positively related to consumption per worker.
D)assumed to be constant.
E)negatively related to consumption per worker.
A)exogenous.
B)not related to consumption per worker.
C)positively related to consumption per worker.
D)assumed to be constant.
E)negatively related to consumption per worker.
Unlock Deck
Unlock for access to all 66 flashcards in this deck.
Unlock Deck
k this deck
33
The slope of the output per worker function is equal to the
A)growth rate of the population.
B)capital stock.
C)savings rate.
D)marginal product of labour.
E)marginal product of capital.
A)growth rate of the population.
B)capital stock.
C)savings rate.
D)marginal product of labour.
E)marginal product of capital.
Unlock Deck
Unlock for access to all 66 flashcards in this deck.
Unlock Deck
k this deck
34
Which feature of the data can the Solow growth model NOT replicate?
A)In developed countries, there is steady growth in income per capita.
B)There is a widening gap between income levels across countries.
C)The investment rate is positively related to the income per worker.
D)An increase in the savings rate causes an increase in income per worker.
E)The population growth rate is negatively related to the income per worker.
Unlock Deck
Unlock for access to all 66 flashcards in this deck.
Unlock Deck
k this deck
35
An increase in savings can be brought about
A)by increased labour supply.
B)through government policy.
C)by increased consumption per worker.
D)by increased total factor productivity.
E)in the short run only.
A)by increased labour supply.
B)through government policy.
C)by increased consumption per worker.
D)by increased total factor productivity.
E)in the short run only.
Unlock Deck
Unlock for access to all 66 flashcards in this deck.
Unlock Deck
k this deck
36
If the savings rate increases in the Solow growth model
A)the growth rate in output per capita increases in the long run.
B)output per capita falls in the long run.
C)the investment rate declines.
D)output per capita increases in the long run.
E)capital per worker grows at a higher rate in the long run.
A)the growth rate in output per capita increases in the long run.
B)output per capita falls in the long run.
C)the investment rate declines.
D)output per capita increases in the long run.
E)capital per worker grows at a higher rate in the long run.
Unlock Deck
Unlock for access to all 66 flashcards in this deck.
Unlock Deck
k this deck
37
In the Malthusian model, population growth depends on
A)level of nutrition.
B)consumption per worker.
C)total factor productivity.
D)labour supply.
E)income per worker.
A)level of nutrition.
B)consumption per worker.
C)total factor productivity.
D)labour supply.
E)income per worker.
Unlock Deck
Unlock for access to all 66 flashcards in this deck.
Unlock Deck
k this deck
38
In the Malthusian model, the steady state is
A)where land replaces capital in the production function.
B)where total factor productivity is maximized.
C)the competitive equilibrium.
D)where consumption per worker is maximized.
E)the long-run equilibrium for the population.
A)where land replaces capital in the production function.
B)where total factor productivity is maximized.
C)the competitive equilibrium.
D)where consumption per worker is maximized.
E)the long-run equilibrium for the population.
Unlock Deck
Unlock for access to all 66 flashcards in this deck.
Unlock Deck
k this deck
39
A pessimistic long-run Malthusian result is
A)higher labour supply does not increase total factor productivity.
B)improvements in technology does not improve standards of living.
C)population control does not increase total factor productivity.
D)increases in land use lowers standards of living.
E)increases in capital stock does not achieve the steady state.
Unlock Deck
Unlock for access to all 66 flashcards in this deck.
Unlock Deck
k this deck
40
The per worker production function describes the relationship between
A)capital per worker and total factor productivity.
B)government spending and total factor productivity.
C)labour supply and land per worker.
D)consumption per worker and income per worker.
E)output per worker and land per worker.
A)capital per worker and total factor productivity.
B)government spending and total factor productivity.
C)labour supply and land per worker.
D)consumption per worker and income per worker.
E)output per worker and land per worker.
Unlock Deck
Unlock for access to all 66 flashcards in this deck.
Unlock Deck
k this deck
41
If changes in economic policy could cause the growth rate of real GDP to increase by 1% per year for 100 years, then GDP would be ________% higher after 100 years than it would have been
Otherwise.
A)3.8
B)4.2
C)1.3
D)2.0
E)2.7
Otherwise.
A)3.8
B)4.2
C)1.3
D)2.0
E)2.7
Unlock Deck
Unlock for access to all 66 flashcards in this deck.
Unlock Deck
k this deck
42
In the Malthusian model, the long-run standard of living is determined entirely by the function g(c), which describes how
A)consumption per worker drives production.
B)the birth rate depends on population growth.
C)technology affects the growth of output.
D)consumption per worker drives population growth.
E)the death rate depends on technological change.
A)consumption per worker drives production.
B)the birth rate depends on population growth.
C)technology affects the growth of output.
D)consumption per worker drives population growth.
E)the death rate depends on technological change.
Unlock Deck
Unlock for access to all 66 flashcards in this deck.
Unlock Deck
k this deck
43
The Malthusian model emphasizes a fixed supply of which of the following factors of production?
A)energy
B)capital
C)natural resources
D)labour
E)land
A)energy
B)capital
C)natural resources
D)labour
E)land
Unlock Deck
Unlock for access to all 66 flashcards in this deck.
Unlock Deck
k this deck
44
Growth in the Solow residual was slowest in the
A)1950s.
B)2000s.
C)1960s.
D)1980s.
E)1970s.
A)1950s.
B)2000s.
C)1960s.
D)1980s.
E)1970s.
Unlock Deck
Unlock for access to all 66 flashcards in this deck.
Unlock Deck
k this deck
45
Recent evidence suggests that output per worker is
A)negatively related to the rate of investment and positively related to the rate of population growth.
B)negatively related to both the rate of investment and to the rate of population growth.
C)negatively related to the rate of investment and not related at all to the rate of population growth.
D)positively related to the rate of investment and negatively related to the rate of population growth.
E)positively related to both the rate of investment and to the rate of population growth.
Unlock Deck
Unlock for access to all 66 flashcards in this deck.
Unlock Deck
k this deck
46
In the Solow growth model
A)higher total factor productivity reduces population growth.
B)higher total factor productivity spurs population growth.
C)higher total factor productivity implies no improvement in long-run standards of living.
D)the total population is constant.
E)higher population growth implies a lower standard of living.
Unlock Deck
Unlock for access to all 66 flashcards in this deck.
Unlock Deck
k this deck
47
In more modern times as opposed to the times of Malthus, higher standards of living appear to
A)decrease death rates and increase birth rates.
B)decrease death rates and have no effect on birth rates.
C)decrease death rates and also decrease birth rates.
D)have had effects on neither death rates nor birth rates.
E)increase death rates and have no effect on birth rates.
A)decrease death rates and increase birth rates.
B)decrease death rates and have no effect on birth rates.
C)decrease death rates and also decrease birth rates.
D)have had effects on neither death rates nor birth rates.
E)increase death rates and have no effect on birth rates.
Unlock Deck
Unlock for access to all 66 flashcards in this deck.
Unlock Deck
k this deck
48
Which of the following is NOT different between the Solow and Malthusian models?
A)Population growth is exogenous.
B)Households save.
C)The production function has decreasing marginal returns.
D)There is capital accumulation.
E)Advances in technology can sustain economic growth.
A)Population growth is exogenous.
B)Households save.
C)The production function has decreasing marginal returns.
D)There is capital accumulation.
E)Advances in technology can sustain economic growth.
Unlock Deck
Unlock for access to all 66 flashcards in this deck.
Unlock Deck
k this deck
49
In an endogenous growth model, growth is caused by
A)forces that are not determined by the model itself.
B)forces determined by the model.
C)human capital accumulation.
D)total factor productivity.
E)capital accumulation.
A)forces that are not determined by the model itself.
B)forces determined by the model.
C)human capital accumulation.
D)total factor productivity.
E)capital accumulation.
Unlock Deck
Unlock for access to all 66 flashcards in this deck.
Unlock Deck
k this deck
50
In the Malthusian model, capital in the production function is replaced by
A)capital stock.
B)population growth.
C)land.
D)total factor productivity.
E)natural resources.
A)capital stock.
B)population growth.
C)land.
D)total factor productivity.
E)natural resources.
Unlock Deck
Unlock for access to all 66 flashcards in this deck.
Unlock Deck
k this deck
51
Recent evidence shows that there is a
A)positive correlation between labour force growth and the quantity of income per worker.
B)negative correlation between the savings rate and the quantity of income per worker.
C)negative correlation between capital investment and quantity of income per worker.
D)negative correlation between the population growth rate and income per worker across countries.
E)positive correlation between the population growth rate and income per worker across countries.
Unlock Deck
Unlock for access to all 66 flashcards in this deck.
Unlock Deck
k this deck
52
On average, from 1870-2017, real GDP per capita in Canada grew at about
A)-1.2%.
B)4.1%.
C)2.0%.
D)0.6%.
E)8.7%.
A)-1.2%.
B)4.1%.
C)2.0%.
D)0.6%.
E)8.7%.
Unlock Deck
Unlock for access to all 66 flashcards in this deck.
Unlock Deck
k this deck
53
Before the Industrial Revolution, standards of living differed
A)greatly over time but differed little across countries.
B)greatly over time and across countries.
C)little over time but differed greatly across countries.
D)little over time and across countries.
E)greatly over time, but was the same across countries.
A)greatly over time but differed little across countries.
B)greatly over time and across countries.
C)little over time but differed greatly across countries.
D)little over time and across countries.
E)greatly over time, but was the same across countries.
Unlock Deck
Unlock for access to all 66 flashcards in this deck.
Unlock Deck
k this deck
54
The Malthusian model has the property that
A)increased consumption leads to increased population growth.
B)increased capital stock leads to increased total factor productivity.
C)improvements in standards of living leads to population growth.
D)improvements in technology for producing goods leads to increased population growth.
E)increased education levels leads to increased population growth.
Unlock Deck
Unlock for access to all 66 flashcards in this deck.
Unlock Deck
k this deck
55
In the Malthusian model, an improvement in the technology of growing food is likely to
A)increase the equilibrium size of the population and have no effect on the equilibrium level of consumption per worker.
B)have no effect on both the equilibrium size of the population and the equilibrium level of consumption per worker.
C)have no effect on the equilibrium size of the population and increase the equilibrium level of consumption per worker.
D)increase the equilibrium size of the population and increase the equilibrium level of consumption per worker.
E)increase the equilibrium size of the population and decrease the equilibrium level of consumption per worker.
Unlock Deck
Unlock for access to all 66 flashcards in this deck.
Unlock Deck
k this deck
56
After 2011 in Canada
A)growth in the labour input was historically low.
B)growth in real output ceased.
C)growth in output was historically high.
D)growth in productivity was historically high.
E)growth in real GDP was higher than in the period 1991 2001.
A)growth in the labour input was historically low.
B)growth in real output ceased.
C)growth in output was historically high.
D)growth in productivity was historically high.
E)growth in real GDP was higher than in the period 1991 2001.
Unlock Deck
Unlock for access to all 66 flashcards in this deck.
Unlock Deck
k this deck
57
In the steady state of Solow's exogenous growth model, an increase in total factor productivity
A)decreases output per worker and decreases capital per worker.
B)increases output per worker and increases capital per worker.
C)decreases output per worker and increases capital per worker.
D)increases output per worker and decreases capital per worker.
E)decreases in output per worker only.
A)decreases output per worker and decreases capital per worker.
B)increases output per worker and increases capital per worker.
C)decreases output per worker and increases capital per worker.
D)increases output per worker and decreases capital per worker.
E)decreases in output per worker only.
Unlock Deck
Unlock for access to all 66 flashcards in this deck.
Unlock Deck
k this deck
58
As measured by the Gini coefficient
A)Income has become less equal over time in Canada since the 1980s.
B)Income is more unequal in Sweden than in the United States.
C)Income has become less equal since the 1980s in the United States.
D)Income is less equal in France than in China.
E)Income is less equal in Canada than in the United States.
Unlock Deck
Unlock for access to all 66 flashcards in this deck.
Unlock Deck
k this deck
59
In the Malthusian model of the economy
A)there is no investment or government spending.
B)the model is static with only one period.
C)population growth depends on income per worker.
D)capital replaces land in the production function.
E)population growth is negatively correlated with consumption.
A)there is no investment or government spending.
B)the model is static with only one period.
C)population growth depends on income per worker.
D)capital replaces land in the production function.
E)population growth is negatively correlated with consumption.
Unlock Deck
Unlock for access to all 66 flashcards in this deck.
Unlock Deck
k this deck
60
The Solow model emphasizes the role of which of the following factors of production?
A)land
B)education
C)natural resources
D)capital
E)labour
A)land
B)education
C)natural resources
D)capital
E)labour
Unlock Deck
Unlock for access to all 66 flashcards in this deck.
Unlock Deck
k this deck
61
Percentage deviations from trend in the Solow residual are
A)procyclical and have about equal magnitude as percentage deviations from trend in GDP.
B)procyclical and smaller than percentage deviations from trend in GDP.
C)procyclical and larger than percentage deviations from trend in GDP.
D)unrelated to the business cycle.
E)related to changes in the labour force.
Unlock Deck
Unlock for access to all 66 flashcards in this deck.
Unlock Deck
k this deck
62
What are the key differences between the Malthusian and Solow models of economic growth?
Unlock Deck
Unlock for access to all 66 flashcards in this deck.
Unlock Deck
k this deck
63
The Solow residual attempts to measure the amount of output not explained by
A)economic projections.
B)the amount of a nation's human capital.
C)technological progress.
D)the direct contribution of labour and capital.
E)business cycles.
A)economic projections.
B)the amount of a nation's human capital.
C)technological progress.
D)the direct contribution of labour and capital.
E)business cycles.
Unlock Deck
Unlock for access to all 66 flashcards in this deck.
Unlock Deck
k this deck
64
In an exogenous growth model, growth is caused by
A)forces that are not explained by the model itself.
B)capital accumulation.
C)total factor productivity.
D)government policies.
E)human capital accumulation.
A)forces that are not explained by the model itself.
B)capital accumulation.
C)total factor productivity.
D)government policies.
E)human capital accumulation.
Unlock Deck
Unlock for access to all 66 flashcards in this deck.
Unlock Deck
k this deck
65
Rates of growth of real per capita income are most alike amongst
A)the United States and in Africa.
B)the richest countries but not the poorest countries.
C)the richest countries and the poorest countries.
D)the poorest countries but not the richest countries.
E)neither the richest nor the poorest countries.
A)the United States and in Africa.
B)the richest countries but not the poorest countries.
C)the richest countries and the poorest countries.
D)the poorest countries but not the richest countries.
E)neither the richest nor the poorest countries.
Unlock Deck
Unlock for access to all 66 flashcards in this deck.
Unlock Deck
k this deck
66
In the steady state of Solow's exogenous growth model, an increase in the growth rate of labour force
A)decreases output per worker and decreases capital per worker.
B)increases output per worker and increases capital per worker.
C)decreases output per worker and the marginal product of labour.
D)increases output per worker and decreases capital per worker.
E)decreases output per worker and increases capital per worker.
Unlock Deck
Unlock for access to all 66 flashcards in this deck.
Unlock Deck
k this deck
Unlock Deck
Unlock for access to all 66 flashcards in this deck.


