Deck 14: Optical Fiber Measurements
Full screen (f)
Question
Optical spectrum analyzers directly measure the wavelength of light in an air environment. However, most wavelength measurements are quoted in terms of wavelengths or optical frequencies in a vacuum. This can lead to errors, particularly in DWDM systems, since the index of refraction of air is a function of wavelength, temperature, pressure, and gas composition. The wavelength dependence of the index of refraction n air of standard dry air at 760 torr and 15°C is 64 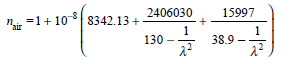
where is measured in micrometers.
( a ) Given that vacuum = air n air , what is the error in wavelength measurement at 1550 nm if the effect of the index of refraction of air is ignored What impact would this have on 0.8-nm-spaced WDM channels in the 1550-nm window
( b ) To compensate for temperature and pressure effects on the value of n air , one can use the relationship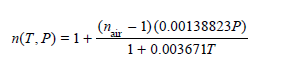
where P is measured in torr and T is in Celsius. How much does n (T, P) vary from n air when the pressure is 640 torr and the temperature is 0°C (which would be at a higher elevation and a lower temperature)
Question
Question
Question
Question
A gaussian approximation of | H ( f )| in the form 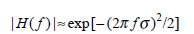
has been found to be accurate to at least the 0.75-amplitude point in the frequency domain. Using this relationship, plot P( f)/P(t) as a function of frequency from 0 to 1000 MHz for fibers that have impulse responses of full rms pulse widths 2 equal to 2.0, 1.0, and 0.5 ns. What are the 3-dB bandwidths of these fibers
has been found to be accurate to at least the 0.75-amplitude point in the frequency domain. Using this relationship, plot P( f)/P(t) as a function of frequency from 0 to 1000 MHz for fibers that have impulse responses of full rms pulse widths 2 equal to 2.0, 1.0, and 0.5 ns. What are the 3-dB bandwidths of these fibers
Question
Consider the data shown in Fig. 14.37 of the group delay versus wavelength for a 10-km long fiber. From this data, plot the chromatic dispersion D as a function of wavelength. What is the value of the zero-dispersion slope S 0 in the relationship D() = S 0 ( 0 ) 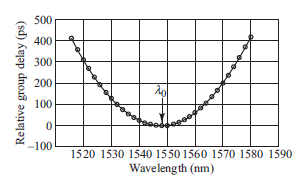
Fig. 14.37 Chromatic-dispersion measurement of a 10-km fiber
Fig. 14.37 Chromatic-dispersion measurement of a 10-km fiber
Question
Determine the value of the expected differential group delay from the polarization-mode- dispersion measurement response shown in Fig. 14.38 for a non-mode-coupled fiber. 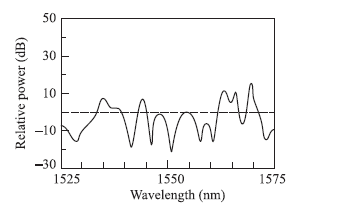
Fig. 14.38 PMD-inducedpowerexcursions about the mean power level (dashed line)
Fig. 14.38 PMD-inducedpowerexcursions about the mean power level (dashed line)
Question
The influence of polarization-mode dispersion can be neglected for data rates up to a few Gb/s for intensity-modulated direct-detection systems. However, for higher rates, PMD can cause intersymbol interference (ISI) in long- span links. The ISI power penalty in decibels for PMD is approximately 65 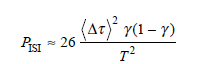
where T is a bit period (1/bit rate) and is the power-splitting ratio between principal polarization states. The maximum power penalty occurs when = . If typical values of the expected value of the differential group delay are 1 ps over a 100-km link and 10 ps over a 1000-km link, find the maximum PMD power penalty for data rates of 10 and 100 Gb/s over these two link distances.
where T is a bit period (1/bit rate) and is the power-splitting ratio between principal polarization states. The maximum power penalty occurs when =
. If typical values of the expected value of the differential group delay are 1 ps over a 100-km link and 10 ps over a 1000-km link, find the maximum PMD power penalty for data rates of 10 and 100 Gb/s over these two link distances. Question
Question
Assuming that Rayleight scattering is approximately isotropic (uniform in all directions), show that the fraction S of scattered light trapped in a multimode fiber in the backward direction is given by 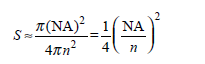
where NA is the fiber numerical aperture, n is the core refractive index, and NA/ n represents the half-angle of the cone of captured rays. If NA = 0.20 and n = 1.50, what fraction of the scattered light is recaptured by the fiber in the reverse direction.
where NA is the fiber numerical aperture, n is the core refractive index, and NA/ n represents the half-angle of the cone of captured rays. If NA = 0.20 and n = 1.50, what fraction of the scattered light is recaptured by the fiber in the reverse direction.
Question
Question
Let be the attenuation of the forward propagating light, s the attenuation of the backscattered light, and S the fraction of the total output power scattered in the backward direction, as described in Eq. (14.20). Show that the backscatter response of a rectangular pulse of width W from a point a distance L down the fiber is 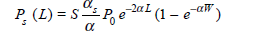
when L W /2, and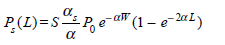
for 0 L W/2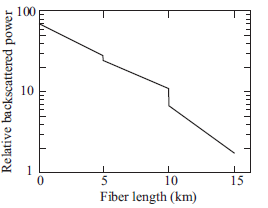
Fig. 14.39 An OTDR trace of three 5-km spilced fibers
when L W /2, and
for 0 L W/2
Fig. 14.39 An OTDR trace of three 5-km spilced fibers
Question
Question
Question

Unlock Deck
Sign up to unlock the cards in this deck!
Unlock Deck
Unlock Deck
1/15
Play
Full screen (f)
Deck 14: Optical Fiber Measurements
1
Optical spectrum analyzers directly measure the wavelength of light in an air environment. However, most wavelength measurements are quoted in terms of wavelengths or optical frequencies in a vacuum. This can lead to errors, particularly in DWDM systems, since the index of refraction of air is a function of wavelength, temperature, pressure, and gas composition. The wavelength dependence of the index of refraction n air of standard dry air at 760 torr and 15°C is 64
where is measured in micrometers.
( a ) Given that vacuum = air n air , what is the error in wavelength measurement at 1550 nm if the effect of the index of refraction of air is ignored What impact would this have on 0.8-nm-spaced WDM channels in the 1550-nm window
( b ) To compensate for temperature and pressure effects on the value of n air , one can use the relationship
where P is measured in torr and T is in Celsius. How much does n (T, P) vary from n air when the pressure is 640 torr and the temperature is 0°C (which would be at a higher elevation and a lower temperature)
Consider the given equation  of standard dry air at
  and
and  is,
is,  Since, the wave length of the light in air is
  or
or  . Thus, after substitution of the
  value, we get
  .
.
(a)
To calculate the error in wavelength at 1550 nm as follows: In DWDM systems, the channel spacing is
  , it depends on total value of signal bandwidth. Consider channel spacing is most commercial WDM system is
  . So, the error in wavelength at
  spaced WDM channels in the 1550 nm window is
  .
.
(b)
Consider the given equation variation at
  and
and  is,
is,  Substitute the
  value in the given expression as,
  Then calculate
  as follows:
  So, the
  variation from
  at
at  and
and  is
is  .
.
Thus, the error in wavelength at spaced WDM channels in the 1550 nm window and variation from
  at
at  and
and  is calculated.
of standard dry air at and is, Since, the wave length of the light in air is or . Thus, after substitution of the value, we get .(a)
To calculate the error in wavelength at 1550 nm as follows:
In DWDM systems, the channel spacing is , it depends on total value of signal bandwidth. Consider channel spacing is most commercial WDM system is . So, the error in wavelength at spaced WDM channels in the 1550 nm window is .(b)
Consider the given equation
variation at and is, Substitute the value in the given expression as, Then calculate as follows: So, the variation from at and is .Thus, the error in wavelength at
spaced WDM channels in the 1550 nm window and variation from at and is calculated. 2
An engineer wants to find the attenuation at 1310 nm of an 1895-m long fiber. The only available instrument is a photodetector, which gives an output reading in volts. Using this device in a cutback-attenuation setup, the engineer measures an output of 3.31 V from the photodiode at the far end of the fiber. After cutting the fiber 2 m from the source, the output voltage from the photodetector now reads 3.78 V What is the attenuation of the fiber in dB/km
Since the output voltage from the photodetector is proportional to the optical power, we can write Eq. (14.1) as 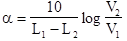 where L1 is the length of the current fiber, L2 is the length cut off, and V1 and V2 are the voltage output readings from the long and short lengths, respectively. Then the attenuation in decibels is
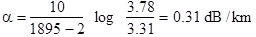
where L1 is the length of the current fiber, L2 is the length cut off, and V1 and V2 are the voltage output readings from the long and short lengths, respectively. Then the attenuation in decibels is 3
Consider the cutback attenuation measurement technique described by Eq. (14.2) using a photodetector, the power measurements are proportional to the detector output voltage. If the uncertainty in the voltage readings for the two power measurements are ±0.1 percent each, what is the uncertainty in the attenuation accuracy How long must the fiber be to get a sensitivity better than ±0.05 dB/km
Refer to equation 14.2 from the text book to calculate uncertainty in the attenuation accuracy. The average loss  is given by
  Here
Here  and
and  are output powers of the near and far ends of the fiber, respectively and L is the separation of the two measurement points.
Rearrange the equation with near and far end length of the fiber .
.  Since the output voltage from the photo detector is proportional to the optical power, we can write the equation 14.2 as follows.
 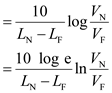 Now, calculate the uncertainty in the attenuation accuracy is,
  Since,
  , refer to equation 14.19 from the text book and then substitute two power measurements are
  in the expression as follows:
  So, the uncertainty in the attenuation accuracy is
 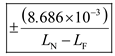 .
.
For determine better sensitivity than as follows;
Consider , then
  So, the fiber is to get a better sensitivity than
  is
is  .
.
Hence, the uncertainty in the attenuation accuracy and better sensitivity of the fiber is calculated.
is given by Here and are output powers of the near and far ends of the fiber, respectively and L is the separation of the two measurement points.Rearrange the equation with near and far end length of the fiber
. Since the output voltage from the photo detector is proportional to the optical power, we can write the equation 14.2 as follows. Now, calculate the uncertainty in the attenuation accuracy is, Since, , refer to equation 14.19 from the text book and then substitute two power measurements are in the expression as follows: So, the uncertainty in the attenuation accuracy is .For determine better sensitivity than
as follows;Consider
, then So, the fiber is to get a better sensitivity than is .Hence, the uncertainty in the attenuation accuracy and better sensitivity of the fiber is calculated.
4
Verify that the full-width at half-maximum of a gaussian pulse is given by t FWHM = 2(2 ln 2) 1/2.
( b ) Derive Eq. (14.11), which describes the 3-dB bandwidth of a fiber based on a gaussian output response.
( b ) Derive Eq. (14.11), which describes the 3-dB bandwidth of a fiber based on a gaussian output response.
Unlock Deck
Unlock for access to all 15 flashcards in this deck.
Unlock Deck
k this deck
5
A gaussian approximation of | H ( f )| in the form
has been found to be accurate to at least the 0.75-amplitude point in the frequency domain. Using this relationship, plot P( f)/P(t) as a function of frequency from 0 to 1000 MHz for fibers that have impulse responses of full rms pulse widths 2 equal to 2.0, 1.0, and 0.5 ns. What are the 3-dB bandwidths of these fibers
has been found to be accurate to at least the 0.75-amplitude point in the frequency domain. Using this relationship, plot P( f)/P(t) as a function of frequency from 0 to 1000 MHz for fibers that have impulse responses of full rms pulse widths 2 equal to 2.0, 1.0, and 0.5 ns. What are the 3-dB bandwidths of these fibers
Unlock Deck
Unlock for access to all 15 flashcards in this deck.
Unlock Deck
k this deck
6
Consider the data shown in Fig. 14.37 of the group delay versus wavelength for a 10-km long fiber. From this data, plot the chromatic dispersion D as a function of wavelength. What is the value of the zero-dispersion slope S 0 in the relationship D() = S 0 ( 0 )
Fig. 14.37 Chromatic-dispersion measurement of a 10-km fiber
Fig. 14.37 Chromatic-dispersion measurement of a 10-km fiber
Unlock Deck
Unlock for access to all 15 flashcards in this deck.
Unlock Deck
k this deck
7
Determine the value of the expected differential group delay from the polarization-mode- dispersion measurement response shown in Fig. 14.38 for a non-mode-coupled fiber.
Fig. 14.38 PMD-inducedpowerexcursions about the mean power level (dashed line)
Fig. 14.38 PMD-inducedpowerexcursions about the mean power level (dashed line)
Unlock Deck
Unlock for access to all 15 flashcards in this deck.
Unlock Deck
k this deck
8
The influence of polarization-mode dispersion can be neglected for data rates up to a few Gb/s for intensity-modulated direct-detection systems. However, for higher rates, PMD can cause intersymbol interference (ISI) in long- span links. The ISI power penalty in decibels for PMD is approximately 65
where T is a bit period (1/bit rate) and is the power-splitting ratio between principal polarization states. The maximum power penalty occurs when = . If typical values of the expected value of the differential group delay are 1 ps over a 100-km link and 10 ps over a 1000-km link, find the maximum PMD power penalty for data rates of 10 and 100 Gb/s over these two link distances.
where T is a bit period (1/bit rate) and is the power-splitting ratio between principal polarization states. The maximum power penalty occurs when =
. If typical values of the expected value of the differential group delay are 1 ps over a 100-km link and 10 ps over a 1000-km link, find the maximum PMD power penalty for data rates of 10 and 100 Gb/s over these two link distances. Unlock Deck
Unlock for access to all 15 flashcards in this deck.
Unlock Deck
k this deck
9
The optical power in a fiber at a distance x from the input end is given by Eq. (14.18). By assuming that the loss coefficient is uniform along the fiber, use this equation to derive Eq. (14.2).
Unlock Deck
Unlock for access to all 15 flashcards in this deck.
Unlock Deck
k this deck
10
Assuming that Rayleight scattering is approximately isotropic (uniform in all directions), show that the fraction S of scattered light trapped in a multimode fiber in the backward direction is given by
where NA is the fiber numerical aperture, n is the core refractive index, and NA/ n represents the half-angle of the cone of captured rays. If NA = 0.20 and n = 1.50, what fraction of the scattered light is recaptured by the fiber in the reverse direction.
where NA is the fiber numerical aperture, n is the core refractive index, and NA/ n represents the half-angle of the cone of captured rays. If NA = 0.20 and n = 1.50, what fraction of the scattered light is recaptured by the fiber in the reverse direction.
Unlock Deck
Unlock for access to all 15 flashcards in this deck.
Unlock Deck
k this deck
11
Three 5-km-long fibers have been spliced together in series and an OTDR is used to measure the attenuation of the resultant fiber. The reduced data of the OTDR display is shown in Fig. 14.39. What are the attenuations in decibels per kilometer of the three individual fibers What are the splice losses in decibels What are some possible reasons for the large splice loss occurring between the second and third fibers
Unlock Deck
Unlock for access to all 15 flashcards in this deck.
Unlock Deck
k this deck
12
Let be the attenuation of the forward propagating light, s the attenuation of the backscattered light, and S the fraction of the total output power scattered in the backward direction, as described in Eq. (14.20). Show that the backscatter response of a rectangular pulse of width W from a point a distance L down the fiber is
when L W /2, and
for 0 L W/2
Fig. 14.39 An OTDR trace of three 5-km spilced fibers
when L W /2, and
for 0 L W/2
Fig. 14.39 An OTDR trace of three 5-km spilced fibers
Unlock Deck
Unlock for access to all 15 flashcards in this deck.
Unlock Deck
k this deck
13
Using the expression given in Prob. 14.12 for the backscattered power P S (L) from a rectangular pulse of width W, show that for very short pulse widths the backscattered power is proportional to the pulse duration. Note: This is the basis of operation of an OTDR.
Unlock Deck
Unlock for access to all 15 flashcards in this deck.
Unlock Deck
k this deck
14
The uncertainty U of OTDR loss measurements as a function of the signal-to-noise ratio SNR can be approximated by 36
log| U |= 0.2SNR + 0.6
Here, U and SNR are given in decibels. If a 0.5-dB splice is located near the far end of a 50-km fiber, what dynamic range must the OTDR have to measure the insertion loss of this splice event with a ±0.05-dB accuracy. Assume the fiber attenuation is 0.33 dB/km.
log| U |= 0.2SNR + 0.6
Here, U and SNR are given in decibels. If a 0.5-dB splice is located near the far end of a 50-km fiber, what dynamic range must the OTDR have to measure the insertion loss of this splice event with a ±0.05-dB accuracy. Assume the fiber attenuation is 0.33 dB/km.
Unlock Deck
Unlock for access to all 15 flashcards in this deck.
Unlock Deck
k this deck
15
Show that, when using an OTDR, an optical pulse width of 5 ns or less is required to locate a fiber fault to within ±0.5 m of its true position.
Unlock Deck
Unlock for access to all 15 flashcards in this deck.
Unlock Deck
k this deck
Unlock Deck
Unlock for access to all 15 flashcards in this deck.


