Deck 11: Integrated Optics and Photonics
Full screen (f)
Question
Assume the gain profile of an optical amplifier is 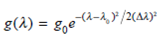
where 0 is the peak-gain wavelength and is the spectral width of the amplifier gain. If = 25 nm, find the FWHM (the 3-dB gain) of the amplifier gain if the peak gain at 0 is 30 dB.
where 0 is the peak-gain wavelength and is the spectral width of the amplifier gain. If = 25 nm, find the FWHM (the 3-dB gain) of the amplifier gain if the peak gain at 0 is 30 dB.
Question
Question
Question
To see the relative contributions of the various noise mechanisms in an optical amplifier, calculate the values of the five noise terms in Eq. (11.30) for operational gains of G = 20 dB and 30 dB. Assume the optical bandwidth is equal to the spontaneous emission bandwidth (30-nm spectral width) and use the following parameter values: 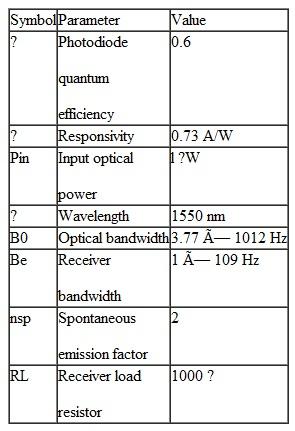 ( b ) To see the effect of using a narrowband optical filter at the receiver, let B o = 1.25 × 10 11 Hz (125 GHz at 1550 nm) and find the same five noise terms for G = 20 dB and 30 dB.
( b ) To see the effect of using a narrowband optical filter at the receiver, let B o = 1.25 × 10 11 Hz (125 GHz at 1550 nm) and find the same five noise terms for G = 20 dB and 30 dB. Question
Question
Consider a cascaded chain of k fiber-plus-EDFA combinations, as shown in Fig. 11.24. 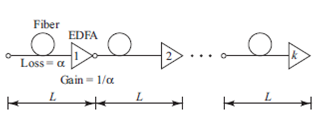
Fig. 11.24 Cascaded EDFA chain
( a ) Show that the path-averaged signal power is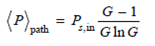
( b ) Derive the path-averaged ASE power given by Eq. (11.42).
Fig. 11.24 Cascaded EDFA chain
( a ) Show that the path-averaged signal power is
( b ) Derive the path-averaged ASE power given by Eq. (11.42).
Question
Consider a long-distance transmission system containing a cascaded chain of EDFAs. Assume each EDFA is operated in the saturation region and that the slope of the gain-versus-input power curve in this region is -0.5; that is, the gain changes by ±3 dB for a 6-dB variation in input power. Let the link have the following operational parameters: 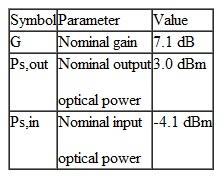 ( a ) Suppose there is a sudden 6-dB drop in signal level at some point in the link. Find the power output levels after the degraded signal has passed through 1, 2, 3, and 4 succeeding amplifier stages.
( b ) Repeat part ( a ) for a signal-level drop of 12 dB.
( a ) Suppose there is a sudden 6-dB drop in signal level at some point in the link. Find the power output levels after the degraded signal has passed through 1, 2, 3, and 4 succeeding amplifier stages.( b ) Repeat part ( a ) for a signal-level drop of 12 dB.
Question
Let the electric field of an optical signal at a carrier frequency v i be 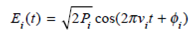
where P i is the signal power at the carrier frequency v i and i is the carrier phase. If N optical signals each at a different frequency v i are traveling along a fiber, show that the signal power is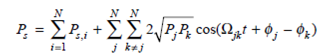
where jk = 2( v j - v k ) represents the beat frequency at which the carrier population oscillates.
Question
Question
Recall from Eq. (7.13) that the bit-error rate (BER) can be given in terms of a Q factor, where, from Eq. (7.14), 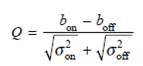
When thermal noise is dominant, we have . However, for an EDFA the existence of signal-ASE beat noise produces the condition
  . In this case,
  from Eq. (11.30),
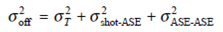
and
Noting that the receiver sensitivity P R is half the signal power of a transmitted 1 bit for a uniform distribution of ones and zeros (i.e., P s = 2 P R ), show that in terms of the Q factor the receiver sensitivity is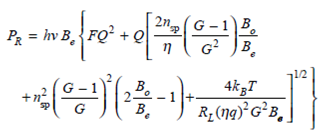
where F is the noise figure given by Eq. (11.35).
When thermal noise is dominant, we have
. However, for an EDFA the existence of signal-ASE beat noise produces the condition . In this case, from Eq. (11.30), and
Noting that the receiver sensitivity P R is half the signal power of a transmitted 1 bit for a uniform distribution of ones and zeros (i.e., P s = 2 P R ), show that in terms of the Q factor the receiver sensitivity is
where F is the noise figure given by Eq. (11.35).
Question
Consider an InGaAsP semiconductor optical amplifier that has the following parameter values: 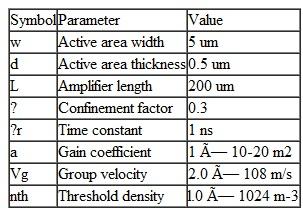 If a 100-mA bias current is applied, find ( a ) the pumping rate R p ( b ) the maximum (zero- signal) gain, ( c ) the saturation photon density, ( d ) the photon density if a l- W signal at 1310 nm enters the amplifier. Compare the results of ( c ) and ( d ).
If a 100-mA bias current is applied, find ( a ) the pumping rate R p ( b ) the maximum (zero- signal) gain, ( c ) the saturation photon density, ( d ) the photon density if a l- W signal at 1310 nm enters the amplifier. Compare the results of ( c ) and ( d ). Question
Question
Question
The output saturation power P out sat is defined as the amplifier output power for which the amplifier gain G is reduced by 3 dB (a factor of 2) from its unsaturated value G 0. Assuming G 0 » 1, show the amplifier output saturation power is 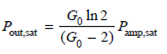
Question
Since the gain constant a depends on the frequency, the amplifier gain is also frequency- dependent. The 3-dB bandwidth (full-width at half-maximum, FWHM) is defined as the frequency for which the power gain G ( v ) is reduced by a factor of 2. Assume the gain parameter g has a gaussian profile 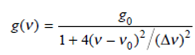
where v is the optical bandwidth (the spectral width of the gain profile) and v 0 is the maximum-gain frequency. Starting with Eq. (11.9), show that the ratio of the 3-dB bandwidth 2( v - v 0 ) to the optical bandwidth v is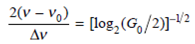
where log 2 X is the base-2 logarithm of X. What does this equation show concerning the relationship between the amplifier gain and the optical bandwidth

Unlock Deck
Sign up to unlock the cards in this deck!
Unlock Deck
Unlock Deck
1/15
Play
Full screen (f)
Deck 11: Integrated Optics and Photonics
1
Assume the gain profile of an optical amplifier is
where 0 is the peak-gain wavelength and is the spectral width of the amplifier gain. If = 25 nm, find the FWHM (the 3-dB gain) of the amplifier gain if the peak gain at 0 is 30 dB.
where 0 is the peak-gain wavelength and is the spectral width of the amplifier gain. If = 25 nm, find the FWHM (the 3-dB gain) of the amplifier gain if the peak gain at 0 is 30 dB.
Since  we have
 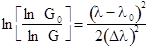 The FWHM is given by 2( - 0), so that from the above equation, with the 3-dB gain G = 27 dB being 3 dB below the peak gain, we have
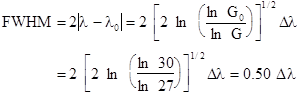 which is the expected result for a gaussian gain profile.
we have The FWHM is given by 2( - 0), so that from the above equation, with the 3-dB gain G = 27 dB being 3 dB below the peak gain, we have which is the expected result for a gaussian gain profile. 2
Compare the maximum theoretical power conversion efficiency (PCE) for 980-nm and 1475-nm pumping in an EDFA for a 1545-nm signal. Contrast this with actual measured results of PCE = 50.0 percent and 75.6 percent for 980-nm and 1475-nm pumping, respectively.
( b ) Using the actual results for PCE given in ( a ), plot the maximum signal output power as a function of pump power for 0 P p ,in 200 mW for pump wavelengths of 980 nm and 1475 nm.
( b ) Using the actual results for PCE given in ( a ), plot the maximum signal output power as a function of pump power for 0 P p ,in 200 mW for pump wavelengths of 980 nm and 1475 nm.
From Eq. (11.17), the maximum PCE is given by  for 980-nm pumping, and by
  for 1475-nm pumping
for 980-nm pumping, and by for 1475-nm pumping 3
Assume we have an EDFA power amplifier that produces P s , out = 27 dBm for an input level of 2 dBm at 1542 nm.
( a ) Find the amplifier gain.
( b ) What is the minimum pump power required
( a ) Find the amplifier gain.
( b ) What is the minimum pump power required
(a) 27 dBm = 501 mW and 2 dBm = 1.6 mW.
Thus the gain is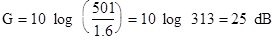 (b) From Eq. (11.19),
 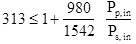 .With a 1.6-mW input signal, the pump power needed is
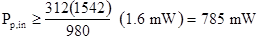
Thus the gain is
(b) From Eq. (11.19), .With a 1.6-mW input signal, the pump power needed is 4
To see the relative contributions of the various noise mechanisms in an optical amplifier, calculate the values of the five noise terms in Eq. (11.30) for operational gains of G = 20 dB and 30 dB. Assume the optical bandwidth is equal to the spontaneous emission bandwidth (30-nm spectral width) and use the following parameter values: ( b ) To see the effect of using a narrowband optical filter at the receiver, let B o = 1.25 × 10 11 Hz (125 GHz at 1550 nm) and find the same five noise terms for G = 20 dB and 30 dB.
( b ) To see the effect of using a narrowband optical filter at the receiver, let B o = 1.25 × 10 11 Hz (125 GHz at 1550 nm) and find the same five noise terms for G = 20 dB and 30 dB. Unlock Deck
Unlock for access to all 15 flashcards in this deck.
Unlock Deck
k this deck
5
Plot the penalty factor F ( G ) givenby Eq. (11.43) as a function of amplifier gain for gains ranging from 0 to 30 dB. Assuming the fiber attenuation is 0.2 dB/km, draw a distance axis parallel to the gain axis to show the transmission distances corresponding to the gain values.
Unlock Deck
Unlock for access to all 15 flashcards in this deck.
Unlock Deck
k this deck
6
Consider a cascaded chain of k fiber-plus-EDFA combinations, as shown in Fig. 11.24.
Fig. 11.24 Cascaded EDFA chain
( a ) Show that the path-averaged signal power is
( b ) Derive the path-averaged ASE power given by Eq. (11.42).
Fig. 11.24 Cascaded EDFA chain
( a ) Show that the path-averaged signal power is
( b ) Derive the path-averaged ASE power given by Eq. (11.42).
Unlock Deck
Unlock for access to all 15 flashcards in this deck.
Unlock Deck
k this deck
7
Consider a long-distance transmission system containing a cascaded chain of EDFAs. Assume each EDFA is operated in the saturation region and that the slope of the gain-versus-input power curve in this region is -0.5; that is, the gain changes by ±3 dB for a 6-dB variation in input power. Let the link have the following operational parameters: ( a ) Suppose there is a sudden 6-dB drop in signal level at some point in the link. Find the power output levels after the degraded signal has passed through 1, 2, 3, and 4 succeeding amplifier stages.
( b ) Repeat part ( a ) for a signal-level drop of 12 dB.
( a ) Suppose there is a sudden 6-dB drop in signal level at some point in the link. Find the power output levels after the degraded signal has passed through 1, 2, 3, and 4 succeeding amplifier stages.( b ) Repeat part ( a ) for a signal-level drop of 12 dB.
Unlock Deck
Unlock for access to all 15 flashcards in this deck.
Unlock Deck
k this deck
8
Let the electric field of an optical signal at a carrier frequency v i be
where P i is the signal power at the carrier frequency v i and i is the carrier phase. If N optical signals each at a different frequency v i are traveling along a fiber, show that the signal power is
where jk = 2( v j - v k ) represents the beat frequency at which the carrier population oscillates.
Unlock Deck
Unlock for access to all 15 flashcards in this deck.
Unlock Deck
k this deck
9
Consider an EDFA with a gain of 26 dB and a maximum output power of 0 dBm.
( a ) Compare the output signal levels per channel for 1, 2, 4, and 8 wavelength channels, where the input power is 1 W for each signal.
( b ) What are the output signal levels per channel in each case if the pump power is doubled
( a ) Compare the output signal levels per channel for 1, 2, 4, and 8 wavelength channels, where the input power is 1 W for each signal.
( b ) What are the output signal levels per channel in each case if the pump power is doubled
Unlock Deck
Unlock for access to all 15 flashcards in this deck.
Unlock Deck
k this deck
10
Recall from Eq. (7.13) that the bit-error rate (BER) can be given in terms of a Q factor, where, from Eq. (7.14),
When thermal noise is dominant, we have . However, for an EDFA the existence of signal-ASE beat noise produces the condition . In this case, from Eq. (11.30),
and
Noting that the receiver sensitivity P R is half the signal power of a transmitted 1 bit for a uniform distribution of ones and zeros (i.e., P s = 2 P R ), show that in terms of the Q factor the receiver sensitivity is
where F is the noise figure given by Eq. (11.35).
When thermal noise is dominant, we have
. However, for an EDFA the existence of signal-ASE beat noise produces the condition . In this case, from Eq. (11.30), and
Noting that the receiver sensitivity P R is half the signal power of a transmitted 1 bit for a uniform distribution of ones and zeros (i.e., P s = 2 P R ), show that in terms of the Q factor the receiver sensitivity is
where F is the noise figure given by Eq. (11.35).
Unlock Deck
Unlock for access to all 15 flashcards in this deck.
Unlock Deck
k this deck
11
Consider an InGaAsP semiconductor optical amplifier that has the following parameter values: If a 100-mA bias current is applied, find ( a ) the pumping rate R p ( b ) the maximum (zero- signal) gain, ( c ) the saturation photon density, ( d ) the photon density if a l- W signal at 1310 nm enters the amplifier. Compare the results of ( c ) and ( d ).
If a 100-mA bias current is applied, find ( a ) the pumping rate R p ( b ) the maximum (zero- signal) gain, ( c ) the saturation photon density, ( d ) the photon density if a l- W signal at 1310 nm enters the amplifier. Compare the results of ( c ) and ( d ). Unlock Deck
Unlock for access to all 15 flashcards in this deck.
Unlock Deck
k this deck
12
Verify that the gain expression in Eq. (11.13) follows from the integral relationship Eq. (11.12 b ).
Unlock Deck
Unlock for access to all 15 flashcards in this deck.
Unlock Deck
k this deck
13
Solving Eq. (11.13) numerically, make plots of the normalized amplifier gain ( G / G 0 ) versus the normalized output power ( P s , out / P amp , sat ) for unsaturated amplifier gain values of G 0 = 30 dB, 15 dB, and 10 dB.
Unlock Deck
Unlock for access to all 15 flashcards in this deck.
Unlock Deck
k this deck
14
The output saturation power P out sat is defined as the amplifier output power for which the amplifier gain G is reduced by 3 dB (a factor of 2) from its unsaturated value G 0. Assuming G 0 » 1, show the amplifier output saturation power is
Unlock Deck
Unlock for access to all 15 flashcards in this deck.
Unlock Deck
k this deck
15
Since the gain constant a depends on the frequency, the amplifier gain is also frequency- dependent. The 3-dB bandwidth (full-width at half-maximum, FWHM) is defined as the frequency for which the power gain G ( v ) is reduced by a factor of 2. Assume the gain parameter g has a gaussian profile
where v is the optical bandwidth (the spectral width of the gain profile) and v 0 is the maximum-gain frequency. Starting with Eq. (11.9), show that the ratio of the 3-dB bandwidth 2( v - v 0 ) to the optical bandwidth v is
where log 2 X is the base-2 logarithm of X. What does this equation show concerning the relationship between the amplifier gain and the optical bandwidth
Unlock Deck
Unlock for access to all 15 flashcards in this deck.
Unlock Deck
k this deck
Unlock Deck
Unlock for access to all 15 flashcards in this deck.


