Deck 17: Statistics and Probability Questions
Full screen (f)
Question
Question
Question
Question
Question
Question
Question
Jane Doe and Richard Roe are law students.Their scores on the midterms and finals in the Statistics for Law class, together with the means and standard deviations for these exams are given below: 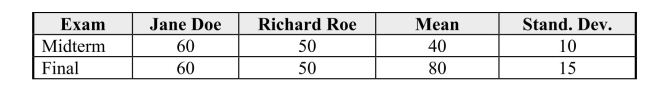 If their scores are transformed to z-scores, it is apparent that:
A)Jane did better than Richard on both exams.
B)Richard did better than Jane on both exams.
C)Jane did better on the first exam, Richard did better on the second.
D)Richard did better on the first exam, Jane did better on the second.
E)Richard and Jane did equally well on both exams.
If their scores are transformed to z-scores, it is apparent that:A)Jane did better than Richard on both exams.
B)Richard did better than Jane on both exams.
C)Jane did better on the first exam, Richard did better on the second.
D)Richard did better on the first exam, Jane did better on the second.
E)Richard and Jane did equally well on both exams.
Question
Question
Question
Question
Question
Question
Question
Question
Question
Question
Question
Question
Question
Question
In a study of male / female differences in carnivores, the height of the canine teeth in the
lower jaws were measured.The data below are graphic representations of these data.
Use these graphs to answer questions below.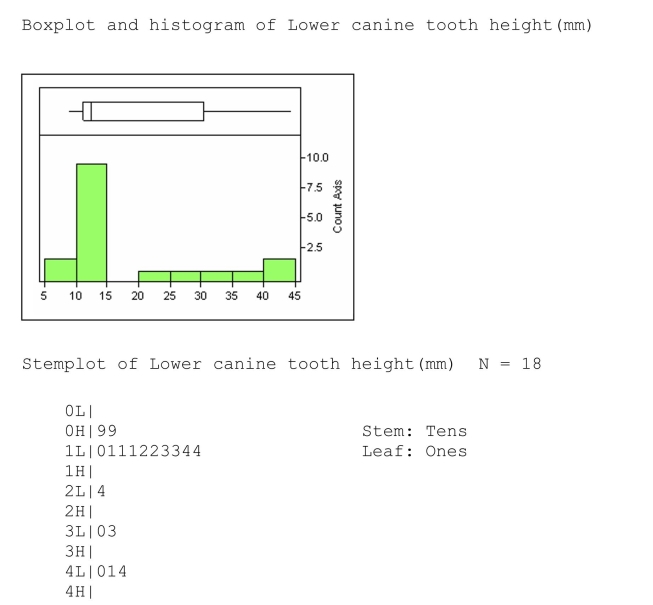
When constructing a modified box plot, one must find the upper and lower mild outlier cutoffs.For these data, the upper mild outlier cutoff would be:
lower jaws were measured.The data below are graphic representations of these data.
Use these graphs to answer questions below.
When constructing a modified box plot, one must find the upper and lower mild outlier cutoffs.For these data, the upper mild outlier cutoff would be:
Question
Question
A)16 and 25
B)12 and 30
C)12 and 18
D)12, 17, 16, and 18
E)12, 13, 30, and 25
Question
Question
In a study of male / female differences in carnivores, the height of the canine teeth in the
lower jaws were measured.The data below are graphic representations of these data.
Use these graphs to answer questions below.
The median of the lower canine tooth heights is:
lower jaws were measured.The data below are graphic representations of these data.
Use these graphs to answer questions below.
The median of the lower canine tooth heights is:
Question
Suppose that a frequency distribution and a cumulative frequency distribution are constructed from the same set of data, using the same classes.Then, for each class, 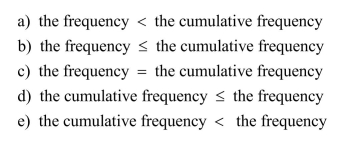
Question

A)2
B)3
C)4
D)5
E)6
Question
In a study of hatchling resting metabolism, three species, labeled A, B, and C below,
were studied.Below is a pie chart of the sample sizes for each of the species.36
hatchlings were studied in total.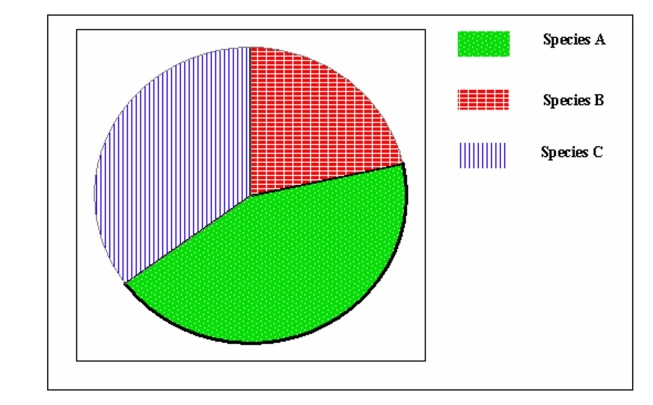
Based on the pie chart, about how many of the hatchlings were Species C hatchlings?
A)8
B)12
C)20
D)24
E)30
were studied.Below is a pie chart of the sample sizes for each of the species.36
hatchlings were studied in total.
Based on the pie chart, about how many of the hatchlings were Species C hatchlings?
A)8
B)12
C)20
D)24
E)30
Question
Use the following frequency table to determine the proportion of values less than 60. 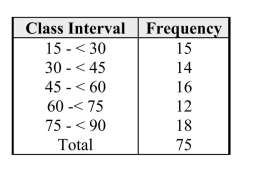
A)0.187
B)0.200
C)0.213
D)0.240
E)0.600
A)0.187
B)0.200
C)0.213
D)0.240
E)0.600
Question
Question
Question
Question
Suppose that for a set of numeric data, where the numbers are not all different, the standard deviation is less than 1.0.Then it must be true that 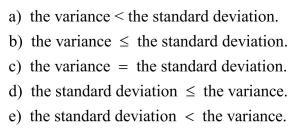 For questions 39-40, refer to the information below and the scatterplots of observed species and pH.The data is from 15 tributaries of Millers River in north-central Massachusetts, presenting the number of fish species vs.the mean pH level of the stream in 1983.
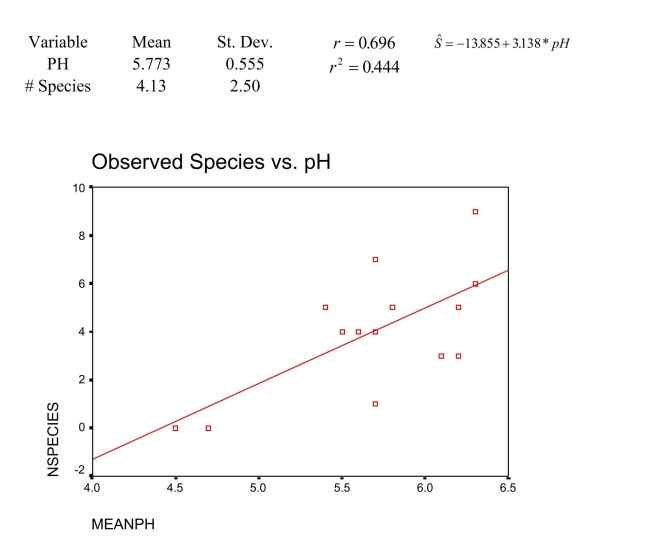
For questions 39-40, refer to the information below and the scatterplots of observed species and pH.The data is from 15 tributaries of Millers River in north-central Massachusetts, presenting the number of fish species vs.the mean pH level of the stream in 1983. Question
Question
In terms of sensitivity to outliers, which is the correct ordering of the following statistics from least sensitive to most sensitive? In other words, if the following statistics were ordered like this:  what should the ordering be?
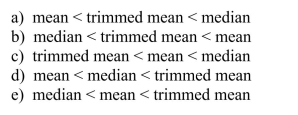
what should the ordering be? Question
In a study of hatchling resting metabolism, the yolk-free dry body mass for different
species of birds was gathered.A histogram of this data and possible box plots are shown
below, with numeric scales deleted.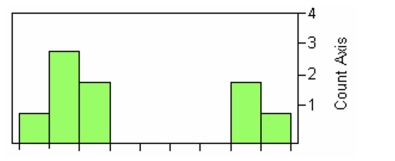
Of the following boxplots, which best matches the histogram?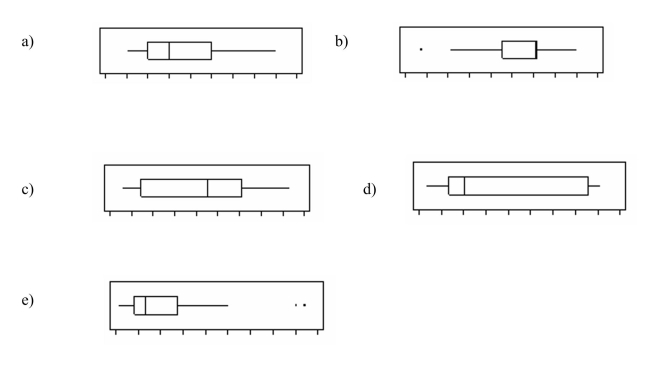
species of birds was gathered.A histogram of this data and possible box plots are shown
below, with numeric scales deleted.
Of the following boxplots, which best matches the histogram?
Question
Question
Question
Question
In a study of male / female differences in carnivores, the height of the canine teeth in the
lower jaws were measured.The data below are graphic representations of these data.
Use these graphs to answer questions below.
Considering the graphic displays, the best description of these data would be:
A)Skewed left
B)Skewed right
C)Symmetric
D)Bimodal
E)Light tailed
lower jaws were measured.The data below are graphic representations of these data.
Use these graphs to answer questions below.
Considering the graphic displays, the best description of these data would be:
A)Skewed left
B)Skewed right
C)Symmetric
D)Bimodal
E)Light tailed
Question
Use the following information for questions 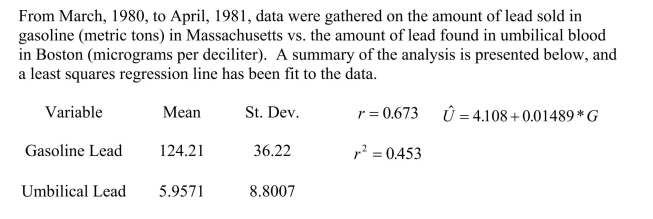
Approximately what percentage of the variation in umbilical lead concentrations can be explained by the linear model?
A)67.3%
B)36.22%
C)45.3%
D)1.49%
E)8.80%
Approximately what percentage of the variation in umbilical lead concentrations can be explained by the linear model?
A)67.3%
B)36.22%
C)45.3%
D)1.49%
E)8.80%
Question
Question
Question
Question
If the numbers of accidents in any two months are independent, what is the probability that no car accidents occur in this lot for two consecutive months?
A).0121
B).1100
C).2200
D).8900
E)None of these
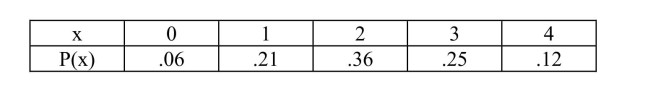
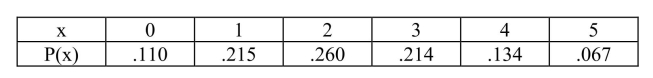
Let random variable x be the number of requests for transcripts to be sent to colleges
Received by the Counselors' office during a 1 hour period.x has the following
Probability distribution:
A).0121
B).1100
C).2200
D).8900
E)None of these
Let random variable x be the number of requests for transcripts to be sent to colleges
Received by the Counselors' office during a 1 hour period.x has the following
Probability distribution:
Question

 Questions 50 - 51 are based on the following information:
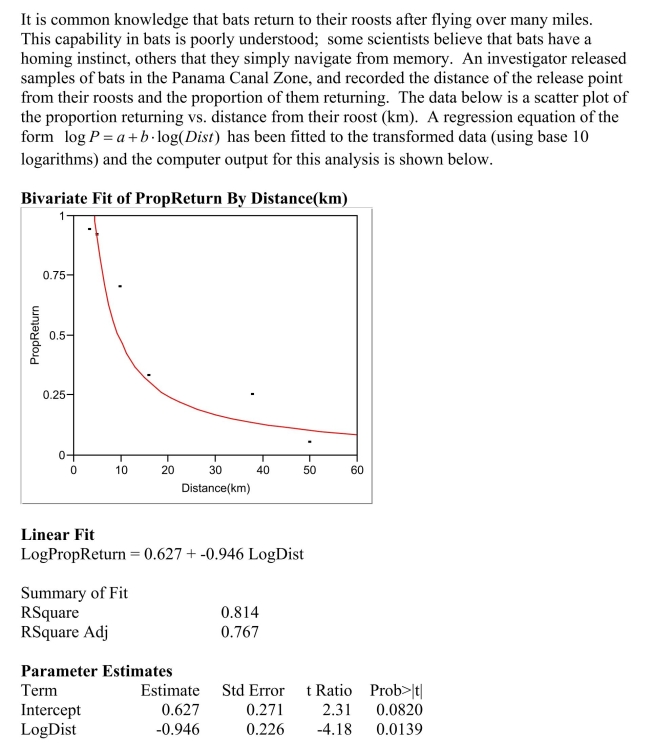
Question
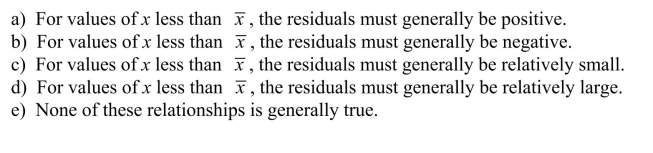
A good fit of the simple linear regression model would be characterized by 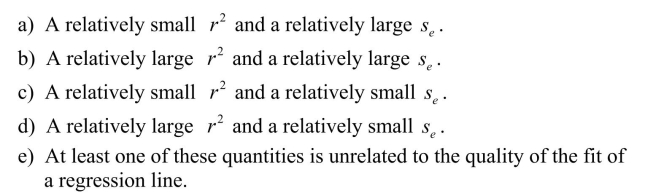 a regression line.
a regression line. Question
Question
Question
Question
Question
Use the following information for questions
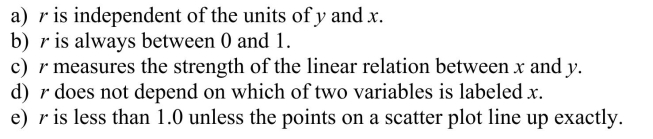
The residual associated with the observation that has a gasoline lead value of 82 metric tons and 4.5 micrograms per deciliter is in which interval below:
The residual associated with the observation that has a gasoline lead value of 82 metric tons and 4.5 micrograms per deciliter is in which interval below:
Question
Question
Question
Question
Question
Question
From this analysis, the proportion of bats returning that would be predicted for a release distance of 30 km is in which range below? 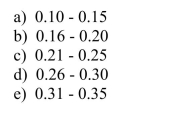
Question
The number of travel guides a vendor sells daily has the following probability distribution. 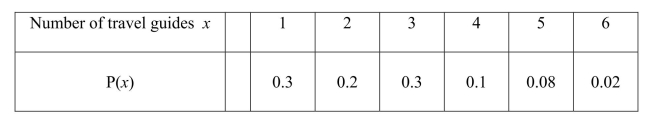 If each travel guide sells for $25, what is the expected daily total dollar amount taken in by the vendor from the sale of travel guides?
A)$30.00
B)$32.60
C)$61.50
D)$63.00
E)$101.00
If each travel guide sells for $25, what is the expected daily total dollar amount taken in by the vendor from the sale of travel guides?A)$30.00
B)$32.60
C)$61.50
D)$63.00
E)$101.00
Question
The event, not A is called the ____________ of event A.
A)negation
B)complement
C)union
D)intersection
E)conjunction
For questions 7 - 9, let x denote the number of accidents in a given month at a certain
High school parking lot.Suppose that the probability distribution of x is:
A)negation
B)complement
C)union
D)intersection
E)conjunction
For questions 7 - 9, let x denote the number of accidents in a given month at a certain
High school parking lot.Suppose that the probability distribution of x is:
Question
Question
A television game show has three payoffs with the following probabilities: 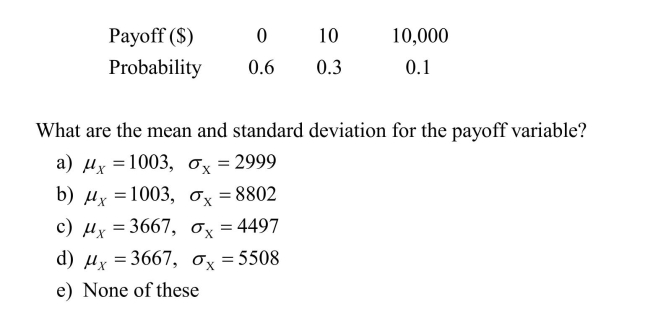
Question
 )
) Question
Question

Question
Consider the chance experiment of rolling a fair die and observing the number of dots facing up.The events, A and B, are defined as follows: 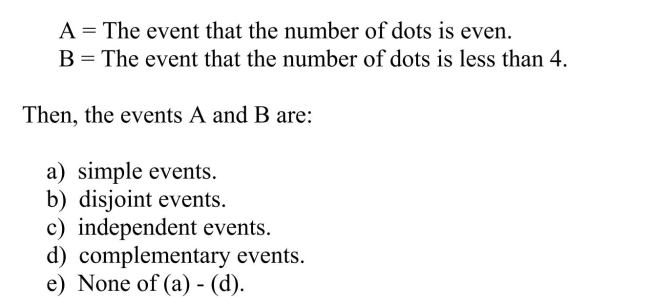
Question
Question
Question
Question
Question
Question
Question
Question
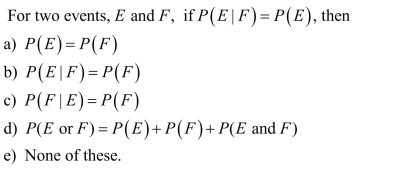
Which of the following is not a property of a geometric experiment? 
Question
Question
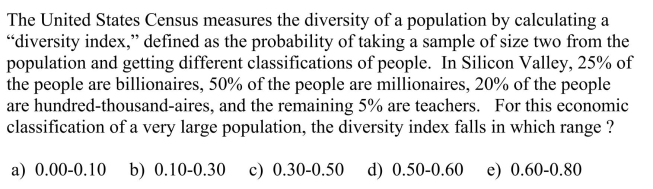
In a carnival shell game, a contestant can win a prize by guessing which one of 5 identical walnut shells is covering a small marble.After each guess, the shells are randomly shuffled outside the view of the contestant.If a person plays the carnival game 4 times, what is the probability he or she wins a prize exactly 2 times? 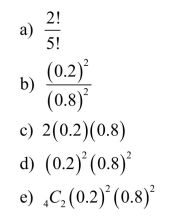
Question
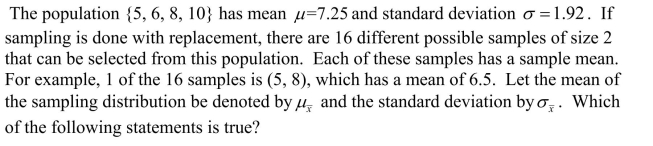
Which of the following rules is the Central Limit Theorem: 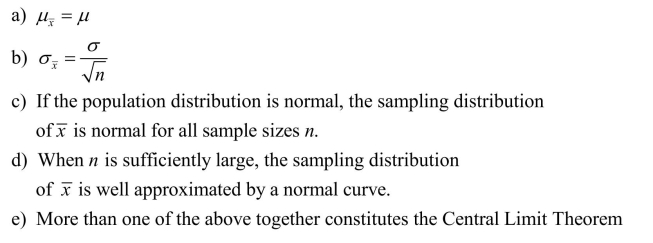
Question
The proportion of values in a normal population distribution that fall within 2 standard deviations of the mean is: 
Question
In agricultural states the regulation of insecticide use can be a divisive issue.Suppose that 70 percent of the population in a particular agricultural state is in favor of such regulation and 30 percent against.If a random sample of 800 people from this agricultural state is interviewed, what is the approximate probability that more than 200 of the people sampled will be against regulation of insecticides? 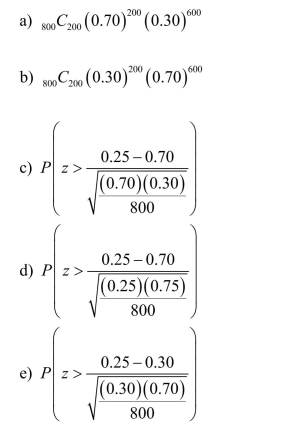
Question

Unlock Deck
Sign up to unlock the cards in this deck!
Unlock Deck
Unlock Deck
1/152
Play
Full screen (f)
Deck 17: Statistics and Probability Questions
1
Randomization, as a strategy in experimental design, would be unsuccessful if
A)extraneous factors varied in a systematic way.
B)blocks could not be formed.
C)there were an unequal n in the experimental groups.
D)aspects of the experimental condition other than the values of the explanatory variable, systematically favors a treatment.
E)aspects of the experimental condition other than the values of the response variable systematically favors a treatment.
D
2
A characteristic whose value may change from one individual to another is a:
A)variable
B)data point
C)factor
D)measurement
E)statistic
A)variable
B)data point
C)factor
D)measurement
E)statistic
A
3
An experiment is a planned intervention undertaken to observe the effects of
A)confounding variables.
B)explanatory variables.
C)experimental design as a whole.
D)extraneous factors.
E)blocking factors.
A)confounding variables.
B)explanatory variables.
C)experimental design as a whole.
D)extraneous factors.
E)blocking factors.
B
4
The sampling frame is the
A)list of all elements in a population.
B)boundary of a stratum.
C)fraction of inclusion in a systematic sample.
D)the basic plan for taking a simple random sample.
E)the set of individuals in the sample, if one per strata is sampled.
A)list of all elements in a population.
B)boundary of a stratum.
C)fraction of inclusion in a systematic sample.
D)the basic plan for taking a simple random sample.
E)the set of individuals in the sample, if one per strata is sampled.
Unlock Deck
Unlock for access to all 152 flashcards in this deck.
Unlock Deck
k this deck
5
In a study of dexterity, data was taken on 100 individuals.The variables measured for each person were the number of errors in picking up a dime in 50 trials, and the total time it took to pick up the dime 50 times.The data set is, therefore,
A)univariate.
B)numeric.
C)discrete.
D)continuous.
E)bivariate.
A)univariate.
B)numeric.
C)discrete.
D)continuous.
E)bivariate.
Unlock Deck
Unlock for access to all 152 flashcards in this deck.
Unlock Deck
k this deck
6
Two variables are confounded if
A)their effects on the treatments cannot be ascertained.
B)their effects on the sampling design cannot be observed.
C)their effects on the response variable cannot be distinguished.
D)their effects on the experimental design cannot be justified.
E)their effects on the blocking factor cannot be measured.
Unlock Deck
Unlock for access to all 152 flashcards in this deck.
Unlock Deck
k this deck
7
Jane Doe and Richard Roe are law students.Their scores on the midterms and finals in the Statistics for Law class, together with the means and standard deviations for these exams are given below: If their scores are transformed to z-scores, it is apparent that:
A)Jane did better than Richard on both exams.
B)Richard did better than Jane on both exams.
C)Jane did better on the first exam, Richard did better on the second.
D)Richard did better on the first exam, Jane did better on the second.
E)Richard and Jane did equally well on both exams.
If their scores are transformed to z-scores, it is apparent that:A)Jane did better than Richard on both exams.
B)Richard did better than Jane on both exams.
C)Jane did better on the first exam, Richard did better on the second.
D)Richard did better on the first exam, Jane did better on the second.
E)Richard and Jane did equally well on both exams.
Unlock Deck
Unlock for access to all 152 flashcards in this deck.
Unlock Deck
k this deck
8
The term used to describe the bias that occurs if some segment of a population is systematically excluded from a sample is
A)selection bias
B)measurement bias
C)response bias
D)exclusion bias
E)visibility bias
A)selection bias
B)measurement bias
C)response bias
D)exclusion bias
E)visibility bias
Unlock Deck
Unlock for access to all 152 flashcards in this deck.
Unlock Deck
k this deck
9
A treatment that has no active ingredients is a(n)
A)confounding treatment
B)experimental treatment
C)placebo treatment
D)observational treatment
E)biased treatment
A)confounding treatment
B)experimental treatment
C)placebo treatment
D)observational treatment
E)biased treatment
Unlock Deck
Unlock for access to all 152 flashcards in this deck.
Unlock Deck
k this deck
10
The Empirical Rule can be used when assessing a distribution if
A)the distribution is approximately normal.
B)the distribution is skewed.
C)the distribution is heavy tailed.
D)the standard deviation is close to the interquartile range.
E)the mean is equal to 0, and the standard deviation is equal to 1.
A)the distribution is approximately normal.
B)the distribution is skewed.
C)the distribution is heavy tailed.
D)the standard deviation is close to the interquartile range.
E)the mean is equal to 0, and the standard deviation is equal to 1.
Unlock Deck
Unlock for access to all 152 flashcards in this deck.
Unlock Deck
k this deck
11
The z-score and percentile are measures of
A)relative frequency
B)location
C)relative location
D)variability
E)approximate normality
A)relative frequency
B)location
C)relative location
D)variability
E)approximate normality
Unlock Deck
Unlock for access to all 152 flashcards in this deck.
Unlock Deck
k this deck
12
Blocking would be unsuccessful if
A)not every element in the population were measured.
B)not every element in the sample was located.
C)the blocks were heterogeneous on the blocking factor.
D)the blocks were homogeneous on the blocking factor.
E)one experimental treatment was a placebo.
A)not every element in the population were measured.
B)not every element in the sample was located.
C)the blocks were heterogeneous on the blocking factor.
D)the blocks were homogeneous on the blocking factor.
E)one experimental treatment was a placebo.
Unlock Deck
Unlock for access to all 152 flashcards in this deck.
Unlock Deck
k this deck
13
The design strategy of making multiple observations for each experimental condition is
A)stratified sampling.
B)systematic sampling.
C)resampling.
D)replication.
E)sampling with replacement.
A)stratified sampling.
B)systematic sampling.
C)resampling.
D)replication.
E)sampling with replacement.
Unlock Deck
Unlock for access to all 152 flashcards in this deck.
Unlock Deck
k this deck
14
The bias that occurs because observations were not made of all individuals selected for a sample is
A)response bias
B)selection bias
C)sampling bias
D)non-response bias
E)measurement bias
A)response bias
B)selection bias
C)sampling bias
D)non-response bias
E)measurement bias
Unlock Deck
Unlock for access to all 152 flashcards in this deck.
Unlock Deck
k this deck
15
A study cannot be an experiment if
A)only a subset of an existing population is measured.
B)a well-defined procedure of random sampling is not constructed.
C)a bias in measures is discovered.
D)a confounding variable is identified.
E)a procedure of random assignment to treatments is not performed.
A)only a subset of an existing population is measured.
B)a well-defined procedure of random sampling is not constructed.
C)a bias in measures is discovered.
D)a confounding variable is identified.
E)a procedure of random assignment to treatments is not performed.
Unlock Deck
Unlock for access to all 152 flashcards in this deck.
Unlock Deck
k this deck
16
In utilizing direct control, which of the following are held constant?
A)values of an extraneous variable
B)values of a blocking variable
C)values of a response variable
D)values of an explanatory variable
E)values of a lurking variable
A)values of an extraneous variable
B)values of a blocking variable
C)values of a response variable
D)values of an explanatory variable
E)values of a lurking variable
Unlock Deck
Unlock for access to all 152 flashcards in this deck.
Unlock Deck
k this deck
17
By definition, a subset of a population selected for study is a
A)sample
B)simple random sample
C)cluster sample
D)systematic sample
E)None of these
A)sample
B)simple random sample
C)cluster sample
D)systematic sample
E)None of these
Unlock Deck
Unlock for access to all 152 flashcards in this deck.
Unlock Deck
k this deck
18
The distinction between descriptive and inferential statistics is that
A)descriptive statistics are numeric, inferential statistics are graphic.
B)descriptive statistics are mean-based, inferential statistics are median-based.
C)descriptive statistics describe data sets, inferential statistics involve generalizing to populations.
D)descriptive statistics are used in social science, inferential statistics are used in physical sciences.
E)None of these.
Unlock Deck
Unlock for access to all 152 flashcards in this deck.
Unlock Deck
k this deck
19
According to Chebyshev's Rule, at least what percent of data is within 5 standard deviations of the mean?
A)89
B)94
C)95
D)96
E)99
A)89
B)94
C)95
D)96
E)99
Unlock Deck
Unlock for access to all 152 flashcards in this deck.
Unlock Deck
k this deck
20
By definition, a simple random sample is one such that
A)each individual has an equal chance of being selected.
B)each possible sample of size n has an equal chance of being selected.
C)each nth person has an equal chance of being selected.
D)each element in every stratum has an equal chance of being selected.
E)None of these are a part of the definition.
Unlock Deck
Unlock for access to all 152 flashcards in this deck.
Unlock Deck
k this deck
21
In a study of male / female differences in carnivores, the height of the canine teeth in the
lower jaws were measured.The data below are graphic representations of these data.
Use these graphs to answer questions below.
When constructing a modified box plot, one must find the upper and lower mild outlier cutoffs.For these data, the upper mild outlier cutoff would be:
lower jaws were measured.The data below are graphic representations of these data.
Use these graphs to answer questions below.
When constructing a modified box plot, one must find the upper and lower mild outlier cutoffs.For these data, the upper mild outlier cutoff would be:
Unlock Deck
Unlock for access to all 152 flashcards in this deck.
Unlock Deck
k this deck
22
It is possible for a distribution to be
A)heavy tailed and skewed
B)light tailed and skewed
C)skewed and normal
D)heavy tailed and normal
E)symmetric and normal
A)heavy tailed and skewed
B)light tailed and skewed
C)skewed and normal
D)heavy tailed and normal
E)symmetric and normal
Unlock Deck
Unlock for access to all 152 flashcards in this deck.
Unlock Deck
k this deck
23
A)16 and 25
B)12 and 30
C)12 and 18
D)12, 17, 16, and 18
E)12, 13, 30, and 25
Unlock Deck
Unlock for access to all 152 flashcards in this deck.
Unlock Deck
k this deck
24
A distribution can have more than one
A)mean
B)interquartile range
C)standard deviation
D)mode
E)median
A)mean
B)interquartile range
C)standard deviation
D)mode
E)median
Unlock Deck
Unlock for access to all 152 flashcards in this deck.
Unlock Deck
k this deck
25
In a study of male / female differences in carnivores, the height of the canine teeth in the
lower jaws were measured.The data below are graphic representations of these data.
Use these graphs to answer questions below.
The median of the lower canine tooth heights is:
lower jaws were measured.The data below are graphic representations of these data.
Use these graphs to answer questions below.
The median of the lower canine tooth heights is:
Unlock Deck
Unlock for access to all 152 flashcards in this deck.
Unlock Deck
k this deck
26
Suppose that a frequency distribution and a cumulative frequency distribution are constructed from the same set of data, using the same classes.Then, for each class,
Unlock Deck
Unlock for access to all 152 flashcards in this deck.
Unlock Deck
k this deck
27
A)2
B)3
C)4
D)5
E)6
Unlock Deck
Unlock for access to all 152 flashcards in this deck.
Unlock Deck
k this deck
28
In a study of hatchling resting metabolism, three species, labeled A, B, and C below,
were studied.Below is a pie chart of the sample sizes for each of the species.36
hatchlings were studied in total.
Based on the pie chart, about how many of the hatchlings were Species C hatchlings?
A)8
B)12
C)20
D)24
E)30
were studied.Below is a pie chart of the sample sizes for each of the species.36
hatchlings were studied in total.
Based on the pie chart, about how many of the hatchlings were Species C hatchlings?
A)8
B)12
C)20
D)24
E)30
Unlock Deck
Unlock for access to all 152 flashcards in this deck.
Unlock Deck
k this deck
29
Use the following frequency table to determine the proportion of values less than 60.
A)0.187
B)0.200
C)0.213
D)0.240
E)0.600
A)0.187
B)0.200
C)0.213
D)0.240
E)0.600
Unlock Deck
Unlock for access to all 152 flashcards in this deck.
Unlock Deck
k this deck
30
Suppose I have a set of data with 5 numbers: -6.0, -4.5, 0, 5.0, and an unknown 5th number.For these 5 data points, which of the following statistics can NEVER be greater than zero?
A)the arithmetic mean
B)the sample standard deviation
C)the interquartile range
D)the median
E)the 20% trimmed mean
A)the arithmetic mean
B)the sample standard deviation
C)the interquartile range
D)the median
E)the 20% trimmed mean
Unlock Deck
Unlock for access to all 152 flashcards in this deck.
Unlock Deck
k this deck
31
The two points to the lower left of the original plot are the two points where zero species were observed.If these points are judged to be erroneous observations and deleted from the analysis, what would be the effect of the deletion on the sample statistics and best fit line for this data?
A)The mean species observed and slope of the best fit line would be larger.
B)The standard deviation of pH would increase and the slope would be smaller.
C)The mean and standard deviation of the pH would be larger.
D)The mean and standard deviation of the species observed would be larger.
E)The standard deviation of pH would decrease and the slope would be smaller.
Unlock Deck
Unlock for access to all 152 flashcards in this deck.
Unlock Deck
k this deck
32
By definition, strata are groups of population units that
A)form well defined subpopulations.
B)are selected for the study from the sampling frame.
C)are selected for the study by a random sampling process.
D)are typically heterogeneous
E)respond in characteristic ways to the explanatory variable
A)form well defined subpopulations.
B)are selected for the study from the sampling frame.
C)are selected for the study by a random sampling process.
D)are typically heterogeneous
E)respond in characteristic ways to the explanatory variable
Unlock Deck
Unlock for access to all 152 flashcards in this deck.
Unlock Deck
k this deck
33
Suppose that for a set of numeric data, where the numbers are not all different, the standard deviation is less than 1.0.Then it must be true that For questions 39-40, refer to the information below and the scatterplots of observed species and pH.The data is from 15 tributaries of Millers River in north-central Massachusetts, presenting the number of fish species vs.the mean pH level of the stream in 1983.
For questions 39-40, refer to the information below and the scatterplots of observed species and pH.The data is from 15 tributaries of Millers River in north-central Massachusetts, presenting the number of fish species vs.the mean pH level of the stream in 1983. Unlock Deck
Unlock for access to all 152 flashcards in this deck.
Unlock Deck
k this deck
34
Which of the following variables yields data that would be suitable for use in a histogram?
A)color of hair
B)brand of stereo
C)species of trees
D)gender of an individual
E)length of a phone call
A)color of hair
B)brand of stereo
C)species of trees
D)gender of an individual
E)length of a phone call
Unlock Deck
Unlock for access to all 152 flashcards in this deck.
Unlock Deck
k this deck
35
In terms of sensitivity to outliers, which is the correct ordering of the following statistics from least sensitive to most sensitive? In other words, if the following statistics were ordered like this: what should the ordering be?
what should the ordering be? Unlock Deck
Unlock for access to all 152 flashcards in this deck.
Unlock Deck
k this deck
36
In a study of hatchling resting metabolism, the yolk-free dry body mass for different
species of birds was gathered.A histogram of this data and possible box plots are shown
below, with numeric scales deleted.
Of the following boxplots, which best matches the histogram?
species of birds was gathered.A histogram of this data and possible box plots are shown
below, with numeric scales deleted.
Of the following boxplots, which best matches the histogram?
Unlock Deck
Unlock for access to all 152 flashcards in this deck.
Unlock Deck
k this deck
37
The percentage of data points falling at or below the upper quartile is
A)25
B)50
C)75
D)100
E)None of these
A)25
B)50
C)75
D)100
E)None of these
Unlock Deck
Unlock for access to all 152 flashcards in this deck.
Unlock Deck
k this deck
38
For which of the following statistics would one not need to put the data in order from smallest to largest?
A)the interquartile range
B)the trimmed mean
C)the median
D)the range
E)the variance
A)the interquartile range
B)the trimmed mean
C)the median
D)the range
E)the variance
Unlock Deck
Unlock for access to all 152 flashcards in this deck.
Unlock Deck
k this deck
39
A data set consisting of observations on two or more attributes is called a(n)
A)univariate data set
B)multivariate data set
C)multifactor data set
D)stratified data set
E)bivariate data set
A)univariate data set
B)multivariate data set
C)multifactor data set
D)stratified data set
E)bivariate data set
Unlock Deck
Unlock for access to all 152 flashcards in this deck.
Unlock Deck
k this deck
40
In a study of male / female differences in carnivores, the height of the canine teeth in the
lower jaws were measured.The data below are graphic representations of these data.
Use these graphs to answer questions below.
Considering the graphic displays, the best description of these data would be:
A)Skewed left
B)Skewed right
C)Symmetric
D)Bimodal
E)Light tailed
lower jaws were measured.The data below are graphic representations of these data.
Use these graphs to answer questions below.
Considering the graphic displays, the best description of these data would be:
A)Skewed left
B)Skewed right
C)Symmetric
D)Bimodal
E)Light tailed
Unlock Deck
Unlock for access to all 152 flashcards in this deck.
Unlock Deck
k this deck
41
Use the following information for questions
Approximately what percentage of the variation in umbilical lead concentrations can be explained by the linear model?
A)67.3%
B)36.22%
C)45.3%
D)1.49%
E)8.80%
Approximately what percentage of the variation in umbilical lead concentrations can be explained by the linear model?
A)67.3%
B)36.22%
C)45.3%
D)1.49%
E)8.80%
Unlock Deck
Unlock for access to all 152 flashcards in this deck.
Unlock Deck
k this deck
42
A numerical variable whose value depends on the outcome of a chance experiment is called
A)an outcome.
B)a trial.
C)a simulation.
D)a random variable.
E)a probability distribution.
A)an outcome.
B)a trial.
C)a simulation.
D)a random variable.
E)a probability distribution.
Unlock Deck
Unlock for access to all 152 flashcards in this deck.
Unlock Deck
k this deck
43
What is the probability that 2 to 4 (inclusive)accidents occur in a given month?
A).126
B).134
C).394
D).608
E)None of these
A).126
B).134
C).394
D).608
E)None of these
Unlock Deck
Unlock for access to all 152 flashcards in this deck.
Unlock Deck
k this deck
44
Which of the following indicates that an association between x and y is positive?
A)A positive coefficient of determination
B)A positive standard deviation about the least squares line
C)A positive intercept of the least squares line
D)A positive Pearson's correlation coefficient
E)A positive residual sum of squares
A)A positive coefficient of determination
B)A positive standard deviation about the least squares line
C)A positive intercept of the least squares line
D)A positive Pearson's correlation coefficient
E)A positive residual sum of squares
Unlock Deck
Unlock for access to all 152 flashcards in this deck.
Unlock Deck
k this deck
45
If the numbers of accidents in any two months are independent, what is the probability that no car accidents occur in this lot for two consecutive months?
A).0121
B).1100
C).2200
D).8900
E)None of these
Let random variable x be the number of requests for transcripts to be sent to colleges
Received by the Counselors' office during a 1 hour period.x has the following
Probability distribution:
A).0121
B).1100
C).2200
D).8900
E)None of these
Let random variable x be the number of requests for transcripts to be sent to colleges
Received by the Counselors' office during a 1 hour period.x has the following
Probability distribution:
Unlock Deck
Unlock for access to all 152 flashcards in this deck.
Unlock Deck
k this deck
46
Questions 50 - 51 are based on the following information: Unlock Deck
Unlock for access to all 152 flashcards in this deck.
Unlock Deck
k this deck
47
A good fit of the simple linear regression model would be characterized by a regression line.
a regression line. Unlock Deck
Unlock for access to all 152 flashcards in this deck.
Unlock Deck
k this deck
48
The slope of the regression line and the correlation between two variables is related in the following way:
A)The slope is always greater in absolute value than the correlation.
B)The slope and correlation must be of the same sign.
C)The slope and correlation must be of different sign.
D)The slope is always less in absolute value than the correlation.
E)None of (a)- (d)is necessarily true.
A)The slope is always greater in absolute value than the correlation.
B)The slope and correlation must be of the same sign.
C)The slope and correlation must be of different sign.
D)The slope is always less in absolute value than the correlation.
E)None of (a)- (d)is necessarily true.
Unlock Deck
Unlock for access to all 152 flashcards in this deck.
Unlock Deck
k this deck
49
The fit of the data indicates that on average the estimates of the logs of the proportion returning are declining as the logarithm of the distance increases. The number in the table that indicates this is:
A)the slope of the regression line
B)the intercept of the regression line
C)the RSquare
D)the Adjusted RSquare
E)the t-ratio of the LogDist
A)the slope of the regression line
B)the intercept of the regression line
C)the RSquare
D)the Adjusted RSquare
E)the t-ratio of the LogDist
Unlock Deck
Unlock for access to all 152 flashcards in this deck.
Unlock Deck
k this deck
50
What is the probability that there are fewer than 3 accidents in a given month?
A).201
B).214
C).585
D).799
E)None of these
A).201
B).214
C).585
D).799
E)None of these
Unlock Deck
Unlock for access to all 152 flashcards in this deck.
Unlock Deck
k this deck
51
Unlock Deck
Unlock for access to all 152 flashcards in this deck.
Unlock Deck
k this deck
52
Use the following information for questions
The residual associated with the observation that has a gasoline lead value of 82 metric tons and 4.5 micrograms per deciliter is in which interval below:
The residual associated with the observation that has a gasoline lead value of 82 metric tons and 4.5 micrograms per deciliter is in which interval below:
Unlock Deck
Unlock for access to all 152 flashcards in this deck.
Unlock Deck
k this deck
53
When regressing y on x, y is referred to as the
A)response variable
B)independent variable
C)predictor variable
D)explanatory variable
E)regressor variable
A)response variable
B)independent variable
C)predictor variable
D)explanatory variable
E)regressor variable
Unlock Deck
Unlock for access to all 152 flashcards in this deck.
Unlock Deck
k this deck
54
A point is called an influential point if:
A)it has a residual with a large absolute value compared to se .
B)it has a residual with a large absolute value compared to the mean residual.
C)it plays a large role in determining the slope of the least squares line.
D)it plays a small role in determining the correlation coefficient.
E)it plays a large role in determining the coefficient of determination.
Unlock Deck
Unlock for access to all 152 flashcards in this deck.
Unlock Deck
k this deck
55
Which of the following random variables is not discrete?
A)the number of courses in which a college student is enrolled
B)the number of attempts needed in order to successfully complete a task
C)the distance traveled by a motorcycle on one gallon of gas
D)the number in a group of 20 people who have college degrees
E)the number of words on an 8.5 x 11 inch sheet of paper
Unlock Deck
Unlock for access to all 152 flashcards in this deck.
Unlock Deck
k this deck
56
Unlock Deck
Unlock for access to all 152 flashcards in this deck.
Unlock Deck
k this deck
57
Which of the following random variables is not continuous?
A)the birth weight of a newborn baby
B)the number of fumbles in a football game
C)the length of life of a 60 watt light bulb
D)time from take-off to landing of an airline flight
E)the velocity of an asteroid
A)the birth weight of a newborn baby
B)the number of fumbles in a football game
C)the length of life of a 60 watt light bulb
D)time from take-off to landing of an airline flight
E)the velocity of an asteroid
Unlock Deck
Unlock for access to all 152 flashcards in this deck.
Unlock Deck
k this deck
58
From this analysis, the proportion of bats returning that would be predicted for a release distance of 30 km is in which range below?
Unlock Deck
Unlock for access to all 152 flashcards in this deck.
Unlock Deck
k this deck
59
The number of travel guides a vendor sells daily has the following probability distribution. If each travel guide sells for $25, what is the expected daily total dollar amount taken in by the vendor from the sale of travel guides?
A)$30.00
B)$32.60
C)$61.50
D)$63.00
E)$101.00
If each travel guide sells for $25, what is the expected daily total dollar amount taken in by the vendor from the sale of travel guides?A)$30.00
B)$32.60
C)$61.50
D)$63.00
E)$101.00
Unlock Deck
Unlock for access to all 152 flashcards in this deck.
Unlock Deck
k this deck
60
The event, not A is called the ____________ of event A.
A)negation
B)complement
C)union
D)intersection
E)conjunction
For questions 7 - 9, let x denote the number of accidents in a given month at a certain
High school parking lot.Suppose that the probability distribution of x is:
A)negation
B)complement
C)union
D)intersection
E)conjunction
For questions 7 - 9, let x denote the number of accidents in a given month at a certain
High school parking lot.Suppose that the probability distribution of x is:
Unlock Deck
Unlock for access to all 152 flashcards in this deck.
Unlock Deck
k this deck
61
Unlock Deck
Unlock for access to all 152 flashcards in this deck.
Unlock Deck
k this deck
62
A television game show has three payoffs with the following probabilities:
Unlock Deck
Unlock for access to all 152 flashcards in this deck.
Unlock Deck
k this deck
63
) Unlock Deck
Unlock for access to all 152 flashcards in this deck.
Unlock Deck
k this deck
64
A normal probability plot suggests that a normal probability model is plausible when:
A)no obvious patterns are present in the plot.
B)a bell-shaped pattern is present in the plot.
C)a substantial nonlinear pattern is present in the plot.
D)a substantial linear pattern is present in the plot.
E)any of the above is present in the plot.
A)no obvious patterns are present in the plot.
B)a bell-shaped pattern is present in the plot.
C)a substantial nonlinear pattern is present in the plot.
D)a substantial linear pattern is present in the plot.
E)any of the above is present in the plot.
Unlock Deck
Unlock for access to all 152 flashcards in this deck.
Unlock Deck
k this deck
65
Unlock Deck
Unlock for access to all 152 flashcards in this deck.
Unlock Deck
k this deck
66
Consider the chance experiment of rolling a fair die and observing the number of dots facing up.The events, A and B, are defined as follows:
Unlock Deck
Unlock for access to all 152 flashcards in this deck.
Unlock Deck
k this deck
67
Which of the following statements about normal curves is false?
A)Every normal curve is symmetric.
B)Every normal curve is symmetric about 0.
C)Every normal curve is bell-shaped.
D)Every normal curve is centered at its mean.
E)About 0.68 of the area under a normal curve is within 1 standard deviation of its mean.
A)Every normal curve is symmetric.
B)Every normal curve is symmetric about 0.
C)Every normal curve is bell-shaped.
D)Every normal curve is centered at its mean.
E)About 0.68 of the area under a normal curve is within 1 standard deviation of its mean.
Unlock Deck
Unlock for access to all 152 flashcards in this deck.
Unlock Deck
k this deck
68
The observed value of a statistic will differ from sample to sample.This phenomenon is known as:
A)the sampling distribution
B)sampling error
C)sampling bias
D)sampling variability
E)None of these
A)the sampling distribution
B)sampling error
C)sampling bias
D)sampling variability
E)None of these
Unlock Deck
Unlock for access to all 152 flashcards in this deck.
Unlock Deck
k this deck
69
Unlock Deck
Unlock for access to all 152 flashcards in this deck.
Unlock Deck
k this deck
70
Unlock Deck
Unlock for access to all 152 flashcards in this deck.
Unlock Deck
k this deck
71
Unlock Deck
Unlock for access to all 152 flashcards in this deck.
Unlock Deck
k this deck
72
The mean value of x is:
A)2.00
B).20
C).36
D)2.16
E)None of (a)- (d)
A)2.00
B).20
C).36
D)2.16
E)None of (a)- (d)
Unlock Deck
Unlock for access to all 152 flashcards in this deck.
Unlock Deck
k this deck
73
Unlock Deck
Unlock for access to all 152 flashcards in this deck.
Unlock Deck
k this deck
74
Which of the following is not a property of a geometric experiment?
Unlock Deck
Unlock for access to all 152 flashcards in this deck.
Unlock Deck
k this deck
75
Unlock Deck
Unlock for access to all 152 flashcards in this deck.
Unlock Deck
k this deck
76
In a carnival shell game, a contestant can win a prize by guessing which one of 5 identical walnut shells is covering a small marble.After each guess, the shells are randomly shuffled outside the view of the contestant.If a person plays the carnival game 4 times, what is the probability he or she wins a prize exactly 2 times?
Unlock Deck
Unlock for access to all 152 flashcards in this deck.
Unlock Deck
k this deck
77
Which of the following rules is the Central Limit Theorem:
Unlock Deck
Unlock for access to all 152 flashcards in this deck.
Unlock Deck
k this deck
78
The proportion of values in a normal population distribution that fall within 2 standard deviations of the mean is:
Unlock Deck
Unlock for access to all 152 flashcards in this deck.
Unlock Deck
k this deck
79
In agricultural states the regulation of insecticide use can be a divisive issue.Suppose that 70 percent of the population in a particular agricultural state is in favor of such regulation and 30 percent against.If a random sample of 800 people from this agricultural state is interviewed, what is the approximate probability that more than 200 of the people sampled will be against regulation of insecticides?
Unlock Deck
Unlock for access to all 152 flashcards in this deck.
Unlock Deck
k this deck
80
Suppose that in a certain part of the world, in any 50-year period the probability of a plague is 0.39, the probability of a famine is 0.52, and the probability of both a plague and a famine is 0.15.What is the probability of a famine given that there is a plague?
A)0.240
B)0.288
C)0.370
D)0.385
E)0.760
A)0.240
B)0.288
C)0.370
D)0.385
E)0.760
Unlock Deck
Unlock for access to all 152 flashcards in this deck.
Unlock Deck
k this deck
Unlock Deck
Unlock for access to all 152 flashcards in this deck.


