Deck 5: Summarizing Bivariate Data
Full screen (f)
Question
Question
Question
Question
Question

Question
Question
Question
a)What is the equation of the least squares 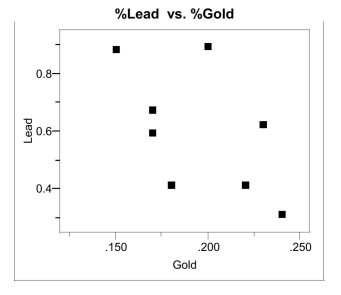 c)What is the value of the correlation coefficient? Interpret this value. d)What is the value of the coefficient of determination? Give an interpretation of this value.
c)What is the value of the correlation coefficient? Interpret this value. d)What is the value of the coefficient of determination? Give an interpretation of this value. Question
Question
Question
In the 19th Century, venereal diseases were the major preventable diseases striking soldiers far from home.During the American Civil War, the United States Army kept records on soldiers diagnosed with syphilis and gonorrhea.An analysis of the incidence of these diseases is presented below.(Incidence is the rate of increase in the number of cases - for these data, the incidence is number of soldiers per 100,000 per month.) 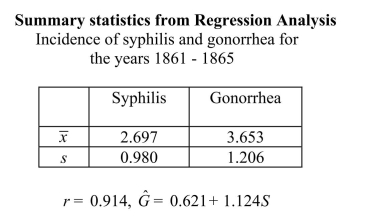 a)If, at a particular point in time, the incidence rate for Syphilis is one standard deviation above the mean, what would be the predicted incidence rate for gonorrhea? b)What proportion of the variability in the incidence of gonorrhea is accounted for by the incidence of syphilis? c)From the information presented above, does it appear that the incidence of gonorrhea can be accurately predicted from the incidence of syphilis? Provide statistical evidence for your response.
a)If, at a particular point in time, the incidence rate for Syphilis is one standard deviation above the mean, what would be the predicted incidence rate for gonorrhea? b)What proportion of the variability in the incidence of gonorrhea is accounted for by the incidence of syphilis? c)From the information presented above, does it appear that the incidence of gonorrhea can be accurately predicted from the incidence of syphilis? Provide statistical evidence for your response. Question
Question
Question
Golden-rumped elephant shrews have long flexible snouts, used to overturn leaf-litter where they find their food: millipedes, insects and spiders.These animals are among the approximately 10% of mammalian species that mate for life.Just why these mammals are monogamous is poorly understood, and one theory is that a monogamous male would have to defend less territory from intrusion by other males. The home range of an animal, i.e.that area over which they typically travel, is a function of diet and energy consumption of the animal.The energy consumption is, in turn, typically a function of the animal's size.In a recent study, investigators reasoned that if monogamy was related in some way to the home territory, this should be detectable by comparing these animals to other insect-eating mammals.Data were gathered on 27 similar species and is presented in the table below. 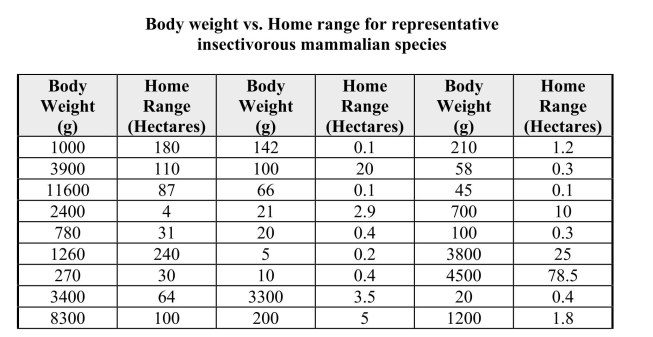 After fitting a straight line model,
  , significant curvature was detected in the residual plot, and two transformed models were chosen for further analysis: the power and exponential models.The computer output for these transformed models and the residual plots follow on the next page.
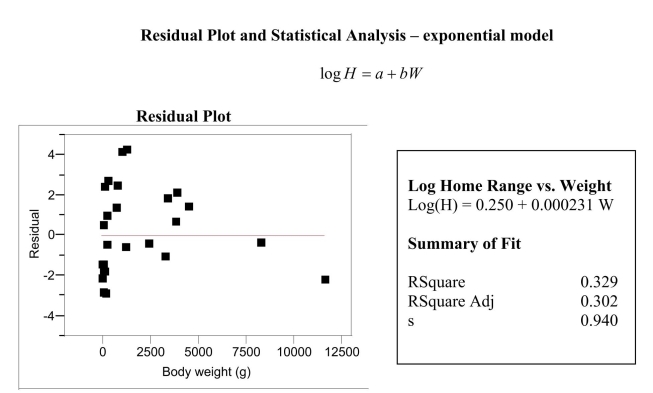
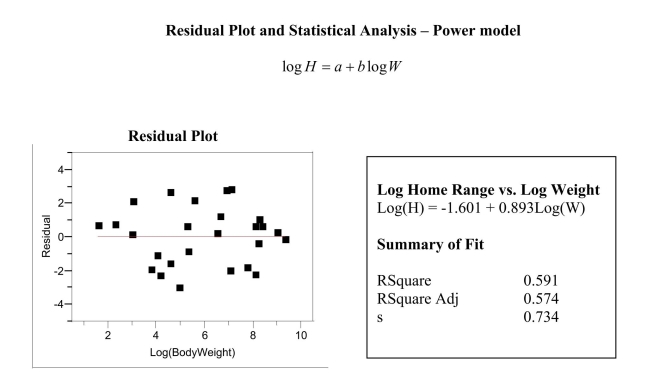 a)For the exponential model, calculate the predicted log (Home Range)for a Weight of 1000g. b)Generally speaking, which of the two models, power or exponential, is better at predicting the log (Home Range)? Provide statistical justification for your choice. c)These shrews typically weigh 550g and their home range is about 2.9 hectares.Using your preferred model from part (c), locate the Golden-rumped elephant shrew on the appropriate residual plot by marking with a small "x." Does your placement of this point suggest the monogamy of these shrews sets them apart from similar species? In a few sentences, explain why or why not.
After fitting a straight line model, , significant curvature was detected in the residual plot, and two transformed models were chosen for further analysis: the power and exponential models.The computer output for these transformed models and the residual plots follow on the next page. a)For the exponential model, calculate the predicted log (Home Range)for a Weight of 1000g. b)Generally speaking, which of the two models, power or exponential, is better at predicting the log (Home Range)? Provide statistical justification for your choice. c)These shrews typically weigh 550g and their home range is about 2.9 hectares.Using your preferred model from part (c), locate the Golden-rumped elephant shrew on the appropriate residual plot by marking with a small "x." Does your placement of this point suggest the monogamy of these shrews sets them apart from similar species? In a few sentences, explain why or why not. Question
Question
The least squares line passes through the point 
Question

Unlock Deck
Sign up to unlock the cards in this deck!
Unlock Deck
Unlock Deck
1/17
Play
Full screen (f)
Deck 5: Summarizing Bivariate Data
1
Pearson's correlation coefficient, r, does not depend on the units of measurement of the two variables.
True
2
The value of the residual plusˆyiis equal toyi .
True
3
The slopes of the least squares lines for predicting y from x, and the least squares line for predicting x from y, are equal.
False
4
The higher the value of the coefficient of determination, the greater the evidence for a causal relationship between x and y.
Unlock Deck
Unlock for access to all 17 flashcards in this deck.
Unlock Deck
k this deck
5
Unlock Deck
Unlock for access to all 17 flashcards in this deck.
Unlock Deck
k this deck
6
A transformation, or reexpression, of a variable is accomplished by substituting a function of the variable in place of the variable for further analysis.
Unlock Deck
Unlock for access to all 17 flashcards in this deck.
Unlock Deck
k this deck
7
The value of Pearson's r is always between 0 and 1.
Unlock Deck
Unlock for access to all 17 flashcards in this deck.
Unlock Deck
k this deck
8
a)What is the equation of the least squares c)What is the value of the correlation coefficient? Interpret this value. d)What is the value of the coefficient of determination? Give an interpretation of this value.
c)What is the value of the correlation coefficient? Interpret this value. d)What is the value of the coefficient of determination? Give an interpretation of this value. Unlock Deck
Unlock for access to all 17 flashcards in this deck.
Unlock Deck
k this deck
9
Suppose that the coins analyzed in problem 1 are representative of the metallurgical content of coins minted in Rome during the first 300 years AD. a)If a Roman coin is selected at random, and it's gold content is 0.20% by weight, calculate the predicted lead content.Be sure to use correct notation and units. c)One of the coins used to calculate the regression equations has a gold content of 0.200%.Calculate the residual for this coin.Be sure to use correct notation and units. d)The investigators would like to use the regression equation to help assess whether a coin is locally minted or minted in Rome.In a few sentences, describe how the regression equation could be used for this purpose.(Hint: In order to use the equation for this purpose, how would coins minted in local mints in the Eastern Provinces have to differ from Roman coins?)
Unlock Deck
Unlock for access to all 17 flashcards in this deck.
Unlock Deck
k this deck
10
The standard deviation about the least squares line is roughly the typical amount by which an observation deviates from the least squares line.
Unlock Deck
Unlock for access to all 17 flashcards in this deck.
Unlock Deck
k this deck
11
In the 19th Century, venereal diseases were the major preventable diseases striking soldiers far from home.During the American Civil War, the United States Army kept records on soldiers diagnosed with syphilis and gonorrhea.An analysis of the incidence of these diseases is presented below.(Incidence is the rate of increase in the number of cases - for these data, the incidence is number of soldiers per 100,000 per month.) a)If, at a particular point in time, the incidence rate for Syphilis is one standard deviation above the mean, what would be the predicted incidence rate for gonorrhea? b)What proportion of the variability in the incidence of gonorrhea is accounted for by the incidence of syphilis? c)From the information presented above, does it appear that the incidence of gonorrhea can be accurately predicted from the incidence of syphilis? Provide statistical evidence for your response.
a)If, at a particular point in time, the incidence rate for Syphilis is one standard deviation above the mean, what would be the predicted incidence rate for gonorrhea? b)What proportion of the variability in the incidence of gonorrhea is accounted for by the incidence of syphilis? c)From the information presented above, does it appear that the incidence of gonorrhea can be accurately predicted from the incidence of syphilis? Provide statistical evidence for your response. Unlock Deck
Unlock for access to all 17 flashcards in this deck.
Unlock Deck
k this deck
12
If on average y increases as x increases, the correlation coefficient is positive.
Unlock Deck
Unlock for access to all 17 flashcards in this deck.
Unlock Deck
k this deck
13
The coefficient of determination is equal to the positive square root of Pearson's r.
Unlock Deck
Unlock for access to all 17 flashcards in this deck.
Unlock Deck
k this deck
14
Golden-rumped elephant shrews have long flexible snouts, used to overturn leaf-litter where they find their food: millipedes, insects and spiders.These animals are among the approximately 10% of mammalian species that mate for life.Just why these mammals are monogamous is poorly understood, and one theory is that a monogamous male would have to defend less territory from intrusion by other males. The home range of an animal, i.e.that area over which they typically travel, is a function of diet and energy consumption of the animal.The energy consumption is, in turn, typically a function of the animal's size.In a recent study, investigators reasoned that if monogamy was related in some way to the home territory, this should be detectable by comparing these animals to other insect-eating mammals.Data were gathered on 27 similar species and is presented in the table below. After fitting a straight line model, , significant curvature was detected in the residual plot, and two transformed models were chosen for further analysis: the power and exponential models.The computer output for these transformed models and the residual plots follow on the next page. a)For the exponential model, calculate the predicted log (Home Range)for a Weight of 1000g. b)Generally speaking, which of the two models, power or exponential, is better at predicting the log (Home Range)? Provide statistical justification for your choice. c)These shrews typically weigh 550g and their home range is about 2.9 hectares.Using your preferred model from part (c), locate the Golden-rumped elephant shrew on the appropriate residual plot by marking with a small "x." Does your placement of this point suggest the monogamy of these shrews sets them apart from similar species? In a few sentences, explain why or why not.
After fitting a straight line model, , significant curvature was detected in the residual plot, and two transformed models were chosen for further analysis: the power and exponential models.The computer output for these transformed models and the residual plots follow on the next page. a)For the exponential model, calculate the predicted log (Home Range)for a Weight of 1000g. b)Generally speaking, which of the two models, power or exponential, is better at predicting the log (Home Range)? Provide statistical justification for your choice. c)These shrews typically weigh 550g and their home range is about 2.9 hectares.Using your preferred model from part (c), locate the Golden-rumped elephant shrew on the appropriate residual plot by marking with a small "x." Does your placement of this point suggest the monogamy of these shrews sets them apart from similar species? In a few sentences, explain why or why not. Unlock Deck
Unlock for access to all 17 flashcards in this deck.
Unlock Deck
k this deck
15
If r is close to 1, then the points lie close to a straight line with apositive slope.
Unlock Deck
Unlock for access to all 17 flashcards in this deck.
Unlock Deck
k this deck
16
The least squares line passes through the point
Unlock Deck
Unlock for access to all 17 flashcards in this deck.
Unlock Deck
k this deck
17
The slope of the least squares line is the average amount by which y increases as x increases by one unit.
Unlock Deck
Unlock for access to all 17 flashcards in this deck.
Unlock Deck
k this deck
Unlock Deck
Unlock for access to all 17 flashcards in this deck.


