Deck 11: Comparing Two Populations or Treatments
Full screen (f)
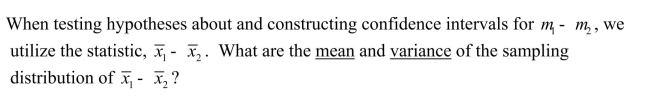
Question
As part of the foraging behavior assessment described in the previous problem, investigators also measured the bill depths of the male and female Downy Woodpeckers.Summary statistics for these measures are given in the table below: 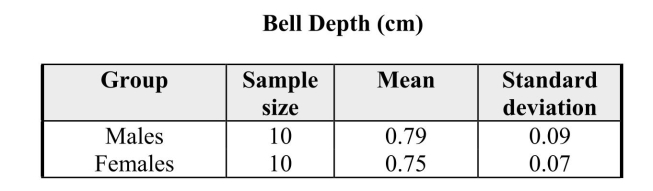 An initial analysis of the data revealed that it was reasonable to assume the bill depths for both sexes are approximately normal. a)Construct a 95% confidence interval for the difference in bill depths of the males and females. b)Do the data indicate that the bill depths differ? Justify your answer statistically.
An initial analysis of the data revealed that it was reasonable to assume the bill depths for both sexes are approximately normal. a)Construct a 95% confidence interval for the difference in bill depths of the males and females. b)Do the data indicate that the bill depths differ? Justify your answer statistically. Question
Question
Question
Question
Researchers have hypothesized that female Downy Woodpeckers 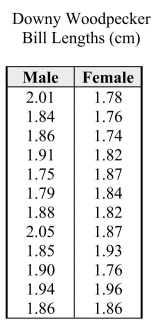 food per tree. The data in the table at right are the bill lengths of 12 male and 12 female randomly selected Downy Woodpeckers caught and released in a banding survey.The investigators would like to know whether these data provide evidence that the males and females differ in bill size. a)Using a graphical display of your choosing, assess the plausibility of the assumption that the distributions of bill lengths are approximately normal.State your conclusion in a few sentences. b)Assuming that it is OK to proceed with a two-sample t procedure, determine if there is sufficient evidence to conclude that there is a difference in mean bill length for males and females. c)In a few sentences, state any concerns you have about your conclusions in part (b), based on your results from part (a).If you have no concerns, write "No concerns."
food per tree. The data in the table at right are the bill lengths of 12 male and 12 female randomly selected Downy Woodpeckers caught and released in a banding survey.The investigators would like to know whether these data provide evidence that the males and females differ in bill size. a)Using a graphical display of your choosing, assess the plausibility of the assumption that the distributions of bill lengths are approximately normal.State your conclusion in a few sentences. b)Assuming that it is OK to proceed with a two-sample t procedure, determine if there is sufficient evidence to conclude that there is a difference in mean bill length for males and females. c)In a few sentences, state any concerns you have about your conclusions in part (b), based on your results from part (a).If you have no concerns, write "No concerns." Question

Question
Question
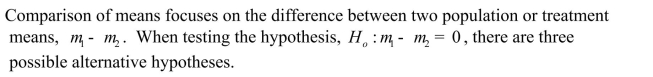 a)Using correct statistical notation, list these three alternative hypotheses. b)For each alternative hypothesis in part (a), give an example of a situation from your own experience or your reading where one might use that alternative hypothesis.Be sure to clearly specify a context, define your variables, and state the null and alternative hypothesis.
 Question
Question
Question

Question
Question
Question
Question
Question

Unlock Deck
Sign up to unlock the cards in this deck!
Unlock Deck
Unlock Deck
1/16
Play
Full screen (f)
Deck 11: Comparing Two Populations or Treatments
1
As part of the foraging behavior assessment described in the previous problem, investigators also measured the bill depths of the male and female Downy Woodpeckers.Summary statistics for these measures are given in the table below: An initial analysis of the data revealed that it was reasonable to assume the bill depths for both sexes are approximately normal. a)Construct a 95% confidence interval for the difference in bill depths of the males and females. b)Do the data indicate that the bill depths differ? Justify your answer statistically.
An initial analysis of the data revealed that it was reasonable to assume the bill depths for both sexes are approximately normal. a)Construct a 95% confidence interval for the difference in bill depths of the males and females. b)Do the data indicate that the bill depths differ? Justify your answer statistically.a) 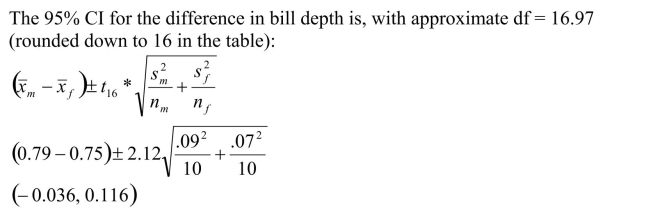 b)There is not enough evidence to say that the bill depths differ between male and
females, since the value 0 is in the interval.This indicates that it is plausible to
believe that the mean difference in bill depths is zero.
b)There is not enough evidence to say that the bill depths differ between male andfemales, since the value 0 is in the interval.This indicates that it is plausible to
believe that the mean difference in bill depths is zero.
2
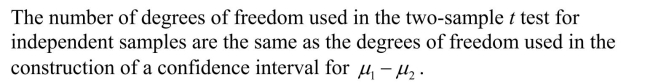
The number of degrees of freedom of the two-sample t test are the same as the degrees of freedom for the paired t test statistic.
False
3
False
4
Unlock Deck
Unlock for access to all 16 flashcards in this deck.
Unlock Deck
k this deck
5
Researchers have hypothesized that female Downy Woodpeckers food per tree. The data in the table at right are the bill lengths of 12 male and 12 female randomly selected Downy Woodpeckers caught and released in a banding survey.The investigators would like to know whether these data provide evidence that the males and females differ in bill size. a)Using a graphical display of your choosing, assess the plausibility of the assumption that the distributions of bill lengths are approximately normal.State your conclusion in a few sentences. b)Assuming that it is OK to proceed with a two-sample t procedure, determine if there is sufficient evidence to conclude that there is a difference in mean bill length for males and females. c)In a few sentences, state any concerns you have about your conclusions in part (b), based on your results from part (a).If you have no concerns, write "No concerns."
food per tree. The data in the table at right are the bill lengths of 12 male and 12 female randomly selected Downy Woodpeckers caught and released in a banding survey.The investigators would like to know whether these data provide evidence that the males and females differ in bill size. a)Using a graphical display of your choosing, assess the plausibility of the assumption that the distributions of bill lengths are approximately normal.State your conclusion in a few sentences. b)Assuming that it is OK to proceed with a two-sample t procedure, determine if there is sufficient evidence to conclude that there is a difference in mean bill length for males and females. c)In a few sentences, state any concerns you have about your conclusions in part (b), based on your results from part (a).If you have no concerns, write "No concerns." Unlock Deck
Unlock for access to all 16 flashcards in this deck.
Unlock Deck
k this deck
6
Unlock Deck
Unlock for access to all 16 flashcards in this deck.
Unlock Deck
k this deck
7
Unlock Deck
Unlock for access to all 16 flashcards in this deck.
Unlock Deck
k this deck
8
a)Using correct statistical notation, list these three alternative hypotheses. b)For each alternative hypothesis in part (a), give an example of a situation from your own experience or your reading where one might use that alternative hypothesis.Be sure to clearly specify a context, define your variables, and state the null and alternative hypothesis. Unlock Deck
Unlock for access to all 16 flashcards in this deck.
Unlock Deck
k this deck
9
Unlock Deck
Unlock for access to all 16 flashcards in this deck.
Unlock Deck
k this deck
10
Unlock Deck
Unlock for access to all 16 flashcards in this deck.
Unlock Deck
k this deck
11
Unlock Deck
Unlock for access to all 16 flashcards in this deck.
Unlock Deck
k this deck
12
Two samples are said to be independent when the selection of the individuals in one sample has no bearing on the selection of those in the other sample.
Unlock Deck
Unlock for access to all 16 flashcards in this deck.
Unlock Deck
k this deck
13
Unlock Deck
Unlock for access to all 16 flashcards in this deck.
Unlock Deck
k this deck
14
The P-value of an upper-tail t test is the area to the right of the calculated t value on the appropriate t curve.
Unlock Deck
Unlock for access to all 16 flashcards in this deck.
Unlock Deck
k this deck
15
Unlock Deck
Unlock for access to all 16 flashcards in this deck.
Unlock Deck
k this deck
16
When comparing two population means, it is important to make the distinction between independent samples and paired samples.What makes two samples independent? avoid the feeding areas of socially dominant males; that is, the males chase them away from prime spots.An alternative opinion is that there are important physical characteristics of males and females that might lead them to choose different foraging locations.One such characteristic could be the bill length of the males and females; it may be that longer bills let one gender or the other drill deeper into a tree and thus get more
Unlock Deck
Unlock for access to all 16 flashcards in this deck.
Unlock Deck
k this deck
Unlock Deck
Unlock for access to all 16 flashcards in this deck.


