Deck 12: Life Histories
Full screen (f)
Question
Question
Question
Question
Question
Question
Question
Question
Where would you place the following plant species, in Grime's and in Winemiller and Rose's classifications of life histories (see figs. 12.20 and 12.21) The plant species lives in an environment where it has access to plenty of water and nutrients but is subject to disturbance by flooding and wind. An average individual produces several million seeds per year and may live several centuries. However, ideal conditions for reproduction by the species occurs only once or twice per decade.
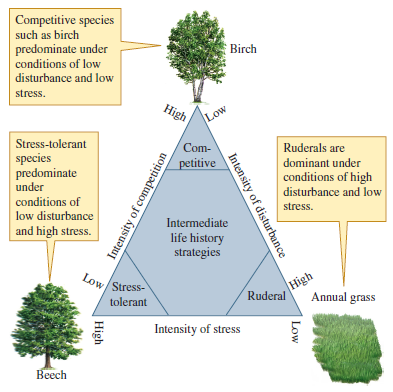
Figure 12.20 Grime's classification of plant life history strategies (after Grime 1979).
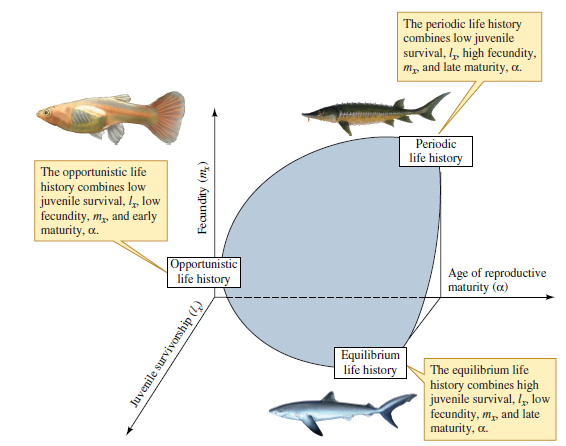
Figure 12.21 Classification of life histories based on juvenile survival, l x , fecundity, m x , and age at reproductive maturity, (after Winemiller and Rose 1992).
Figure 12.20 Grime's classification of plant life history strategies (after Grime 1979).
Figure 12.21 Classification of life histories based on juvenile survival, l x , fecundity, m x , and age at reproductive maturity, (after Winemiller and Rose 1992).
Question
Question
Question
Question
Question
Question
Using what you know about the trade-off between seed number and seed size (e.g., fig. 12.7) and patterns of variation among plants, predict the relative number of seeds produced by the various plant growth forms and dispersal strategies listed on figure 12.8
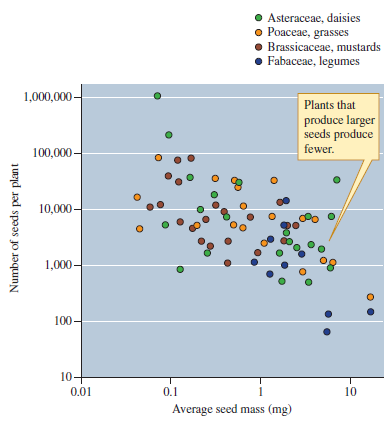
Figure 12.7 Relationship between seed mass and seed number (data from Stevens 1932).
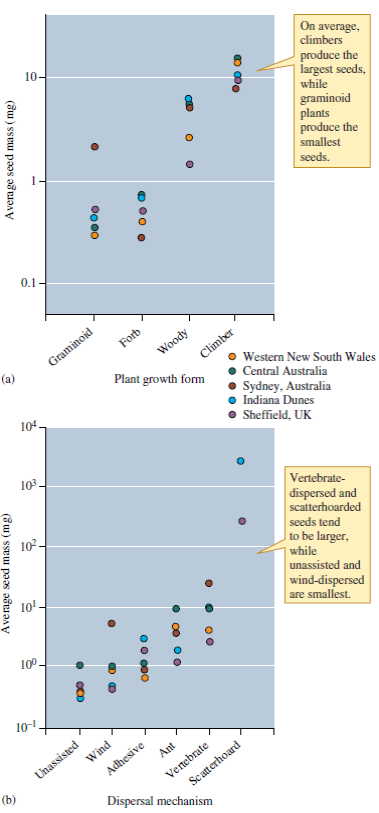
Figure 12.8 Plant growth form and dispersal mechanism and seed mass (data from Westoby, Leishman, and Lord 1996).
Figure 12.7 Relationship between seed mass and seed number (data from Stevens 1932).
Figure 12.8 Plant growth form and dispersal mechanism and seed mass (data from Westoby, Leishman, and Lord 1996).
Question
Apply Winemiller's model to plants. If you were to construct a strictly quantitative classification of plant life histories using Winemiller and Rose's approach, what information would you need about the plants included in your analysis How many plant species would you need to have an idea of how variation in their life histories compares with those of animals (e.g., as in fig. 12.22) Try to reconcile Grime's plant classification with the scheme offered by Winemiller and Rose. Where are they similar How are they different

Figure 12.22 Variation in life histories within vertebrate animals (after Winemiller and Rose 1992).
Figure 12.22 Variation in life histories within vertebrate animals (after Winemiller and Rose 1992).
Question
Question
Question
Question
Large darter species produce larger numbers of smaller eggs compared to smaller darter species (see figs. 12.3 12.4). Consequently, would you expect to find more genetic differences along the length of a river system among small darters or large darters (Hint: Consider fig. 12.5.)
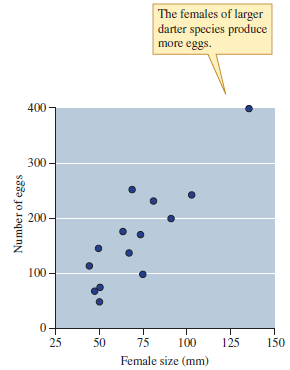
Figure 12.3 Relationship between female darter size and number of eggs. Each point represents a different darter species (data from Turner and Trexler 1998).
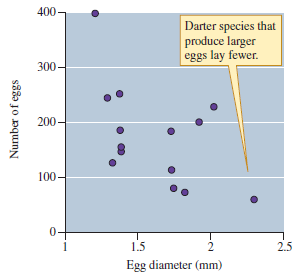
Figure 12.4 Relationship between the size of eggs laid by several darter species and the number of eggs laid (data from Turner and Trexler 1998).
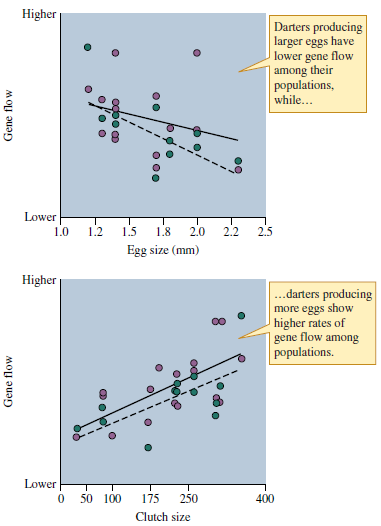
Figure 12.5 Egg size, egg number, and gene flow among darter populations (data from Turner and Trexler 1998).
Figure 12.3 Relationship between female darter size and number of eggs. Each point represents a different darter species (data from Turner and Trexler 1998).
Figure 12.4 Relationship between the size of eggs laid by several darter species and the number of eggs laid (data from Turner and Trexler 1998).
Figure 12.5 Egg size, egg number, and gene flow among darter populations (data from Turner and Trexler 1998).
Question

Unlock Deck
Sign up to unlock the cards in this deck!
Unlock Deck
Unlock Deck
1/20
Play
Full screen (f)
Deck 12: Life Histories
1
Do the results of the chi-square test for species B show beyond a doubt that its population has a regular distribution
The sample variance/sample mean ratio for a species is used to determine its pattern of distribution.
The sample variance/sample mean ratio is equal to 1 in a randomly distributed population. The ratio is less thaN₁, in case of regularly distributed population and greater thaN₁, in case of clumped distribution.
The pattern of distribution of a species can be statiscally confirmed by the chi-square test.
Chi-square test can be used to find out whether the sample variance/sample mean ratio for each species significantly differs from 1.
The values of chi-square can be determined for each species included in the study from the sample variance, sample mean and the degrees of freedom.
To determine whether the sample variance/sample mean ratio is significantly less or significantly greater thaN₁, the calculated chi square values are compared to two critical values namely upper critical value and lower critical value.
Only one critical value has been defined for species B. Though the calculated value of chi-square for species B is below the upper critical value, the lower critical value is not defined.
Hence, the results of chi-square test for species B are doubtful to confirm the regular distribution of the species.
2
What is a main difference between the study by Bertschy and Fox (1999) and that ofGunderson (1997)
Donald Gunderson studied the relationship between the adult survival and the reproductive effort in different fish species. He correlated the mortality rate, body size, and reproductive maturity age to the reproductive effort in different fish species.
Kirk Bertschy and Michael fox studied the relation between the adult survival and the reproductive effort in populations of a single species, pumpkinseed sunfish from different geographical locations.
They correlated adult is to juvenile survival ratios with the reproductive effort.
There is a difference between the study of Bertschy and Fox and that of Gunderson.
Gunderson studied the variation in the reproductive effort between the species and his analysis was on variations in life history among the species.
Kirk Bertschy and Michael fox studied the variation in reproductive effort within the species and their analysis was on the life history variations within the species.
3
The discussion of seed size and number focused mainly on the advantages associated with large seeds. However, research by Westoby, Leishman, and Lord has revealed that the plants from widely separated geographic regions produce a wide variety of seed sizes. If this variation is to be maintained, what are some of the advantages associated with producing small seeds
The species of plants differ with respect to the seed size and the number of seeds. The variation in seed size was found at all geographical locations.
The advantages and disadvantages of seed size were responsible for maintenance of variation.
Small seeds have been found to have following advantages:
• A plant producing small seeds can invest in large number of seeds. This increases the chances of survival of the plant. Small seeds have been found to be vulnerable to stress. Hence, the large number ensures at least few survivors in the disturbed environments.
• Under favorable conditions small seeds can establish themselves large numbers in new areas.
• Small seeds can easily disperse without any assistance or through wind. This helps in dispersal of species over long distances and increases the geographic range.
4
Why did Bertschy and Fox restrict their study to lakes without major inflows or outflows
Unlock Deck
Unlock for access to all 20 flashcards in this deck.
Unlock Deck
k this deck
5
How could we improve our confidence in the conclusion that species B has a regular distribution
Unlock Deck
Unlock for access to all 20 flashcards in this deck.
Unlock Deck
k this deck
6
If a concept, such as r and K selection, does not fully represent the richness of life history variation among species, can it still be valuable to science
Unlock Deck
Unlock for access to all 20 flashcards in this deck.
Unlock Deck
k this deck
7
Under what conditions should natural selection favor production of many small offspring versus the production of a few well provisioned offspring
Unlock Deck
Unlock for access to all 20 flashcards in this deck.
Unlock Deck
k this deck
8
Where would you place the following plant species, in Grime's and in Winemiller and Rose's classifications of life histories (see figs. 12.20 and 12.21) The plant species lives in an environment where it has access to plenty of water and nutrients but is subject to disturbance by flooding and wind. An average individual produces several million seeds per year and may live several centuries. However, ideal conditions for reproduction by the species occurs only once or twice per decade.
Figure 12.20 Grime's classification of plant life history strategies (after Grime 1979).
Figure 12.21 Classification of life histories based on juvenile survival, l x , fecundity, m x , and age at reproductive maturity, (after Winemiller and Rose 1992).
Figure 12.20 Grime's classification of plant life history strategies (after Grime 1979).
Figure 12.21 Classification of life histories based on juvenile survival, l x , fecundity, m x , and age at reproductive maturity, (after Winemiller and Rose 1992).
Unlock Deck
Unlock for access to all 20 flashcards in this deck.
Unlock Deck
k this deck
9
Plant ecologists using experimental studies have verified that seedlings growing from larger seeds have a better chance of surviving environmental challenges such as deep shade, drought, physical injury, and competition from other plants. Explain how growing from larger seeds could give an advantage to seedlings facing strong environmental challenge to their establishing.
Unlock Deck
Unlock for access to all 20 flashcards in this deck.
Unlock Deck
k this deck
10
The studies by Shine and Charnov (1992) and Gunderson (1997) addressed important questions of concern to life history ecologists and their work provided robust answers to those questions. However, the methods they employed differed substantially from those used in most of the studies discussed in this and other chapters. The chief difference is that both relied heavily on data on life histories published previously by other authors. What was it about the nature of the problems addressed by these authors that constrained them to use this approach In what types of studies would it be most appropriate to perform a synthesis of previously published information
Unlock Deck
Unlock for access to all 20 flashcards in this deck.
Unlock Deck
k this deck
11
Much of our discussion of life history variation involved variation among species within groups as broadly defined as "fish," "plants," or "reptiles." However, the work of Bertschy and Fox revealed significant variation in life history within species. In general, what should be the relative amount of variation within a species compared to that among many species Develop your discussion using relative amounts of genetic variation upon which natural selection might act. You might review the sections discussing the evolutionary significance of genetic variation in chapter 4.
Unlock Deck
Unlock for access to all 20 flashcards in this deck.
Unlock Deck
k this deck
12
Grime's proposed classification of environments based on intensity of disturbance and stress resulted in four environments, three of which he proposed were inhabitable by plants and one of which was not. That fourth environment shows high intensity of disturbance and high stress. What sorts of life histories would an organism have to possess to live in such an environment What kinds of real organisms can you think of that could live and perhaps thrive in such an environment
Unlock Deck
Unlock for access to all 20 flashcards in this deck.
Unlock Deck
k this deck
13
Once established, Rio Grande cottonwoods can live to be well over 100 years old. However, they experience very high rates of mortality as seeds, which only germinate in conditions that occur very unpredictably in time and space. Female cottonwood trees produce about 25 million seeds annually and could produce up to 2.5 billion seeds during a lifetime. Which of the life history categories that we've discussed most closely match the life history of the Rio Grande cottonwood
Unlock Deck
Unlock for access to all 20 flashcards in this deck.
Unlock Deck
k this deck
14
Using what you know about the trade-off between seed number and seed size (e.g., fig. 12.7) and patterns of variation among plants, predict the relative number of seeds produced by the various plant growth forms and dispersal strategies listed on figure 12.8
Figure 12.7 Relationship between seed mass and seed number (data from Stevens 1932).
Figure 12.8 Plant growth form and dispersal mechanism and seed mass (data from Westoby, Leishman, and Lord 1996).
Figure 12.7 Relationship between seed mass and seed number (data from Stevens 1932).
Figure 12.8 Plant growth form and dispersal mechanism and seed mass (data from Westoby, Leishman, and Lord 1996).
Unlock Deck
Unlock for access to all 20 flashcards in this deck.
Unlock Deck
k this deck
15
Apply Winemiller's model to plants. If you were to construct a strictly quantitative classification of plant life histories using Winemiller and Rose's approach, what information would you need about the plants included in your analysis How many plant species would you need to have an idea of how variation in their life histories compares with those of animals (e.g., as in fig. 12.22) Try to reconcile Grime's plant classification with the scheme offered by Winemiller and Rose. Where are they similar How are they different
Figure 12.22 Variation in life histories within vertebrate animals (after Winemiller and Rose 1992).
Figure 12.22 Variation in life histories within vertebrate animals (after Winemiller and Rose 1992).
Unlock Deck
Unlock for access to all 20 flashcards in this deck.
Unlock Deck
k this deck
16
Suppose you are a river manager and you need to operate the dams on your river in a way that fosters riparian tree growth. However, assume that the dominant trees along the river that you manage are not cottonwoods. In order to apply Mahoney and Rood's recruitment box model, what information do you need to know about your river and the riparian tree species you intend to manage How would you go about gathering this information
Unlock Deck
Unlock for access to all 20 flashcards in this deck.
Unlock Deck
k this deck
17
Why did Westoby, Leishman, and Lord (1996) include five floras on three continents in their study
Unlock Deck
Unlock for access to all 20 flashcards in this deck.
Unlock Deck
k this deck
18
Why did Jacobsson and Eriksson (2000) conduct their study of the relationship between seed size and seedling size in a greenhouse
Unlock Deck
Unlock for access to all 20 flashcards in this deck.
Unlock Deck
k this deck
19
Large darter species produce larger numbers of smaller eggs compared to smaller darter species (see figs. 12.3 12.4). Consequently, would you expect to find more genetic differences along the length of a river system among small darters or large darters (Hint: Consider fig. 12.5.)
Figure 12.3 Relationship between female darter size and number of eggs. Each point represents a different darter species (data from Turner and Trexler 1998).
Figure 12.4 Relationship between the size of eggs laid by several darter species and the number of eggs laid (data from Turner and Trexler 1998).
Figure 12.5 Egg size, egg number, and gene flow among darter populations (data from Turner and Trexler 1998).
Unlock Deck
Unlock for access to all 20 flashcards in this deck.
Unlock Deck
k this deck
20
What do the GSI values for rougheye rockfish, 0.02, and northern anchovy, 0.65, mean in terms of the body weights of these two fish species
Unlock Deck
Unlock for access to all 20 flashcards in this deck.
Unlock Deck
k this deck
Unlock Deck
Unlock for access to all 20 flashcards in this deck.


