Deck 9: Population Distribution and Abundance
Full screen (f)
Question
According to the results of Phillips and MacMahon, what is the approximate value of the ratio of variance in shrub density to mean shrub density (variance/mean) for young, medium-age, and older creosote bushes (see fig. 9.13)
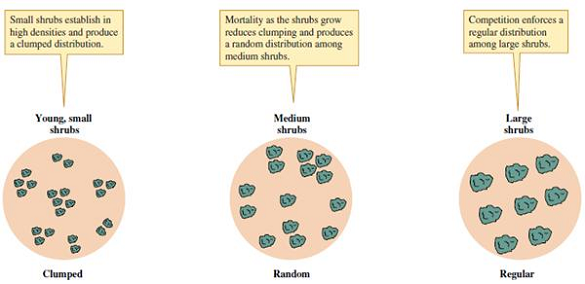
Figure 9.13 Change in creosote bush distributions with increasing shrub size.
Figure 9.13 Change in creosote bush distributions with increasing shrub size.
Question
Question
Question
What does the position of pines along moisture gradients in both the Santa Catalina Mountains of Arizona (see fig. 9.17) and the Great Smoky Mountains of Tennessee (see fig. 9.18) suggest about pine water relations
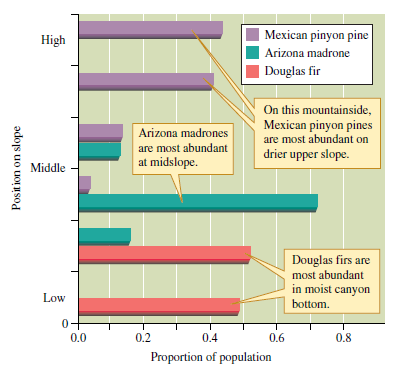
Figure 9.17 Abundances of three tree species on a moisture gradient in the Santa Catalina Mountains, Arizona (data from Whittaker and Niering 1965).
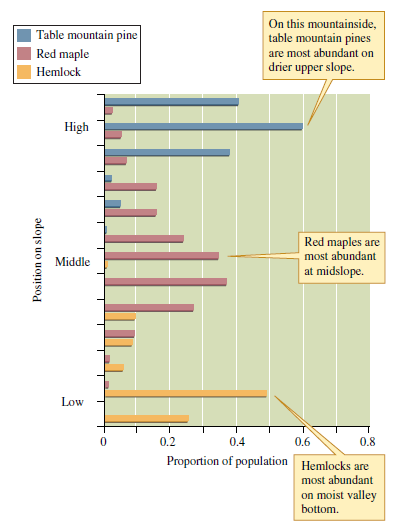
Figure 9.18 Abundance of three tree species on a moisture gradient in the Great Smoky Mountains, Tennessee (data from Whittaker 1956).
Figure 9.17 Abundances of three tree species on a moisture gradient in the Santa Catalina Mountains, Arizona (data from Whittaker and Niering 1965).
Figure 9.18 Abundance of three tree species on a moisture gradient in the Great Smoky Mountains, Tennessee (data from Whittaker 1956).
Question
Question
What are some advantages of Damuth's strict focus on herbivorous mammals in his analysis of the relationship between body size and population density (see fig. 9.19)

Figure 9.19 Body size and population density of herbivorous mammals (data from Damuth 1981).
Figure 9.19 Body size and population density of herbivorous mammals (data from Damuth 1981).
Question
Question
How might energy and nutrient relations explain the lower population densities of birds compared to comparable-sized mammals (see fig. 9.20)
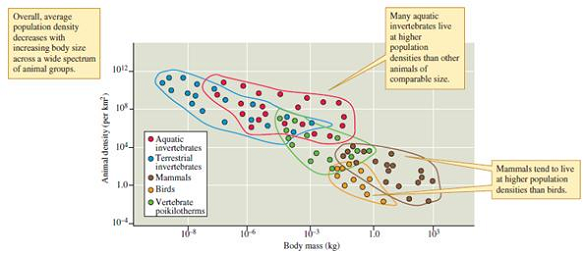
Figure 9.20 Animal size and population density (data from Peters and Wassenberg 1983).
Figure 9.20 Animal size and population density (data from Peters and Wassenberg 1983).
Question
Question
Question
Suppose that in the near future, the fish crow population in North America declines because of habitat destruction. Now that you have reviewed the large-scale distribution and abundance of the fish crow (see fig. 9.15 b ), devise a conservation plan for the species that includes establishing protected refuges for the species. Where would you locate the refuges How many refuges would you recommend
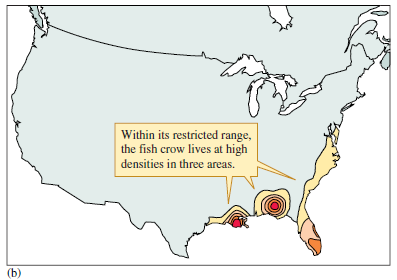
Figure 9.15 ( a ) Winter distribution of the American crow, Corvus brachyrynchos. ( b ) Winter distribution of the fish crow, C. ossifragus (data from Root 1988).
Figure 9.15 ( a ) Winter distribution of the American crow, Corvus brachyrynchos. ( b ) Winter distribution of the fish crow, C. ossifragus (data from Root 1988).
Question
Use the empirical relationship between size and population density observed in the studies by Damuth (1981) (see fig. 9.19) and Peters and Wassenberg (1983) (see fig. 9.20) to answer the following: For a given body size, which generally has the higher population density, birds or mammals On average, which lives at lower population densities, terrestrial or aquatic invertebrates Does an herbivorous mammal twice the size of another have on average one-half the population density of the smaller species Less than half More than half
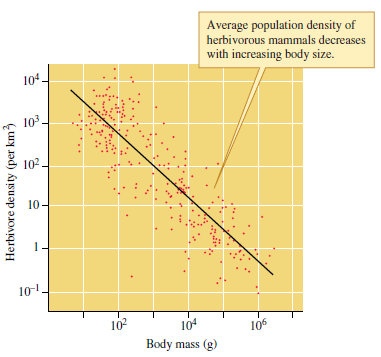
Figure 9.19 Body size and population density of herbivorous mammals (data from Damuth 1981).
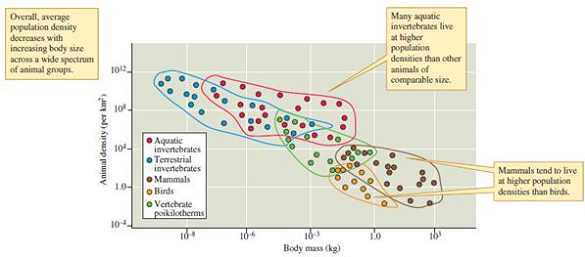
Figure 9.20 Animal size and population density (data from Peters and Wassenberg 1983).
Figure 9.19 Body size and population density of herbivorous mammals (data from Damuth 1981).
Figure 9.20 Animal size and population density (data from Peters and Wassenberg 1983).
Question
Question
Question
Question
Question
Question
How could you test the hypothesis that low overlap in root systems in creosote bush populations (see fig. 9.14) is the result of ongoing competition
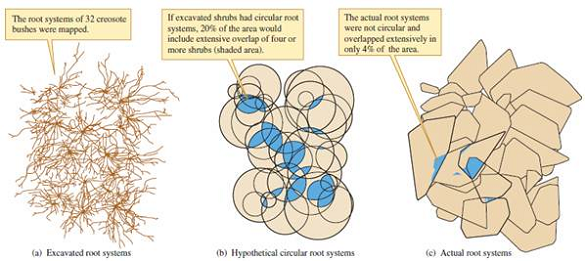
Figure 9.14 Creosote bush root distributions: hypothetical versus actual root overlap (data from Brisson and Reynolds 1994).
Figure 9.14 Creosote bush root distributions: hypothetical versus actual root overlap (data from Brisson and Reynolds 1994).
Question
Question
What factors might be responsible for the aggregation of American crows in winter (see fig. 9.15)
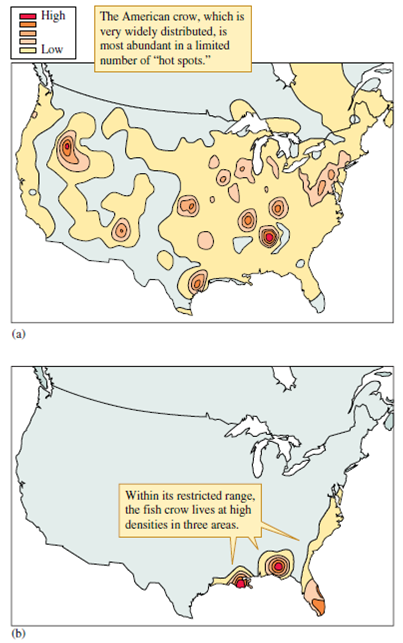
Figure 9.15 ( a ) Winter distribution of the American crow, Corvus brachyrynchos. ( b ) Winter distribution of the fish crow, C. ossifragus (data from Root 1988).
Figure 9.15 ( a ) Winter distribution of the American crow, Corvus brachyrynchos. ( b ) Winter distribution of the fish crow, C. ossifragus (data from Root 1988).

Unlock Deck
Sign up to unlock the cards in this deck!
Unlock Deck
Unlock Deck
1/20
Play
Full screen (f)
Deck 9: Population Distribution and Abundance
1
According to the results of Phillips and MacMahon, what is the approximate value of the ratio of variance in shrub density to mean shrub density (variance/mean) for young, medium-age, and older creosote bushes (see fig. 9.13)
Figure 9.13 Change in creosote bush distributions with increasing shrub size.
Figure 9.13 Change in creosote bush distributions with increasing shrub size.
The distribution of species in a population can be clumped, regular, or random in nature. These patterns of distribution can also be found out by statistical analysis of the data on the density of individual species in the population. The sample mean density and the sample variance in the density of the species; used to determine the pattern of distribution of the species.
The relationship between the type of distribution of the species, mean, and variance in the density in the sample population of the species is as follows:
• In clumped distribution, the sample variance in density is greater than the sample mean density, and hence the ratio of variance to the mean is greater thaN₁.
• In regular distribution, the sample variance in density is less than the sample mean density. Hence, the ratio of variance to the mean is less thaN₁.
• In random distribution, the sample variance in density is approximately equal to the sample mean density. Hence, the ratio of variance to the mean is approximately equal to 1.
In creosote bushes studied by the scientists, the approximate value of the ratio of variance in the shrub density to the mean shrub density is as follows:
• Young creosote bushes: They were found to show clumped distribution. Hence, the approximate value of the ratio of variance in the density of young creosote bush to their mean density is greater thaN₁.
• Medium-age creosote bushes : They were found to show random distribution. Hence, the approximate value of the ratio of variance in the density of young creosote bush to their mean density is approximately equal to 1.
• Older creosote bushes: They were found to show regular distribution. Hence the approximate value of the ratio of variance in the density of young creosote bush to their mean density is approximately less thaN₁.
2
Why might the winter aggregations of crows occur mainly along river valleys
The abundance and distribution pattern of birds is governed by the environment and their social interactions. The birds are found abundantly in favorable environments, and have usually been shown to have clumped distribution. The winter aggregation of some species of crows has been shown to occur along the river valleys. In winter, the availability of food is less, as the ground may be covered with snow and many insect species that are preyed upon by crows become dormant.
Crows tend to aggregate at the sites providing food. One such site is the river valleys. Crows can survive on the fish and invertebrates in the river. Nesting sites are also available for crows in the river valleys. Crows also roost together in winter.
Hence, in winter, crows aggregate along the river valleys.
3
What confines Enceliafarinosa to upland slopes in the Mojave Desert Why is it uncommon along desert washes, where it would have access to much more water What may allow E. frutescens to persist along desert washes while E.farinosa cannot
The environment controls the geographical distribution of the species. The organisms living in a particular environment are adapted to the physical, chemical and biological facets of the environment. Encelia farinosa grows on the slopes in deserts such as the Mojave. The climate is hot and dry, and the soil has limited water supply. The plant shows pubescent leaves that are highly reflective and reduce heat gained by radiation. Hence, the plant body temperature is maintained low. Since the availability of water is limited in the shallow soil on the slope, the plants cannot afford to show a high rate of transpiration. The plant shows comparatively shallow roots that are useful to obtain water from the shallow soil on the slope.
Encelia farinosa has been shown to be susceptible to flash floods. Hence, it remains confined to slopes.
The plant shows low water loss and, hence, low water requirements that help it to survive on the slopes with a low water supply.
Encelia frutescens persist along the desert washes.
They have leaves that are almost free of pubescence. They absorb large amounts of radiant energy compared to Encelia farinosa.
To prevent overheating, the plant shows a high rate of transpiration and cools itself by evaporative cooling. The lost water can be obtained by obtaining moisture from deep soils by its extensive root system. Near the washes, runoffs can infiltrate the soil and increase the amount of water available to Encelia frutescens.
Thus, the two species occupy different microclimates in the same macroclimate. This geographical separation prevents competition for common resources and allows the survival of each species in its ecological niche.
4
What does the position of pines along moisture gradients in both the Santa Catalina Mountains of Arizona (see fig. 9.17) and the Great Smoky Mountains of Tennessee (see fig. 9.18) suggest about pine water relations
Figure 9.17 Abundances of three tree species on a moisture gradient in the Santa Catalina Mountains, Arizona (data from Whittaker and Niering 1965).
Figure 9.18 Abundance of three tree species on a moisture gradient in the Great Smoky Mountains, Tennessee (data from Whittaker 1956).
Figure 9.17 Abundances of three tree species on a moisture gradient in the Santa Catalina Mountains, Arizona (data from Whittaker and Niering 1965).
Figure 9.18 Abundance of three tree species on a moisture gradient in the Great Smoky Mountains, Tennessee (data from Whittaker 1956).
Unlock Deck
Unlock for access to all 20 flashcards in this deck.
Unlock Deck
k this deck
5
Spruce trees, members of the genus Picea, occur throughout the boreal forest and on mountains farther south. For example, spruce grow in the Rocky Mountains south from the heart of boreal forest all the way to the deserts of the southern United States and Mexico. How do you think they would be distributed in the mountains that rise from the southern deserts In particular, how do altitude and aspect (see chapter 5) affect their distributions in the southern part of their range Would spruce populations be broken up into small local populations in the southern or the northern part of the range Why
Unlock Deck
Unlock for access to all 20 flashcards in this deck.
Unlock Deck
k this deck
6
What are some advantages of Damuth's strict focus on herbivorous mammals in his analysis of the relationship between body size and population density (see fig. 9.19)
Figure 9.19 Body size and population density of herbivorous mammals (data from Damuth 1981).
Figure 9.19 Body size and population density of herbivorous mammals (data from Damuth 1981).
Unlock Deck
Unlock for access to all 20 flashcards in this deck.
Unlock Deck
k this deck
7
What kinds of interactions within an animal population lead to clumped distributions What kinds of interactions foster a regular distribution What kinds of interactions would you expect to find within an animal population distributed in a random pattern
Unlock Deck
Unlock for access to all 20 flashcards in this deck.
Unlock Deck
k this deck
8
How might energy and nutrient relations explain the lower population densities of birds compared to comparable-sized mammals (see fig. 9.20)
Figure 9.20 Animal size and population density (data from Peters and Wassenberg 1983).
Figure 9.20 Animal size and population density (data from Peters and Wassenberg 1983).
Unlock Deck
Unlock for access to all 20 flashcards in this deck.
Unlock Deck
k this deck
9
How might the structure of the environment, for example, the distributions of different soil types and soil moisture, affect the patterns of distribution in plant populations How should interactions among plants affect their distributions
Unlock Deck
Unlock for access to all 20 flashcards in this deck.
Unlock Deck
k this deck
10
Suppose one plant reproduces almost entirely from seeds, and that its seeds are dispersed by wind, and a second plant reproduces asexually, mainly by budding from runners. How should these two different reproductive modes affect local patterns of distribution seen in populations of the two species
Unlock Deck
Unlock for access to all 20 flashcards in this deck.
Unlock Deck
k this deck
11
Suppose that in the near future, the fish crow population in North America declines because of habitat destruction. Now that you have reviewed the large-scale distribution and abundance of the fish crow (see fig. 9.15 b ), devise a conservation plan for the species that includes establishing protected refuges for the species. Where would you locate the refuges How many refuges would you recommend
Figure 9.15 ( a ) Winter distribution of the American crow, Corvus brachyrynchos. ( b ) Winter distribution of the fish crow, C. ossifragus (data from Root 1988).
Figure 9.15 ( a ) Winter distribution of the American crow, Corvus brachyrynchos. ( b ) Winter distribution of the fish crow, C. ossifragus (data from Root 1988).
Unlock Deck
Unlock for access to all 20 flashcards in this deck.
Unlock Deck
k this deck
12
Use the empirical relationship between size and population density observed in the studies by Damuth (1981) (see fig. 9.19) and Peters and Wassenberg (1983) (see fig. 9.20) to answer the following: For a given body size, which generally has the higher population density, birds or mammals On average, which lives at lower population densities, terrestrial or aquatic invertebrates Does an herbivorous mammal twice the size of another have on average one-half the population density of the smaller species Less than half More than half
Figure 9.19 Body size and population density of herbivorous mammals (data from Damuth 1981).
Figure 9.20 Animal size and population density (data from Peters and Wassenberg 1983).
Figure 9.19 Body size and population density of herbivorous mammals (data from Damuth 1981).
Figure 9.20 Animal size and population density (data from Peters and Wassenberg 1983).
Unlock Deck
Unlock for access to all 20 flashcards in this deck.
Unlock Deck
k this deck
13
Outline Rabinowitz's classification (1981) of rarity, which she based on size of geographic range, breadth of habitat tolerance, and population size. In her scheme, which combination of attributes makes a species least vulnerable to extinction Which combination makes a species the most vulnerable
Unlock Deck
Unlock for access to all 20 flashcards in this deck.
Unlock Deck
k this deck
14
Can the analyses by Damuth (1981) and by Peters and Wassenberg (1983) be combined with that of Rabinowitz (1981) to make predictions about the relationship of animal size to its relative rarity What two attributes of rarity, as defined by Rabinowitz, are not included in the analyses by Damuth and by Peters and Wassenberg
Unlock Deck
Unlock for access to all 20 flashcards in this deck.
Unlock Deck
k this deck
15
How may a species respond to climate change
Unlock Deck
Unlock for access to all 20 flashcards in this deck.
Unlock Deck
k this deck
16
How might biological and physical aspects of the environment interact to influence a species' geographic distribution
Unlock Deck
Unlock for access to all 20 flashcards in this deck.
Unlock Deck
k this deck
17
Are the concepts of "small" versus "large" scale the same for all organisms
Unlock Deck
Unlock for access to all 20 flashcards in this deck.
Unlock Deck
k this deck
18
How could you test the hypothesis that low overlap in root systems in creosote bush populations (see fig. 9.14) is the result of ongoing competition
Figure 9.14 Creosote bush root distributions: hypothetical versus actual root overlap (data from Brisson and Reynolds 1994).
Figure 9.14 Creosote bush root distributions: hypothetical versus actual root overlap (data from Brisson and Reynolds 1994).
Unlock Deck
Unlock for access to all 20 flashcards in this deck.
Unlock Deck
k this deck
19
In the study of the distribution of stingless bee colonies (see p. 209), why were measurements of the number and distribution of potential nest trees necessary
Unlock Deck
Unlock for access to all 20 flashcards in this deck.
Unlock Deck
k this deck
20
What factors might be responsible for the aggregation of American crows in winter (see fig. 9.15)
Figure 9.15 ( a ) Winter distribution of the American crow, Corvus brachyrynchos. ( b ) Winter distribution of the fish crow, C. ossifragus (data from Root 1988).
Figure 9.15 ( a ) Winter distribution of the American crow, Corvus brachyrynchos. ( b ) Winter distribution of the fish crow, C. ossifragus (data from Root 1988).
Unlock Deck
Unlock for access to all 20 flashcards in this deck.
Unlock Deck
k this deck
Unlock Deck
Unlock for access to all 20 flashcards in this deck.


