Deck 5: Decision Support Tools
Full screen (f)
Question
Question
Question
Question
Question
Question
Question
Question
Question
Question
Question
Question
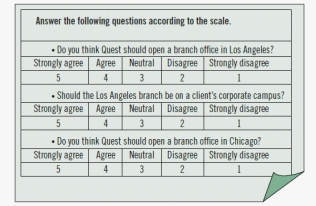
The diagram shown above shows a survey that uses a five-point scale.However, a three-point or four-point scale is equally effective.
Question
Question
Question
Question
Question
Question
The survey shown above takes subjective data and turns it into a quantitative model by converting the information into numbers.
Question
Question
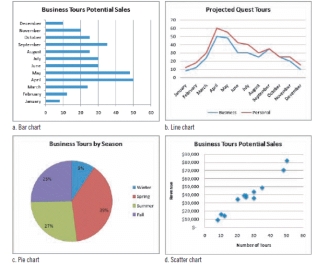
Referring to the bar chart in the figure above, a bar chart uses rectangular bars to display data values.The statement below that is true is: ____.
A) A longer bar means a greater value
B) A smaller bar means a greater value
C) The size of the bar does not correspond to the value
D) None of the above
Question
Question
Question
Question
Question
Question
Question
Question
Question
Question
Question
Question
Referring to the figure above, to show directions or trends in a linear data series over time you would use the ____ chart.
A) pie
B) bar
C) line
D) scatter
Question
Question
Referring to the figure above, if you wanted to compare the percentage of an element to the whole, you would use the ____ chart.
A) pie
B) bar
C) line
D) scatter
Question
Question
Question
Question
Question
Question
Question
Question
Question
Question
Question
Question
Match between columns

Unlock Deck
Sign up to unlock the cards in this deck!
Unlock Deck
Unlock Deck
1/46
Play
Full screen (f)
Deck 5: Decision Support Tools
1
A ____________________ (DSS) is interactive software designed to help you compile useful information from raw data, documents, and business knowledge.
decision support system
2
The ____________________ value of a set of data is that point that separates the higher values from the lower values.
median
3
Data sets cannot have more than one mode.
False
4
On a decision tree, triangles indicate that a choice must be made.
Unlock Deck
Unlock for access to all 46 flashcards in this deck.
Unlock Deck
k this deck
5
The ____________________ value of a set of data is usually referred to as the average.
Unlock Deck
Unlock for access to all 46 flashcards in this deck.
Unlock Deck
k this deck
6
Although means are affected by extremely large or small values in the data set, ____ are not.
A) standard deviations
B) modes
C) medians
D) none of the above
A) standard deviations
B) modes
C) medians
D) none of the above
Unlock Deck
Unlock for access to all 46 flashcards in this deck.
Unlock Deck
k this deck
7
The mode is the most common descriptive statistic and is simple to compute.
Unlock Deck
Unlock for access to all 46 flashcards in this deck.
Unlock Deck
k this deck
8
Argument values are always contained inside parentheses.
Unlock Deck
Unlock for access to all 46 flashcards in this deck.
Unlock Deck
k this deck
9
The ____ is calculated by ordering all of your data from lowest value to highest value and selecting the middle one.
A) median
B) arithmetic mean
C) mode
D) standard deviation
A) median
B) arithmetic mean
C) mode
D) standard deviation
Unlock Deck
Unlock for access to all 46 flashcards in this deck.
Unlock Deck
k this deck
10
Bar charts with vertical bars are called line charts.
Unlock Deck
Unlock for access to all 46 flashcards in this deck.
Unlock Deck
k this deck
11
When you are making a decision, a DSS helps you evaluate all parts of the decision objectively.
Unlock Deck
Unlock for access to all 46 flashcards in this deck.
Unlock Deck
k this deck
12
The diagram shown above shows a survey that uses a five-point scale.However, a three-point or four-point scale is equally effective.
Unlock Deck
Unlock for access to all 46 flashcards in this deck.
Unlock Deck
k this deck
13
When you solve a problem ____, you react immediately and instinctively, without following a particular procedure.
A) intuitively
B) systematically
C) both a. and b.
D) neither a. nor b.
A) intuitively
B) systematically
C) both a. and b.
D) neither a. nor b.
Unlock Deck
Unlock for access to all 46 flashcards in this deck.
Unlock Deck
k this deck
14
The ____________________ are values in the results that could change if the decision variables change.
Unlock Deck
Unlock for access to all 46 flashcards in this deck.
Unlock Deck
k this deck
15
Survey designers recommend ____ scales as the most accurate; fewer points don't offer enough options, and more points creates confusion.
A) four-point
B) five-point
C) six-point
D) seven-point
A) four-point
B) five-point
C) six-point
D) seven-point
Unlock Deck
Unlock for access to all 46 flashcards in this deck.
Unlock Deck
k this deck
16
Early DSSs were small, proprietary, and inexpensive.
Unlock Deck
Unlock for access to all 46 flashcards in this deck.
Unlock Deck
k this deck
17
To make numeric data useful, organize it in a(n) ____________________, which is one or more formulas that includes all of the relevant variables and calculates a result.
Unlock Deck
Unlock for access to all 46 flashcards in this deck.
Unlock Deck
k this deck
18
The survey shown above takes subjective data and turns it into a quantitative model by converting the information into numbers.
Unlock Deck
Unlock for access to all 46 flashcards in this deck.
Unlock Deck
k this deck
19
Decision variables are often used in formulas that show results.
Unlock Deck
Unlock for access to all 46 flashcards in this deck.
Unlock Deck
k this deck
20
Referring to the bar chart in the figure above, a bar chart uses rectangular bars to display data values.The statement below that is true is: ____.
A) A longer bar means a greater value
B) A smaller bar means a greater value
C) The size of the bar does not correspond to the value
D) None of the above
Unlock Deck
Unlock for access to all 46 flashcards in this deck.
Unlock Deck
k this deck
21
Standard deviation is a measure of the variability of a set of data._________________________
Unlock Deck
Unlock for access to all 46 flashcards in this deck.
Unlock Deck
k this deck
22
You can model your decisions quantitatively, which means you represent the decision and its factors using letters._________________________
Unlock Deck
Unlock for access to all 46 flashcards in this deck.
Unlock Deck
k this deck
23
The first chart that Helen is putting together shows the sales growth of organic dog food over time.What type of chart would you recommend that Helen uses?
A) pie chart
B) area chart
C) line chart
D) any of the above
A) pie chart
B) area chart
C) line chart
D) any of the above
Unlock Deck
Unlock for access to all 46 flashcards in this deck.
Unlock Deck
k this deck
24
Like OpenOffice Calc, ____ is a free, open-source spreadsheet program that is part of the GNOME desktop for computers running the Linux operating system.
A) Gnumeric
B) Google
C) GCalc
D) GStat
A) Gnumeric
B) Google
C) GCalc
D) GStat
Unlock Deck
Unlock for access to all 46 flashcards in this deck.
Unlock Deck
k this deck
25
When you solve a problem systematically, you react immediately and instinctively, without following a particular procedure._________________________
Unlock Deck
Unlock for access to all 46 flashcards in this deck.
Unlock Deck
k this deck
26
A DSS is ideal for analyzing complex problems that involve sets of data and demand a systematic decision-making approach._________________________
Unlock Deck
Unlock for access to all 46 flashcards in this deck.
Unlock Deck
k this deck
27
When modeling a decision using ____ data, you can use mathematics to help you analyze and compare the data.
A) quantitative
B) qualitative
C) both a. and b.
D) neither a. nor b.
A) quantitative
B) qualitative
C) both a. and b.
D) neither a. nor b.
Unlock Deck
Unlock for access to all 46 flashcards in this deck.
Unlock Deck
k this deck
28
On a decision tree, ____ represent decisions.
A) triangles
B) squares
C) rectangles
D) ovals
A) triangles
B) squares
C) rectangles
D) ovals
Unlock Deck
Unlock for access to all 46 flashcards in this deck.
Unlock Deck
k this deck
29
Bar charts are oriented ____.
A) horizontally
B) vertically
C) either a. or b.
D) neither a. nor b.
A) horizontally
B) vertically
C) either a. or b.
D) neither a. nor b.
Unlock Deck
Unlock for access to all 46 flashcards in this deck.
Unlock Deck
k this deck
30
The second chart Helen is preparing is one that shows organic dog food as a percentage of total dog food sold in January.What type of chart should Helen use?
A) pie
B) scatter
C) line
D) any of the above
A) pie
B) scatter
C) line
D) any of the above
Unlock Deck
Unlock for access to all 46 flashcards in this deck.
Unlock Deck
k this deck
31
A(n) ____ typically defines a calculation that you perform on one or more variables.
A) formula
B) property
C) behavior
D) arithmetic mean
A) formula
B) property
C) behavior
D) arithmetic mean
Unlock Deck
Unlock for access to all 46 flashcards in this deck.
Unlock Deck
k this deck
32
Referring to the figure above, to show directions or trends in a linear data series over time you would use the ____ chart.
A) pie
B) bar
C) line
D) scatter
Unlock Deck
Unlock for access to all 46 flashcards in this deck.
Unlock Deck
k this deck
33
A decision tree is a support tool that models decisions using a treelike diagram.Each branch of the tree represents an option and its ____.
A) benefits
B) costs
C) likelihood
D) all of the above
A) benefits
B) costs
C) likelihood
D) all of the above
Unlock Deck
Unlock for access to all 46 flashcards in this deck.
Unlock Deck
k this deck
34
Referring to the figure above, if you wanted to compare the percentage of an element to the whole, you would use the ____ chart.
A) pie
B) bar
C) line
D) scatter
Unlock Deck
Unlock for access to all 46 flashcards in this deck.
Unlock Deck
k this deck
35
Decision variables are values that could change and affect the results.Statisticians refer to these as ____ variables.
A) dependent
B) independent
C) codependent
D) child
A) dependent
B) independent
C) codependent
D) child
Unlock Deck
Unlock for access to all 46 flashcards in this deck.
Unlock Deck
k this deck
36
The mean of a set of data is the value that occurs most frequently._________________________
Unlock Deck
Unlock for access to all 46 flashcards in this deck.
Unlock Deck
k this deck
37
A cell reference is a pointer that you include in a formula to tell the spreadsheet where to find the actual data._________________________
Unlock Deck
Unlock for access to all 46 flashcards in this deck.
Unlock Deck
k this deck
38
Helen has researched some software and found one that completes 3D scatter plots.It turns out that most software tools can display 3D scatter plots with up to ____ dimensions.
A) three
B) four
C) five
D) six
A) three
B) four
C) five
D) six
Unlock Deck
Unlock for access to all 46 flashcards in this deck.
Unlock Deck
k this deck
39
When normalizing, you usually ____ the data by a variable so you can compare the variables fairly.
A) multiply
B) divide
C) either a. or b.
D) neither a. nor b.
A) multiply
B) divide
C) either a. or b.
D) neither a. nor b.
Unlock Deck
Unlock for access to all 46 flashcards in this deck.
Unlock Deck
k this deck
40
A decision tree is a support tool that models decisions using a treelike diagram._________________________
Unlock Deck
Unlock for access to all 46 flashcards in this deck.
Unlock Deck
k this deck
41
Assumptions are the values or cell references that the function uses in its calculations._________________________
Unlock Deck
Unlock for access to all 46 flashcards in this deck.
Unlock Deck
k this deck
42
When electronic spreadsheets were first developed, one of the early applications for the technology was performing what-else analyses._________________________
Unlock Deck
Unlock for access to all 46 flashcards in this deck.
Unlock Deck
k this deck
43
Decision trees are made up of three primary elements: Uncertainties, Decisions, and Results.For each decision tree elements please indicate the shape that represents that element and a description of how that element is used in creating values for each option.
Unlock Deck
Unlock for access to all 46 flashcards in this deck.
Unlock Deck
k this deck
44
Sometimes called a sensitivity analysis, a what-if analysis allows you to study how changing one or more values affects the results.Please briefly describe the following terms related to performing a what-if analysis: decision variables, constants, and output variables.
Unlock Deck
Unlock for access to all 46 flashcards in this deck.
Unlock Deck
k this deck
45
Variables are elements that are not likely to change much over time._________________________
Unlock Deck
Unlock for access to all 46 flashcards in this deck.
Unlock Deck
k this deck
46
Match between columns
Unlock Deck
Unlock for access to all 46 flashcards in this deck.
Unlock Deck
k this deck
Unlock Deck
Unlock for access to all 46 flashcards in this deck.


