Deck 53: Population Ecology
Full screen (f)
Question
According to the logistic growth equation 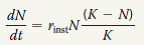
A) the number of individuals added per unit time is greatest when N is close to zero.
B) the per capita growth rate (r) increases as N approaches K.
C) population growth is zero when N equals K.
D) the population grows exponentially when K is small.
A) the number of individuals added per unit time is greatest when N is close to zero.
B) the per capita growth rate (r) increases as N approaches K.
C) population growth is zero when N equals K.
D) the population grows exponentially when K is small.
Question
Question
Question
Question
Question
Question
Question
Question
Question
Question
SYNTHESIZE YOUR KNOWLEDGE 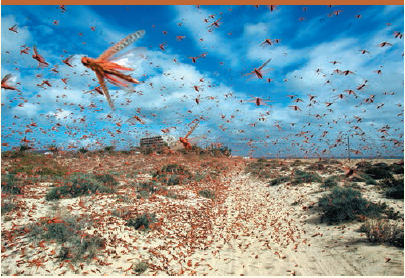
Locusts (grasshoppers in the family Acrididae) undergo cyclic population outbreaks, leading to massive swarms such as this one in the Canary Islands, off the west coast of Africa. Of the mechanisms of density-dependent regulation shown in Figure 53.18, choose the two that you think most apply to locust swarms, and explain why.
Locusts (grasshoppers in the family Acrididae) undergo cyclic population outbreaks, leading to massive swarms such as this one in the Canary Islands, off the west coast of Africa. Of the mechanisms of density-dependent regulation shown in Figure 53.18, choose the two that you think most apply to locust swarms, and explain why.
Question
Question
Question
Question
Question
Question
Question

Unlock Deck
Sign up to unlock the cards in this deck!
Unlock Deck
Unlock Deck
1/18
Play
Full screen (f)
Deck 53: Population Ecology
1
According to the logistic growth equation
A) the number of individuals added per unit time is greatest when N is close to zero.
B) the per capita growth rate (r) increases as N approaches K.
C) population growth is zero when N equals K.
D) the population grows exponentially when K is small.
A) the number of individuals added per unit time is greatest when N is close to zero.
B) the per capita growth rate (r) increases as N approaches K.
C) population growth is zero when N equals K.
D) the population grows exponentially when K is small.
Change in population size is given by the logistic growth equation and is shown below:  When N is small that is close to zero or small then the rate of population change is also zero or small. Hence, option (a) is incorrect.
As N approaches K then the factor (K-N)/K is approach to zero. At that point per captia rate of increase is small. Hence, option (b) is incorrect.
When K approaches N then the model is close to the exponential model. As N approaches K then the factor (K-N)/K is approach to zero. It means the birth rate is equal to the death rate. Therefore, option (d) and (e) are incorrect.
When N is equal to K then population rate stops its growth. Hence, correct option is .
.
When N is small that is close to zero or small then the rate of population change is also zero or small. Hence, option (a) is incorrect.As N approaches K then the factor (K-N)/K is approach to zero. At that point per captia rate of increase is small. Hence, option (b) is incorrect.
When K approaches N then the model is close to the exponential model. As N approaches K then the factor (K-N)/K is approach to zero. It means the birth rate is equal to the death rate. Therefore, option (d) and (e) are incorrect.
When N is equal to K then population rate stops its growth. Hence, correct option is
. 2
During exponential growth, a population always
A) has a constant, instantaneous per capita growth rate.
B) quickly reaches its carrying capacity.
C) cycles through time.
D) loses some individuals to emigration.
A) has a constant, instantaneous per capita growth rate.
B) quickly reaches its carrying capacity.
C) cycles through time.
D) loses some individuals to emigration.
Exponential population growth is determined by following relation:  In this relation it is clear that the rate of population growth is increases when the per capita rate is maxima. Now a day the population is not growing exponentially, in fact it is growing rapidly then exponential rate. Thus on the basis of the above explanation correct option is
  .
.
In this relation it is clear that the rate of population growth is increases when the per capita rate is maxima. Now a day the population is not growing exponentially, in fact it is growing rapidly then exponential rate. Thus on the basis of the above explanation correct option is . 3
Which of the following statements about human population in industrialized countries is incorrect
A) Life history is r-selected.
B) Average family size is relatively small.
C) The population has undergone the demographic transition.
D) The survivorship curve is Type I
A) Life history is r-selected.
B) Average family size is relatively small.
C) The population has undergone the demographic transition.
D) The survivorship curve is Type I
In the industrialized countries the population is so distributed according to the resources so that the average size of the family is small. Hence, option (b) is incorrect.
According to the scientific studies the population of the industrials countries is under demographic transition,. They are moving from one place to other where the resources for their members are adequate. Based on this calculation the survivorship curve is of type 1. The age distribution is comparatively uniform. Therefore, option (c), (d) and (e) are incorrect.
The life history of the people in the industrials countries is r- selected. It means they are less dependent on the density. This is termed as r-selection. Hence, the correct option is .
.
According to the scientific studies the population of the industrials countries is under demographic transition,. They are moving from one place to other where the resources for their members are adequate. Based on this calculation the survivorship curve is of type 1. The age distribution is comparatively uniform. Therefore, option (c), (d) and (e) are incorrect.
The life history of the people in the industrials countries is r- selected. It means they are less dependent on the density. This is termed as r-selection. Hence, the correct option is
. 4
INTERPRET THE DATA To estimate which age cohort in a population of females produces the most female offspring, you need information about the number of offspring produced per capita within that cohort and the number of individuals alive in the cohort. Make this estimate for Belding's ground squirrels by multiplying the number of females alive at the start of the year (column 2 in Table 53.1) by the average number of female offspring produced per female (column 5 in Table 53.1). Draw a bar graph with female age in years on the x -axis (0-1, 1-2, and so on) and total number of female offspring produced for each age cohort on the y -axis. Which cohort of female Belding's ground squirrels produces the most female young
Unlock Deck
Unlock for access to all 18 flashcards in this deck.
Unlock Deck
k this deck
5
EVOLUTION CONNECTION Contrast the selective pressures operating in high-density populations (those near the carrying capacity, K ) versus low-density populations.
Unlock Deck
Unlock for access to all 18 flashcards in this deck.
Unlock Deck
k this deck
6
SCIENTIFIC INQUIRY
You are testing the hypothesis that increased population density of a particular plant species increases the rate at which a pathogenic fungus infects the plant. Because the fungus causes visible scars on the leaves, you can easily determine whether a plant is infected. Design an experiment to test your hypothesis. Describe your experimental and control groups, how you would collect data, and what results you would see if your hypothesis is correct.
You are testing the hypothesis that increased population density of a particular plant species increases the rate at which a pathogenic fungus infects the plant. Because the fungus causes visible scars on the leaves, you can easily determine whether a plant is infected. Design an experiment to test your hypothesis. Describe your experimental and control groups, how you would collect data, and what results you would see if your hypothesis is correct.
Unlock Deck
Unlock for access to all 18 flashcards in this deck.
Unlock Deck
k this deck
7
SCIENCE, TECHNOLOGY, AND SOCIETY
Many people regard the rapid population growth of less industrialized countries as our most serious environmental problem. Others think that the population growth in industrialized countries, though smaller, is actually a greater environmental threat. What problems result from population growth in (a) less industrialized countries and (b) industrialized nations Which do you think is a greater threat, and why
Many people regard the rapid population growth of less industrialized countries as our most serious environmental problem. Others think that the population growth in industrialized countries, though smaller, is actually a greater environmental threat. What problems result from population growth in (a) less industrialized countries and (b) industrialized nations Which do you think is a greater threat, and why
Unlock Deck
Unlock for access to all 18 flashcards in this deck.
Unlock Deck
k this deck
8
What Happens to the Size of a Population When It Over-shoots Its Carrying Capacity
In the logistic population growth model, the per capita rate of population increase approaches zero as the population size (N) approaches the carrying capacity (K). Under some conditions, however, a population in the laboratory or the field can overshoot K, at least temporarily. If food becomes limiting to a population, for instance, there may be a delay before reproduction declines, and N may briefly exceed K. In this exercise, you will use the logis-tic equation to model the growth of the hypothetical population in Table 40.2 when N K.
Assuming that r = 1.0 and K = 1,500, calculate the population growth rate for four cases where population size (N) is greater than carrying capacity (K): N = 1,510; 1,600; 1,750; and 2,000 individuals. To do this first write the equation for population growth rate given in Table 40.2. Plug in the values for each of the four cases, starting with N = 1,510, and solve the equation for each one. Which population size has the highest growth rate
Unlock Deck
Unlock for access to all 18 flashcards in this deck.
Unlock Deck
k this deck
9
FOCUS ON INTERACTIONS
In a short essay (100-150 words), identify the factor or factors in Figure 40.23 that you think may ultimately be most important for density-dependent population regulation in humans, and explain your reasoning.
In a short essay (100-150 words), identify the factor or factors in Figure 40.23 that you think may ultimately be most important for density-dependent population regulation in humans, and explain your reasoning.
Unlock Deck
Unlock for access to all 18 flashcards in this deck.
Unlock Deck
k this deck
10
Population ecologists follow the fate of same-age cohorts to
A) determine a population's carrying capacity.
B) determine the birth rate and death rate of each group in a population.
C) determine if a population is regulated by density-dependent processes.
D) determine the factors that regulate the size of a population.
A) determine a population's carrying capacity.
B) determine the birth rate and death rate of each group in a population.
C) determine if a population is regulated by density-dependent processes.
D) determine the factors that regulate the size of a population.
Unlock Deck
Unlock for access to all 18 flashcards in this deck.
Unlock Deck
k this deck
11
SYNTHESIZE YOUR KNOWLEDGE
Locusts (grasshoppers in the family Acrididae) undergo cyclic population outbreaks, leading to massive swarms such as this one in the Canary Islands, off the west coast of Africa. Of the mechanisms of density-dependent regulation shown in Figure 53.18, choose the two that you think most apply to locust swarms, and explain why.
Locusts (grasshoppers in the family Acrididae) undergo cyclic population outbreaks, leading to massive swarms such as this one in the Canary Islands, off the west coast of Africa. Of the mechanisms of density-dependent regulation shown in Figure 53.18, choose the two that you think most apply to locust swarms, and explain why.
Unlock Deck
Unlock for access to all 18 flashcards in this deck.
Unlock Deck
k this deck
12
What Happens to the Size of a Population When It Over-shoots Its Carrying Capacity
In the logistic population growth model, the per capita rate of population increase approaches zero as the population size (N) approaches the carrying capacity (K). Under some conditions, however, a population in the laboratory or the field can overshoot K, at least temporarily. If food becomes limiting to a population, for instance, there may be a delay before reproduction declines, and N may briefly exceed K. In this exercise, you will use the logis-tic equation to model the growth of the hypothetical population in Table 40.2 when N K.
If r is doubled, predict how the population growth rates will change for the four population sizes given in question 1. Now calculate the population growth rate for the same four cases, this time assuming that r = 2.0 (and with K still = 1,500).
Unlock Deck
Unlock for access to all 18 flashcards in this deck.
Unlock Deck
k this deck
13
A population's carrying capacity
A) may change as environmental conditions change.
B) can be accurately calculated using the logistic growth model.
C) increases as the per capita growth rate (r) decreases.
D) can never be exceeded.
A) may change as environmental conditions change.
B) can be accurately calculated using the logistic growth model.
C) increases as the per capita growth rate (r) decreases.
D) can never be exceeded.
Unlock Deck
Unlock for access to all 18 flashcards in this deck.
Unlock Deck
k this deck
14
What Happens to the Size of a Population When It Over-shoots Its Carrying Capacity
In the logistic population growth model, the per capita rate of population increase approaches zero as the population size (N) approaches the carrying capacity (K). Under some conditions, however, a population in the laboratory or the field can overshoot K, at least temporarily. If food becomes limiting to a population, for instance, there may be a delay before reproduction declines, and N may briefly exceed K. In this exercise, you will use the logistic equation to model the growth of the hypothetical population in Table 40.2 when N K.
Now let's see how the growth of a real-world population of Daphnia corresponds to this model. At what times in Figure 40.20b is the Daphnia population changing in ways that correspond to the values you calculated Hypothesize why the population drops below the carrying capacity briefly late in the experiment.
Unlock Deck
Unlock for access to all 18 flashcards in this deck.
Unlock Deck
k this deck
15
Scientific study of the population cycles of the snowshoe hare and its predator, the lynx, has revealed that
A) predation is the dominant factor affecting prey population cycling.
B) hares and lynx are so mutually dependent that each species cannot survive without the other.
C) both hare and lynx populations are regulated mainly by abiotic factors.
D) the hare population is r-selected and the lynx population is K-selected.
Unlock Deck
Unlock for access to all 18 flashcards in this deck.
Unlock Deck
k this deck
16
Analyzing ecological footprints reveals that
a. Earth's carrying capacity would increase if per capita meat consumption increased.
b. current demand by industrialized countries for resources is much smaller than the ecological footprint of those countries.
c. it is not possible for technological improvements to increase Earth's carrying capacity for humans.
d. the ecological footprint of the United States is large because per capita resource use is high.
Unlock Deck
Unlock for access to all 18 flashcards in this deck.
Unlock Deck
k this deck
17
Based on current growth rates, Earth's human population in 2019 will be closest to
(A) 2.5 million.
(B) 4.5 billion.
(C) 7.5 billion.
(D) 10.5 billion.
(A) 2.5 million.
(B) 4.5 billion.
(C) 7.5 billion.
(D) 10.5 billion.
Unlock Deck
Unlock for access to all 18 flashcards in this deck.
Unlock Deck
k this deck
18
The observation that members of a population are uniformly distributed suggests that
A) resources are distributed unevenly.
B) the members of the population are competing for access to a resource.
C) the members of the population are neither attracted to nor repelled by one another.
D) the density of the population is low.
A) resources are distributed unevenly.
B) the members of the population are competing for access to a resource.
C) the members of the population are neither attracted to nor repelled by one another.
D) the density of the population is low.
Unlock Deck
Unlock for access to all 18 flashcards in this deck.
Unlock Deck
k this deck
Unlock Deck
Unlock for access to all 18 flashcards in this deck.


