Deck 56: Conservation Biology and Global Change Protists
Full screen (f)
Question
Question
How Does the Atmospheric CO₂ Concentration Change During a Year and from Decade to Decade The blue curve in Figure 43.25 shows how the concentration of CO₂ in Earth's atmosphere has changed over a span of more than 50 years. For each year in that span, two data points are plotted, one in May and one in November. A more detailed picture of the change in CO₂ concentration can be obtained by looking at measurements made at more frequent intervals. In this exercise, you'll graph monthly CO₂ concentrations for each of three one-year periods.
Data from the Study The data in the table below are average CO₂ concentrations (in parts per million) at the Mauna Loa monitoring station for each month in 1990, 2000, and 2010.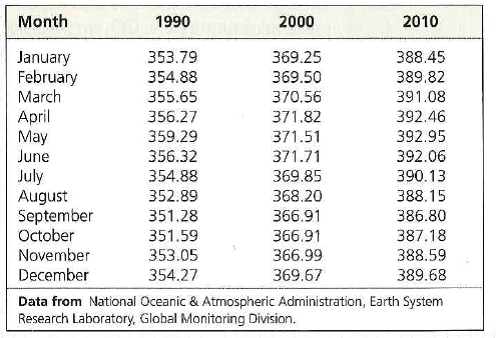
Within each year, what is the pattern of change in CO₂ concentration Why might this pattern have occurred
Data from the Study The data in the table below are average CO₂ concentrations (in parts per million) at the Mauna Loa monitoring station for each month in 1990, 2000, and 2010.
Within each year, what is the pattern of change in CO₂ concentration Why might this pattern have occurred
Question
Question
How Does the Atmospheric CO₂ Concentration Change During a Year and from Decade to Decade The blue curve in Figure 43.25 shows how the concentration of CO₂ in Earth's atmosphere has changed over a span of more than 50 years. For each year in that span, two data points are plotted, one in May and one in November. A more detailed picture of the change in CO₂ concentration can be obtained by looking at measurements made at more frequent intervals. In this exercise, you'll graph monthly CO₂ concentrations for each of three one-year periods.
Data from the Study The data in the table below are average CO₂ concentrations (in parts per million) at the Mauna Loa monitoring station for each month in 1990, 2000, and 2010.
The measurements taken a Mauna loa represent average atmospheric CO₂ concentrations for the Northern Hemisphere suppose you could measure CO₂ concentrations under similar conditions in the southern hemisphere. What pattern would you expect to see in those measurements over the course of a year Explain.
Question
Question
How Does the Atmospheric CO₂ Concentration Change During a Year and from Decade to Decade The blue curve in Figure 43.25 shows how the concentration of CO₂ in Earth's atmosphere has changed over a span of more than 50 years. For each year in that span, two data points are plotted, one in May and one in November. A more detailed picture of the change in CO₂ concentration can be obtained by looking at measurements made at more frequent intervals. In this exercise, you'll graph monthly CO₂ concentrations for each of three one-year periods.
Data from the Study The data in the table below are average CO₂ concentrations (in parts per million) at the Mauna Loa monitoring station for each month in 1990, 2000, and 2010.
In addition to the changes within each year, what changes in CO₂ concentration occurred between 1990 and 2010 Calculate the average CO₂ concentration for the 12 months of each year. By what percentage did this average change from 1990 tO₂000 and from 1990 tO₂010
Question
Question
Question
Question
Question
Question
(a) Referring to Figure 56.28, estimate the average CO₂ concentration in 1975 and in 2012. (b) What was the rate of CO₂ concentration increase (ppm/yr) from 1975 tO₂012 (c) Assuming that the CO₂ concentration continues to rise as fast as it did from 1975 tO₂012, what will be the approximate CO₂ concentration in 2100 (d) Draw a graph of average CO₂ concentration from 1975 tO₂012 and then use a dashed line to extend the graph to the year 2100. (e) What ecological factors and human decisions will influence the actual rise in CO₂ concentration (f) How might additional scientific data help societies predict this value 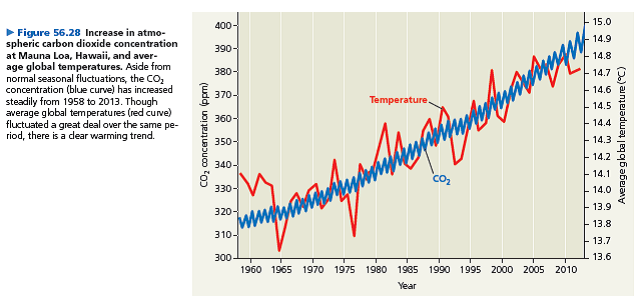
Question
Question
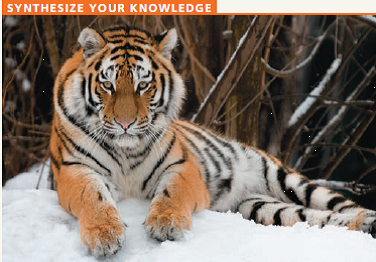
Big cats, such as the Siberian tiger (Panthera tigris altaica) shown here, are one of the most endangered groups of mammals in the world. Based on what you've learned in this chapter, discuss some of the approaches you would use to help preserve them.
Question
How Does the Atmospheric CO₂ Concentration Change During a Year and from Decade to Decade The blue curve in Figure 43.25 shows how the concentration of CO₂ in Earth's atmosphere has changed over a span of more than 50 years. For each year in that span, two data points are plotted, one in May and one in November. A more detailed picture of the change in CO₂ concentration can be obtained by looking at measurements made at more frequent intervals. In this exercise, you'll graph monthly CO₂ concentrations for each of three one-year periods.
Data from the Study The data in the table below are average CO₂ concentrations (in parts per million) at the Mauna Loa monitoring station for each month in 1990, 2000, and 2010.
Plot the data for each of the three years on one graph (producing three curves). Select a type of graph that is appropriate for these data, and choose a vertical-axis scale that allows you to clearly see the patterns of CO₂ concentration changes, both during each year and from decade to decade. (For additional information about graphs, see the scientific skills review in appendix F and in the study area in mastering biology.)

Unlock Deck
Sign up to unlock the cards in this deck!
Unlock Deck
Unlock Deck
1/15
Play
Full screen (f)
Deck 56: Conservation Biology and Global Change Protists
1
One characteristic that distinguishes a population in an extinction vortex from most other populations is that
A) it is a rare, top-level predator.
B) its effective population size is much lower than its total population size.
C) its genetic diversity is very low.
D) it is not well adapted to edge conditions.
A) it is a rare, top-level predator.
B) its effective population size is much lower than its total population size.
C) its genetic diversity is very low.
D) it is not well adapted to edge conditions.
An extinction vortex displays the list of various species to be protected and also the strategies to protect them. The numbers of such species are very low and they may become extinct if not protected. These species are called endangered species. Habitat gets fragmented by natural calamities and population of the same species may get separated. But the reason for becoming endangered species is not habitat is fragmentation. So option (a) is incorrect.
A rare and top level predator need not be an endangered species. They become threatened species when the number in the population starts declining when compared to the past. So option (b) is incorrect.
Population of a species is the total number of individuals in a particular area. Effective population if number of individuals fertile to breed and produce young ones.This number is less than the total population since it does not involve old members and children. So option (c) is incorrect.
Edge effect is the difference in the conditions in habitat at the periphery. It is more when the habitat is smaller. Members get adapted edge effect whereas extinction of a species is not due to edge effect. So option (e) is incorrect.
When the size of a population of a species become small the variation among the individuals due to genetic reasons become minimized.The chances to get variations for adaptation also become less. Better genetic diversity is needed for better adaptation. Thus more chances for members of the species to perish. So one characteristic that distinguishes a population in an extinction vortex from most other populations is its genetic diversity is very low. Hence, option is correct.
A rare and top level predator need not be an endangered species. They become threatened species when the number in the population starts declining when compared to the past. So option (b) is incorrect.
Population of a species is the total number of individuals in a particular area. Effective population if number of individuals fertile to breed and produce young ones.This number is less than the total population since it does not involve old members and children. So option (c) is incorrect.
Edge effect is the difference in the conditions in habitat at the periphery. It is more when the habitat is smaller. Members get adapted edge effect whereas extinction of a species is not due to edge effect. So option (e) is incorrect.
When the size of a population of a species become small the variation among the individuals due to genetic reasons become minimized.The chances to get variations for adaptation also become less. Better genetic diversity is needed for better adaptation. Thus more chances for members of the species to perish. So one characteristic that distinguishes a population in an extinction vortex from most other populations is its genetic diversity is very low. Hence, option
is correct. 2
How Does the Atmospheric CO₂ Concentration Change During a Year and from Decade to Decade The blue curve in Figure 43.25 shows how the concentration of CO₂ in Earth's atmosphere has changed over a span of more than 50 years. For each year in that span, two data points are plotted, one in May and one in November. A more detailed picture of the change in CO₂ concentration can be obtained by looking at measurements made at more frequent intervals. In this exercise, you'll graph monthly CO₂ concentrations for each of three one-year periods.
Data from the Study The data in the table below are average CO₂ concentrations (in parts per million) at the Mauna Loa monitoring station for each month in 1990, 2000, and 2010.
Within each year, what is the pattern of change in CO₂ concentration Why might this pattern have occurred
Data from the Study The data in the table below are average CO₂ concentrations (in parts per million) at the Mauna Loa monitoring station for each month in 1990, 2000, and 2010.
Within each year, what is the pattern of change in CO₂ concentration Why might this pattern have occurred
The CO₂ (carbon dioxide) levels recorded each month for the years 1990, 2000 and 2010 are given. A graphical representation of the given data is shown below. 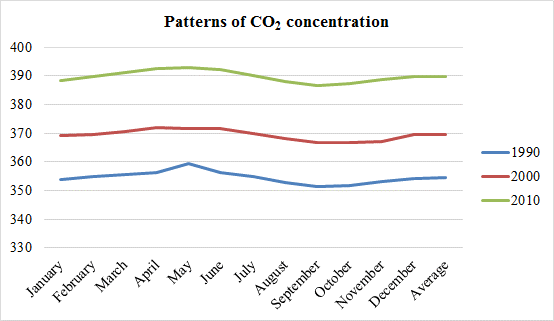 Figure: A graph representing the patterns of carbon dioxide concentration.
The graph shows small fluctuations in the average CO₂ level per month within each year. The average CO₂ levels also show a small increase in the summer months of March, April, and May and a fall in the CO₂ levels in the winter months of September, October, and November.
This can be attributed to the respiration rates of mammals and other animals in the summer months and lower respiration rates in the winters. Also, animals further north undergo hibernation in the winter months and deciduous trees shed their leave which could have resulted in lower respiration rates and hence lower CO₂ levels.
Figure: A graph representing the patterns of carbon dioxide concentration. The graph shows small fluctuations in the average CO₂ level per month within each year. The average CO₂ levels also show a small increase in the summer months of March, April, and May and a fall in the CO₂ levels in the winter months of September, October, and November.
This can be attributed to the respiration rates of mammals and other animals in the summer months and lower respiration rates in the winters. Also, animals further north undergo hibernation in the winter months and deciduous trees shed their leave which could have resulted in lower respiration rates and hence lower CO₂ levels.
3
The main cause of the increase in the amount of CO₂ in Earth's atmosphere over the past 150 years is
A) increased worldwide primary production.
B) increased worldwide standing crop.
C) an increase in the amount of infrared radiation absorbed by the atmosphere.
D) the burning of larger amounts of wood and fossil fuels.
A) increased worldwide primary production.
B) increased worldwide standing crop.
C) an increase in the amount of infrared radiation absorbed by the atmosphere.
D) the burning of larger amounts of wood and fossil fuels.
The Greenhouse House effect and melting of ice in polar region are topics widely debated and concerned. The Greenhouse House effect is due to increase in the carbon dioxide concentration in the atmosphere. Carbon dioxide is present in the air. When the percentage increases due to pollution it causes changes in the biosphere. There are various reasons why rise in carbon dioxide occur in the atmosphere. Increase in primary production by producer's of carbon dioxide is used up and the concentration may come down. So option (a) is incorrect.
Standing crop refers to the dried biomass. Plants are the photosynthetic organisms. They trap the solar energy and convert it into biomass. It is not the reason for increase in the carbon dioxide concentration in the atmosphere. So option (b) is incorrect.
Various gases in the atmosphere absorb radiation from sun. This phenomenon increases temperature of the atmosphere. This is Greenhouse House effect.Those gases which absorb radiation and cause rise in temperature of the atmosphere are the greenhouse gases. Carbon dioxide is a greenhouse gas.So option (c) is incorrect.
Respiration may add carbon dioxide to the atmosphere. It is required for photosynthesis. Nature tries to maintain its balance. So option (e) is incorrect.
As human population increased use of wood for burning and fossil fuel increased. The amount of carbon dioxide given out by using fossil fuel and wood as fuel added huge amount of carbon dioxide into the atmosphere. So the main cause of rise in concentration of carbon dioxide is the burning of larger amounts of wood and fossil fuels.
Hence, option is correct.
Standing crop refers to the dried biomass. Plants are the photosynthetic organisms. They trap the solar energy and convert it into biomass. It is not the reason for increase in the carbon dioxide concentration in the atmosphere. So option (b) is incorrect.
Various gases in the atmosphere absorb radiation from sun. This phenomenon increases temperature of the atmosphere. This is Greenhouse House effect.Those gases which absorb radiation and cause rise in temperature of the atmosphere are the greenhouse gases. Carbon dioxide is a greenhouse gas.So option (c) is incorrect.
Respiration may add carbon dioxide to the atmosphere. It is required for photosynthesis. Nature tries to maintain its balance. So option (e) is incorrect.
As human population increased use of wood for burning and fossil fuel increased. The amount of carbon dioxide given out by using fossil fuel and wood as fuel added huge amount of carbon dioxide into the atmosphere. So the main cause of rise in concentration of carbon dioxide is the burning of larger amounts of wood and fossil fuels.
Hence, option
is correct. 4
How Does the Atmospheric CO₂ Concentration Change During a Year and from Decade to Decade The blue curve in Figure 43.25 shows how the concentration of CO₂ in Earth's atmosphere has changed over a span of more than 50 years. For each year in that span, two data points are plotted, one in May and one in November. A more detailed picture of the change in CO₂ concentration can be obtained by looking at measurements made at more frequent intervals. In this exercise, you'll graph monthly CO₂ concentrations for each of three one-year periods.
Data from the Study The data in the table below are average CO₂ concentrations (in parts per million) at the Mauna Loa monitoring station for each month in 1990, 2000, and 2010.
The measurements taken a Mauna loa represent average atmospheric CO₂ concentrations for the Northern Hemisphere suppose you could measure CO₂ concentrations under similar conditions in the southern hemisphere. What pattern would you expect to see in those measurements over the course of a year Explain.
Unlock Deck
Unlock for access to all 15 flashcards in this deck.
Unlock Deck
k this deck
5
What is the single greatest threat to biodiversity
(A) overharvesting of commercially important species
(B) habitat alteration, fragmentation, and destruction
(C) introduced species that compete with native species
(D) novel pathogens
(A) overharvesting of commercially important species
(B) habitat alteration, fragmentation, and destruction
(C) introduced species that compete with native species
(D) novel pathogens
Unlock Deck
Unlock for access to all 15 flashcards in this deck.
Unlock Deck
k this deck
6
How Does the Atmospheric CO₂ Concentration Change During a Year and from Decade to Decade The blue curve in Figure 43.25 shows how the concentration of CO₂ in Earth's atmosphere has changed over a span of more than 50 years. For each year in that span, two data points are plotted, one in May and one in November. A more detailed picture of the change in CO₂ concentration can be obtained by looking at measurements made at more frequent intervals. In this exercise, you'll graph monthly CO₂ concentrations for each of three one-year periods.
Data from the Study The data in the table below are average CO₂ concentrations (in parts per million) at the Mauna Loa monitoring station for each month in 1990, 2000, and 2010.
In addition to the changes within each year, what changes in CO₂ concentration occurred between 1990 and 2010 Calculate the average CO₂ concentration for the 12 months of each year. By what percentage did this average change from 1990 tO₂000 and from 1990 tO₂010
Unlock Deck
Unlock for access to all 15 flashcards in this deck.
Unlock Deck
k this deck
7
Which of the following is a consequence of biological magnification
A) Toxic chemicals in the environment pose greater risk to top-level predators than to primary consumers.
B) Populations of top-level predators are generally smaller than populations of primary consumers.
C) The biomass of producers in an ecosystem is generally higher than the biomass of primary consumers.
D) Only a small portion of the energy captured by producers is transferred to consumers.
Unlock Deck
Unlock for access to all 15 flashcards in this deck.
Unlock Deck
k this deck
8
Which of the following strategies would most rapidly increase the genetic diversity of a population in an extinction vortex
A) Establish a reserve that protects the population's habitat.
B) Introduce new individuals transported from other populations of the same species.
C) Sterilize the least fit individuals in the population.
D) Control populations of the endangered population's predators and competitors.
A) Establish a reserve that protects the population's habitat.
B) Introduce new individuals transported from other populations of the same species.
C) Sterilize the least fit individuals in the population.
D) Control populations of the endangered population's predators and competitors.
Unlock Deck
Unlock for access to all 15 flashcards in this deck.
Unlock Deck
k this deck
9
Of the following statements about protected areas that have been established to preserve biodiversity, which one is not correct
A) About 25% of Earth's land area is now protected.
B) National parks are one of many types of protected areas.
C) Management of a protected area should be coordinated with management of the land surrounding the area.
D) It is especially important to protect biodiversity hot spots.
A) About 25% of Earth's land area is now protected.
B) National parks are one of many types of protected areas.
C) Management of a protected area should be coordinated with management of the land surrounding the area.
D) It is especially important to protect biodiversity hot spots.
Unlock Deck
Unlock for access to all 15 flashcards in this deck.
Unlock Deck
k this deck
10
Suppose that you are managing a forest reserve, and one of your goals is to protect local populations of wood-land birds from parasitism by the brown-headed cowbird. You know that female cowbirds usually do not venture more than about 100m into a forest and that nest parasitism is reduced when woodland birds nest away from forest edges. The reserve you manage extends about 6,000 m from east to west and 3,000 m from north to south. It is surrounded by a deforested pasture on the west, an agricultural field for 500 m in the southwest corner, and intact forest everywhere else. You must build a road, 10m by 3,000 m, from the north to the south side of the reserve and construct a maintenance building that will take up 100 m 2 in the reserve. Draw a map of the reserve, showing where you would put the road and the building to minimize cowbird intrusion along edges. Explain your reasoning.
Unlock Deck
Unlock for access to all 15 flashcards in this deck.
Unlock Deck
k this deck
11
EVOLUTION CONNECTION
The fossil record indicates that there have been five mass extinction events in the past 500 million years (see Concept 25.4). Many ecologists think we are currently entering a sixth mass extinction event because of the threats to biodiversity described in this chapter. Briefly discuss the history of mass extinctions and the length of time it typically takes for species diversity to recover through the process of evolution. Explain why this should motivate us to slow the loss of biodiversity today.
The fossil record indicates that there have been five mass extinction events in the past 500 million years (see Concept 25.4). Many ecologists think we are currently entering a sixth mass extinction event because of the threats to biodiversity described in this chapter. Briefly discuss the history of mass extinctions and the length of time it typically takes for species diversity to recover through the process of evolution. Explain why this should motivate us to slow the loss of biodiversity today.
Unlock Deck
Unlock for access to all 15 flashcards in this deck.
Unlock Deck
k this deck
12
(a) Referring to Figure 56.28, estimate the average CO₂ concentration in 1975 and in 2012. (b) What was the rate of CO₂ concentration increase (ppm/yr) from 1975 tO₂012 (c) Assuming that the CO₂ concentration continues to rise as fast as it did from 1975 tO₂012, what will be the approximate CO₂ concentration in 2100 (d) Draw a graph of average CO₂ concentration from 1975 tO₂012 and then use a dashed line to extend the graph to the year 2100. (e) What ecological factors and human decisions will influence the actual rise in CO₂ concentration (f) How might additional scientific data help societies predict this value
Unlock Deck
Unlock for access to all 15 flashcards in this deck.
Unlock Deck
k this deck
13
WRITE ABOUT A THEME: INTERACTIONS
One factor favoring rapid population growth by an introduced species is the absence of the predators, parasites, and pathogens that controlled its population in the region where it evolved. In a short essay (100-150 words), explain how evolution by natural selection would influence the rate at which native predators, parasites, and pathogens in a region of introduction attack an introduced species.
One factor favoring rapid population growth by an introduced species is the absence of the predators, parasites, and pathogens that controlled its population in the region where it evolved. In a short essay (100-150 words), explain how evolution by natural selection would influence the rate at which native predators, parasites, and pathogens in a region of introduction attack an introduced species.
Unlock Deck
Unlock for access to all 15 flashcards in this deck.
Unlock Deck
k this deck
14
Big cats, such as the Siberian tiger (Panthera tigris altaica) shown here, are one of the most endangered groups of mammals in the world. Based on what you've learned in this chapter, discuss some of the approaches you would use to help preserve them.
Unlock Deck
Unlock for access to all 15 flashcards in this deck.
Unlock Deck
k this deck
15
How Does the Atmospheric CO₂ Concentration Change During a Year and from Decade to Decade The blue curve in Figure 43.25 shows how the concentration of CO₂ in Earth's atmosphere has changed over a span of more than 50 years. For each year in that span, two data points are plotted, one in May and one in November. A more detailed picture of the change in CO₂ concentration can be obtained by looking at measurements made at more frequent intervals. In this exercise, you'll graph monthly CO₂ concentrations for each of three one-year periods.
Data from the Study The data in the table below are average CO₂ concentrations (in parts per million) at the Mauna Loa monitoring station for each month in 1990, 2000, and 2010.
Plot the data for each of the three years on one graph (producing three curves). Select a type of graph that is appropriate for these data, and choose a vertical-axis scale that allows you to clearly see the patterns of CO₂ concentration changes, both during each year and from decade to decade. (For additional information about graphs, see the scientific skills review in appendix F and in the study area in mastering biology.)
Unlock Deck
Unlock for access to all 15 flashcards in this deck.
Unlock Deck
k this deck
Unlock Deck
Unlock for access to all 15 flashcards in this deck.


