Deck 4: Demand, Supply, and Market Equilibrium
Full screen (f)
Question
Question
Question
Question
Question
Question
Question
Question
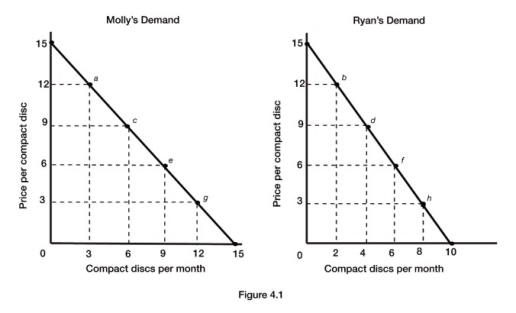
Refer to Figure 4.1, which shows Molly's and Ryan's individual demand curves for compact discs per month. Assuming Molly and Ryan are the only consumers in the market, what is the market quantity demanded at a price of $9?
A) 2
B) 4
C) 6
D) 10
Question
Refer to Figure 4.1, which shows Molly's and Ryan's individual demand curves for compact discs per month. Assuming Molly and Ryan are the only consumers in the market, if the market quantity demanded is 15, the price must be
A) $0.
B) $6.
C) $9.
D) $15.
Question
Question
Question
Question
Question
Question
Question
Refer to Figure 4.1, which shows Molly's and Ryan's individual demand curves for compact discs per month. Assuming Molly and Ryan are the only consumers in the market, if the market quantity demanded is 5, the price must be
A) $3.
B) $6.
C) $9.
D) $12.
Question
Question
Question
Refer to Figure 4.1, which shows Molly's and Ryan's individual demand curves for compact discs per month. Assuming Molly and Ryan are the only consumers in the market, what is the market quantity demanded at a price of $3?
A) 6
B) 9
C) 15
D) 20
Question
Question
Figure 4.6
David's Supply Schedule Celeste's Supply Schedule
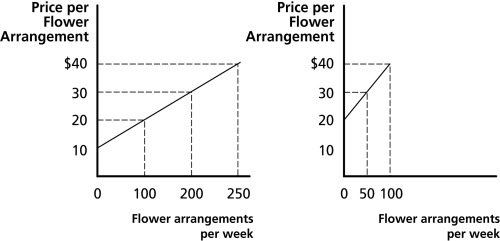
Refer to Figure 4.6, which shows David's and Celeste's individual supply curves for flower arrangements per week. Assuming David and Celeste are the only producers in the market, if the market quantity supplied is 50, the price must be
A) $0.
B) $10.
C) between $10 and $20.
D) $30.
David's Supply Schedule Celeste's Supply Schedule
Refer to Figure 4.6, which shows David's and Celeste's individual supply curves for flower arrangements per week. Assuming David and Celeste are the only producers in the market, if the market quantity supplied is 50, the price must be
A) $0.
B) $10.
C) between $10 and $20.
D) $30.
Question
4.3 Market Equilibrium: Bringing Demand and Supply Together
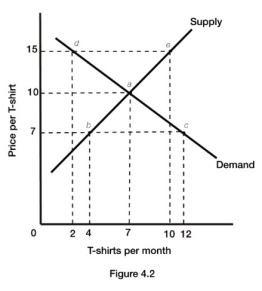
Figure 4.2 illustrates the supply and demand for t-shirts. If the actual price of t-shirts is $7, there is an
A) excess demand of 8 t-shirts.
B) excess supply of 8 t-shirts.
C) excess demand of 10 t-shirts.
D) excess supply of 10 t-shirts.
Figure 4.2 illustrates the supply and demand for t-shirts. If the actual price of t-shirts is $7, there is an
A) excess demand of 8 t-shirts.
B) excess supply of 8 t-shirts.
C) excess demand of 10 t-shirts.
D) excess supply of 10 t-shirts.
Question
Table 4.1
Quantity of Frozen Latte-On-A-Stick Supplied
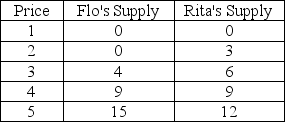
Refer to Table 4.1, which shows Flo's and Rita's individual supply schedules for frozen latte-on-a-stick. Assuming Flo and Rita are the only suppliers in the market, what is the market quantity supplied at a price of $5?
A) 3
B) 12
C) 15
D) 27
Quantity of Frozen Latte-On-A-Stick Supplied
Refer to Table 4.1, which shows Flo's and Rita's individual supply schedules for frozen latte-on-a-stick. Assuming Flo and Rita are the only suppliers in the market, what is the market quantity supplied at a price of $5?
A) 3
B) 12
C) 15
D) 27
Question
Question
Figure 4.6
David's Supply Schedule Celeste's Supply Schedule
Refer to Figure 4.6, which shows David's and Celeste's individual supply curves for flower arrangements per week. Assuming David and Celeste are the only producers in the market, what is the market quantity supplied at a price of $30?
A) 200
B) 250
C) 300
D) 350
Question
Question
Question
Question
Table 4.1
Quantity of Frozen Latte-On-A-Stick Supplied
Refer to Table 4.1, which shows Flo's and Rita's individual supply schedules for frozen latte-on-a-stick. Assuming Flo and Rita are the only suppliers in the market, what is the market quantity supplied at a price of $2?
A) 0
B) 2
C) 3
D) 5
Quantity of Frozen Latte-On-A-Stick Supplied
Refer to Table 4.1, which shows Flo's and Rita's individual supply schedules for frozen latte-on-a-stick. Assuming Flo and Rita are the only suppliers in the market, what is the market quantity supplied at a price of $2?
A) 0
B) 2
C) 3
D) 5
Question
Question
Question
Question
Figure 4.6
David's Supply Schedule Celeste's Supply Schedule
Refer to Figure 4.6, which shows David's and Celeste's individual supply curves for flower arrangements per week. Assuming David and Celeste are the only producers in the market, if the market quantity supplied is 350, the price must be
A) $10.
B) $20.
C) $30.
D) $40.
Question
Figure 4.6
David's Supply Schedule Celeste's Supply Schedule
Refer to Figure 4.6, which shows David's and Celeste's individual supply curves for flower arrangements per week. Assuming David and Celeste are the only producers in the market, what is the market quantity supplied at a price of $20?
A) 0
B) 100
C) 150
D) 200
Question
Table 4.1
Quantity of Frozen Latte-On-A-Stick Supplied
Refer to Table 4.1, which shows Flo's and Rita's individual supply schedules for frozen latte-on-a-stick. Assuming Flo and Rita are the only suppliers in the market, if the market quantity supplied is 3, the price must be
A) $0.
B) $2.
C) $4.
D) $5.
Quantity of Frozen Latte-On-A-Stick Supplied
Refer to Table 4.1, which shows Flo's and Rita's individual supply schedules for frozen latte-on-a-stick. Assuming Flo and Rita are the only suppliers in the market, if the market quantity supplied is 3, the price must be
A) $0.
B) $2.
C) $4.
D) $5.
Question
Question
Table 4.1
Quantity of Frozen Latte-On-A-Stick Supplied
Refer to Table 4.1, which shows Flo's and Rita's individual supply schedules for frozen latte-on-a-stick. Assuming Flo and Rita are the only suppliers in the market, if the market quantity supplied is 18, the price must be
A) $2.
B) $3.
C) $4.
D) $5.
Quantity of Frozen Latte-On-A-Stick Supplied
Refer to Table 4.1, which shows Flo's and Rita's individual supply schedules for frozen latte-on-a-stick. Assuming Flo and Rita are the only suppliers in the market, if the market quantity supplied is 18, the price must be
A) $2.
B) $3.
C) $4.
D) $5.
Question
Table 4.1
Quantity of Frozen Latte-On-A-Stick Supplied
Refer to Table 4.1, which shows Flo's and Rita's individual supply schedules for frozen latte-on-a-stick. Assuming Flo and Rita are the only suppliers in the market, what is the market quantity supplied at a price of $1?
A) 0
B) 1
C) 3
D) 5
Quantity of Frozen Latte-On-A-Stick Supplied
Refer to Table 4.1, which shows Flo's and Rita's individual supply schedules for frozen latte-on-a-stick. Assuming Flo and Rita are the only suppliers in the market, what is the market quantity supplied at a price of $1?
A) 0
B) 1
C) 3
D) 5
Question
Question
Question
Question
Question
Question
Question
4.3 Market Equilibrium: Bringing Demand and Supply Together
Figure 4.2 illustrates the supply and demand for t-shirts. If the actual price of t-shirts is $7, we would expect that
A) demand will decrease until quantity demanded equals quantity supplied.
B) supply will increase until quantity demanded equals quantity supplied.
C) price will increase until quantity demanded equals quantity supplied.
D) there will be no change in the price since the market is in equilibrium.
Question
Question
Question
Question
4.3 Market Equilibrium: Bringing Demand and Supply Together
Figure 4.2 illustrates the supply and demand for t-shirts. If the actual price of t-shirts is $10, we would expect that
A) demand will decrease until quantity demanded equals quantity supplied.
B) supply will increase until quantity demanded equals quantity supplied.
C) price will increase until quantity demanded equals quantity supplied.
D) there will be no change in the price since the market is in equilibrium.
Question
Question
4.3 Market Equilibrium: Bringing Demand and Supply Together
Figure 4.2 illustrates the supply and demand for t-shirts. If the actual price of t-shirts is $15, there is an
A) excess demand of 8 t-shirts.
B) excess supply of 8 t-shirts.
C) excess demand of 10 t-shirts.
D) excess supply of 10 t-shirts.
Figure 4.2 illustrates the supply and demand for t-shirts. If the actual price of t-shirts is $15, there is an
A) excess demand of 8 t-shirts.
B) excess supply of 8 t-shirts.
C) excess demand of 10 t-shirts.
D) excess supply of 10 t-shirts.
Question
Question
Question
Question
4.3 Market Equilibrium: Bringing Demand and Supply Together
Figure 4.2 illustrates the supply and demand for t-shirts. If the actual price of t-shirts is $15, we would expect that
A) demand will decrease until quantity demanded equals quantity supplied.
B) supply will increase until quantity demanded equals quantity supplied.
C) price will decrease until quantity demanded equals quantity supplied.
D) there will be no change in the price since the market is in equilibrium.
Question
Question
Question
Question
Question
Question
4.4 Market Effects of Changes in Demand
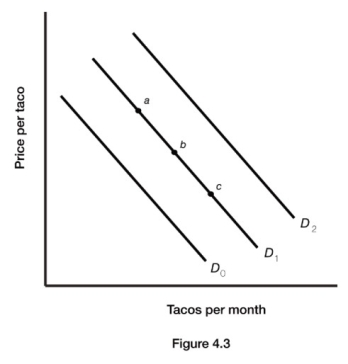
Figure 4.3 illustrates the demand for tacos. Assume tacos are an inferior good. An increase in income would bring about a movement from
A) point a to point b.
B) point c to point b.
C) D2 to D1.
D) D0 to D1.
Figure 4.3 illustrates the demand for tacos. Assume tacos are an inferior good. An increase in income would bring about a movement from
A) point a to point b.
B) point c to point b.
C) D2 to D1.
D) D0 to D1.
Question
Question
4.4 Market Effects of Changes in Demand
Figure 4.3 illustrates the demand for tacos. A successful advertising campaign to sell tacos would bring about a movement from
A) point a to point b.
B) point c to point b.
C) D2 to D1.
D) D0 to D1.
Figure 4.3 illustrates the demand for tacos. A successful advertising campaign to sell tacos would bring about a movement from
A) point a to point b.
B) point c to point b.
C) D2 to D1.
D) D0 to D1.
Question
4.4 Market Effects of Changes in Demand
Figure 4.3 illustrates the demand for tacos. Assume that tacos and beer are complements. An increase in the price of beer would bring about a movement from
A) point a to point b.
B) point c to point b.
C) D2 to D1.
D) D0 to D2.
Figure 4.3 illustrates the demand for tacos. Assume that tacos and beer are complements. An increase in the price of beer would bring about a movement from
A) point a to point b.
B) point c to point b.
C) D2 to D1.
D) D0 to D2.
Question
4.4 Market Effects of Changes in Demand
Figure 4.3 illustrates the demand for tacos. An increase in the demand for tacos is represented by the movement from
A) point a to point b.
B) point c to point b.
C) D2 to D1.
D) D0 to D1.
Figure 4.3 illustrates the demand for tacos. An increase in the demand for tacos is represented by the movement from
A) point a to point b.
B) point c to point b.
C) D2 to D1.
D) D0 to D1.
Question
Question
4.4 Market Effects of Changes in Demand
Figure 4.3 illustrates the demand for tacos. A decrease in the demand for tacos is represented by the movement from
A) point a to point b.
B) point c to point b.
C) D2 to D1.
D) D0 to D1.
Figure 4.3 illustrates the demand for tacos. A decrease in the demand for tacos is represented by the movement from
A) point a to point b.
B) point c to point b.
C) D2 to D1.
D) D0 to D1.
Question
4.4 Market Effects of Changes in Demand
Figure 4.3 illustrates the demand for tacos. A decrease in price of tacos would bring about a movement from
A) point a to point c.
B) point c to point a.
C) D2 to D0.
D) D0 to D2.
Figure 4.3 illustrates the demand for tacos. A decrease in price of tacos would bring about a movement from
A) point a to point c.
B) point c to point a.
C) D2 to D0.
D) D0 to D2.
Question
Question
4.4 Market Effects of Changes in Demand
Figure 4.3 illustrates the demand for tacos. An increase in price of tacos would bring about a movement from
A) point a to point c.
B) point c to point a.
C) D2 to D0.
D) D0 to D1.
Figure 4.3 illustrates the demand for tacos. An increase in price of tacos would bring about a movement from
A) point a to point c.
B) point c to point a.
C) D2 to D0.
D) D0 to D1.
Question
Question
Question
4.4 Market Effects of Changes in Demand
Figure 4.3 illustrates the demand for tacos. Assume that tacos and burritos are substitutes. A decrease in the price of burritos would bring about a movement from
A) point a to point c.
B) point c to point b.
C) D2 to D0.
D) D1 to D2.
Figure 4.3 illustrates the demand for tacos. Assume that tacos and burritos are substitutes. A decrease in the price of burritos would bring about a movement from
A) point a to point c.
B) point c to point b.
C) D2 to D0.
D) D1 to D2.
Question
Question
4.4 Market Effects of Changes in Demand
Figure 4.3 illustrates the demand for tacos. An increase in the number of consumers in the market would bring about a movement from
A) point a to point b.
B) point c to point a.
C) D2 to D1.
D) D0 to D2.
Figure 4.3 illustrates the demand for tacos. An increase in the number of consumers in the market would bring about a movement from
A) point a to point b.
B) point c to point a.
C) D2 to D1.
D) D0 to D2.
Question
Question
4.4 Market Effects of Changes in Demand
Figure 4.3 illustrates the demand for tacos. Assume tacos are a normal good. An increase in income would bring about a movement from
A) point a to point b.
B) point c to point b.
C) D2 to D1.
D) D0 to D1.
Figure 4.3 illustrates the demand for tacos. Assume tacos are a normal good. An increase in income would bring about a movement from
A) point a to point b.
B) point c to point b.
C) D2 to D1.
D) D0 to D1.
Question
Question
4.4 Market Effects of Changes in Demand
Figure 4.3 illustrates the demand for tacos. If people expect the price of tacos to decrease in the near future, this would most likely bring about a movement from
A) point a to point b.
B) point c to point a.
C) D2 to D0.
D) D0 to D1.
Figure 4.3 illustrates the demand for tacos. If people expect the price of tacos to decrease in the near future, this would most likely bring about a movement from
A) point a to point b.
B) point c to point a.
C) D2 to D0.
D) D0 to D1.
Question
4.4 Market Effects of Changes in Demand
Figure 4.3 illustrates the demand for tacos. Assume that tacos and beer are complements. A decrease in the price of beer would bring about a movement from
A) point a to point c.
B) point c to point a.
C) D2 to D0.
D) D0 to D2.
Figure 4.3 illustrates the demand for tacos. Assume that tacos and beer are complements. A decrease in the price of beer would bring about a movement from
A) point a to point c.
B) point c to point a.
C) D2 to D0.
D) D0 to D2.

Unlock Deck
Sign up to unlock the cards in this deck!
Unlock Deck
Unlock Deck
1/172
Play
Full screen (f)
Deck 4: Demand, Supply, and Market Equilibrium
1
The Law of Demand can be explained as
A) a lot of people wanting the same thing.
B) the higher the price, the smaller the quantity demanded, ceteris paribus.
C) people are willing to make limited sacrifices to acquire products.
D) legal reasons people make purchases in the marketplace.
A) a lot of people wanting the same thing.
B) the higher the price, the smaller the quantity demanded, ceteris paribus.
C) people are willing to make limited sacrifices to acquire products.
D) legal reasons people make purchases in the marketplace.
the higher the price, the smaller the quantity demanded, ceteris paribus.
2
The market demand curve
A) shows the relationship between the price of a good and the quantity that all consumers together are willing to buy.
B) is drawn assuming that variables such as income and tastes are variable.
C) is drawn assuming that the number of consumers is variable.
D) is drawn assuming that the selling price is fixed.
shows the relationship between the price of a good and the quantity that all consumers together are willing to buy.
3
Suppose that there are only three consumers of a product. At a price of $6 per unit, the first consumer would buy 12 units of the product, the second consumer would buy 8 units, and the third consumer would buy 3 units of the product. If you drew a market demand curve for this product, the quantity demanded at a price of $6 would be
A) 23 units.
B) 20 units.
C) 12 units.
D) 11 units.
A) 23 units.
B) 20 units.
C) 12 units.
D) 11 units.
23 units.
4
Recall the Application about the decrease in taxes on cigarettes in several Canadian provinces in 1994 to answer the following question(s).
According to this Application, after the government deceased cigarette taxes in several Canadian provinces, demand for cigarettes ________ in these provinces, shifting the demand curve to the ________.
A) increased; right
B) increased; left
C) decreased; right
D) decreased; left
According to this Application, after the government deceased cigarette taxes in several Canadian provinces, demand for cigarettes ________ in these provinces, shifting the demand curve to the ________.
A) increased; right
B) increased; left
C) decreased; right
D) decreased; left
Unlock Deck
Unlock for access to all 172 flashcards in this deck.
Unlock Deck
k this deck
5
Recall the Application about the decrease in taxes on cigarettes in several Canadian provinces in 1994 to answer the following question(s).
According to this Application, after the government deceased cigarette taxes in several Canadian provinces in 1994, the price of cigarettes in these provinces decreased by roughly ________ percent.
A) 8
B) 17
C) 50
D) 88
According to this Application, after the government deceased cigarette taxes in several Canadian provinces in 1994, the price of cigarettes in these provinces decreased by roughly ________ percent.
A) 8
B) 17
C) 50
D) 88
Unlock Deck
Unlock for access to all 172 flashcards in this deck.
Unlock Deck
k this deck
6
In considering the relationships between price and quantity demanded, ceteris paribus directs the economist to assume that
A) price increases affect quantity.
B) quantity increases affect prices.
C) either price nor quantity affect demand.
D) all other variables remain unchanged.
A) price increases affect quantity.
B) quantity increases affect prices.
C) either price nor quantity affect demand.
D) all other variables remain unchanged.
Unlock Deck
Unlock for access to all 172 flashcards in this deck.
Unlock Deck
k this deck
7
When there is a change in the quantity demanded it means that
A) the hours the customer can buy products each day have increased.
B) the number of products in inventory have increased.
C) the quantity a consumer is willing to buy changes when the price changes.
D) the selling price of the products has not changed.
A) the hours the customer can buy products each day have increased.
B) the number of products in inventory have increased.
C) the quantity a consumer is willing to buy changes when the price changes.
D) the selling price of the products has not changed.
Unlock Deck
Unlock for access to all 172 flashcards in this deck.
Unlock Deck
k this deck
8
Refer to Figure 4.1, which shows Molly's and Ryan's individual demand curves for compact discs per month. Assuming Molly and Ryan are the only consumers in the market, what is the market quantity demanded at a price of $9?
A) 2
B) 4
C) 6
D) 10
Unlock Deck
Unlock for access to all 172 flashcards in this deck.
Unlock Deck
k this deck
9
Refer to Figure 4.1, which shows Molly's and Ryan's individual demand curves for compact discs per month. Assuming Molly and Ryan are the only consumers in the market, if the market quantity demanded is 15, the price must be
A) $0.
B) $6.
C) $9.
D) $15.
Unlock Deck
Unlock for access to all 172 flashcards in this deck.
Unlock Deck
k this deck
10
As the price of a product falls, the demand for the product increases, ceteris paribus.
Unlock Deck
Unlock for access to all 172 flashcards in this deck.
Unlock Deck
k this deck
11
If a competitive market operates perfectly, it relies on
A) the number of people buying goods.
B) the laws of supply and demand.
C) how many products can be produced for sale.
D) how much people are willing to pay for the products.
A) the number of people buying goods.
B) the laws of supply and demand.
C) how many products can be produced for sale.
D) how much people are willing to pay for the products.
Unlock Deck
Unlock for access to all 172 flashcards in this deck.
Unlock Deck
k this deck
12
A demand curve is defined as the relationship between
A) the price of a good and the quantity of that good that consumers are willing to buy.
B) the price of a good and the quantity of that good that producers are willing to sell.
C) the income of consumers and the quantity of a good that consumers are willing to buy.
D) the income of consumers and the quantity of a good that producers are willing to sell.
Unlock Deck
Unlock for access to all 172 flashcards in this deck.
Unlock Deck
k this deck
13
On the "demand side" of a market, consumers indicate what they are willing to buy, in what quantity and at what price.
Unlock Deck
Unlock for access to all 172 flashcards in this deck.
Unlock Deck
k this deck
14
The quantity demanded of a product increases as
A) consumer income rises.
B) the prices of other products fall.
C) the price of the product rises.
D) the price of the product falls.
A) consumer income rises.
B) the prices of other products fall.
C) the price of the product rises.
D) the price of the product falls.
Unlock Deck
Unlock for access to all 172 flashcards in this deck.
Unlock Deck
k this deck
15
A change in the quantity demanded of a product is the result of a change in
A) the price of the product.
B) the price of related goods.
C) consumer income.
D) the cost of producing the product.
A) the price of the product.
B) the price of related goods.
C) consumer income.
D) the cost of producing the product.
Unlock Deck
Unlock for access to all 172 flashcards in this deck.
Unlock Deck
k this deck
16
Refer to Figure 4.1, which shows Molly's and Ryan's individual demand curves for compact discs per month. Assuming Molly and Ryan are the only consumers in the market, if the market quantity demanded is 5, the price must be
A) $3.
B) $6.
C) $9.
D) $12.
Unlock Deck
Unlock for access to all 172 flashcards in this deck.
Unlock Deck
k this deck
17
Recall the Application about the decrease in taxes on cigarettes in several Canadian provinces in 1994 to answer the following question(s).
Recall the Application. The change in demand for cigarettes resulting from the decrease in taxes would normally create, ceteris paribus,
A) an increase in their supply.
B) a decrease in their supply.
C) an increase in their quantity supplied.
D) a decrease in their quantity supplied.
Recall the Application. The change in demand for cigarettes resulting from the decrease in taxes would normally create, ceteris paribus,
A) an increase in their supply.
B) a decrease in their supply.
C) an increase in their quantity supplied.
D) a decrease in their quantity supplied.
Unlock Deck
Unlock for access to all 172 flashcards in this deck.
Unlock Deck
k this deck
18
The law of demand states that there is a negative relationship between price and quantity demanded, ceteris paribus.
Unlock Deck
Unlock for access to all 172 flashcards in this deck.
Unlock Deck
k this deck
19
Refer to Figure 4.1, which shows Molly's and Ryan's individual demand curves for compact discs per month. Assuming Molly and Ryan are the only consumers in the market, what is the market quantity demanded at a price of $3?
A) 6
B) 9
C) 15
D) 20
Unlock Deck
Unlock for access to all 172 flashcards in this deck.
Unlock Deck
k this deck
20
Recall the Application about the decrease in taxes on cigarettes in several Canadian provinces in 1994 to answer the following question(s).
According to this Application, after the government deceased cigarette taxes in several Canadian provinces in 1994, the decrease in the price of cigarettes in these provinces
A) more than doubled the smoking rate.
B) created no noticeable change in the smoking rate.
C) increased the smoking rate by roughly 17 percent
D) was accompanied by a slight decrease in the rate of smoking.
Unlock Deck
Unlock for access to all 172 flashcards in this deck.
Unlock Deck
k this deck
21
Figure 4.6
David's Supply Schedule Celeste's Supply Schedule
Refer to Figure 4.6, which shows David's and Celeste's individual supply curves for flower arrangements per week. Assuming David and Celeste are the only producers in the market, if the market quantity supplied is 50, the price must be
A) $0.
B) $10.
C) between $10 and $20.
D) $30.
Unlock Deck
Unlock for access to all 172 flashcards in this deck.
Unlock Deck
k this deck
22
4.3 Market Equilibrium: Bringing Demand and Supply Together
Figure 4.2 illustrates the supply and demand for t-shirts. If the actual price of t-shirts is $7, there is an
A) excess demand of 8 t-shirts.
B) excess supply of 8 t-shirts.
C) excess demand of 10 t-shirts.
D) excess supply of 10 t-shirts.
Figure 4.2 illustrates the supply and demand for t-shirts. If the actual price of t-shirts is $7, there is an
A) excess demand of 8 t-shirts.
B) excess supply of 8 t-shirts.
C) excess demand of 10 t-shirts.
D) excess supply of 10 t-shirts.
Unlock Deck
Unlock for access to all 172 flashcards in this deck.
Unlock Deck
k this deck
23
Table 4.1
Quantity of Frozen Latte-On-A-Stick Supplied
Refer to Table 4.1, which shows Flo's and Rita's individual supply schedules for frozen latte-on-a-stick. Assuming Flo and Rita are the only suppliers in the market, what is the market quantity supplied at a price of $5?
A) 3
B) 12
C) 15
D) 27
Quantity of Frozen Latte-On-A-Stick Supplied
Refer to Table 4.1, which shows Flo's and Rita's individual supply schedules for frozen latte-on-a-stick. Assuming Flo and Rita are the only suppliers in the market, what is the market quantity supplied at a price of $5?
A) 3
B) 12
C) 15
D) 27
Unlock Deck
Unlock for access to all 172 flashcards in this deck.
Unlock Deck
k this deck
24
A change in quantity supplied of a product is the result of a change in
A) consumer income.
B) the state of production technology.
C) the cost of producing the product.
D) the price of the product.
A) consumer income.
B) the state of production technology.
C) the cost of producing the product.
D) the price of the product.
Unlock Deck
Unlock for access to all 172 flashcards in this deck.
Unlock Deck
k this deck
25
Figure 4.6
David's Supply Schedule Celeste's Supply Schedule
Refer to Figure 4.6, which shows David's and Celeste's individual supply curves for flower arrangements per week. Assuming David and Celeste are the only producers in the market, what is the market quantity supplied at a price of $30?
A) 200
B) 250
C) 300
D) 350
Unlock Deck
Unlock for access to all 172 flashcards in this deck.
Unlock Deck
k this deck
26
The Law of Supply states that
A) producers should only produce what they can sell.
B) producers should only sell the items when the price is right.
C) there is a positive relationship between price and quantity supplied, ceteris paribus.
D) producers are legally required to make necessary items available in the marketplace.
A) producers should only produce what they can sell.
B) producers should only sell the items when the price is right.
C) there is a positive relationship between price and quantity supplied, ceteris paribus.
D) producers are legally required to make necessary items available in the marketplace.
Unlock Deck
Unlock for access to all 172 flashcards in this deck.
Unlock Deck
k this deck
27
Recall the Application about the decrease in the price of wool in the 1990s to answer the following question(s). In the 1990s, the world price of wool decreased by about 30 percent and prices have remained relatively low since then. In 2012, an organization in New Zealand proposed that sheep shearing be added to the Commonwealth Games and the Olympics as a spectator sport in an effort to increase the awareness and the demand for wool.
Recall the Application. If the organization in New Zealand was successful in getting the Olympics to include sheep shearing as a spectator sport, and this helped to raise the world price of wool, the quantity of wool supplied would ________ because the market supply curve for wool is ________ sloped.
A) increase; positively
B) increase; negatively
C) decrease; positively
D) decrease; negatively
Unlock Deck
Unlock for access to all 172 flashcards in this deck.
Unlock Deck
k this deck
28
The law of supply states that there is a positive relationship between price and quantity supplied, ceteris paribus.
Unlock Deck
Unlock for access to all 172 flashcards in this deck.
Unlock Deck
k this deck
29
Table 4.1
Quantity of Frozen Latte-On-A-Stick Supplied
Refer to Table 4.1, which shows Flo's and Rita's individual supply schedules for frozen latte-on-a-stick. Assuming Flo and Rita are the only suppliers in the market, what is the market quantity supplied at a price of $2?
A) 0
B) 2
C) 3
D) 5
Quantity of Frozen Latte-On-A-Stick Supplied
Refer to Table 4.1, which shows Flo's and Rita's individual supply schedules for frozen latte-on-a-stick. Assuming Flo and Rita are the only suppliers in the market, what is the market quantity supplied at a price of $2?
A) 0
B) 2
C) 3
D) 5
Unlock Deck
Unlock for access to all 172 flashcards in this deck.
Unlock Deck
k this deck
30
Recall the Application about the decrease in the price of wool in the 1990s to answer the following question(s). In the 1990s, the world price of wool decreased by about 30 percent and prices have remained relatively low since then. In 2012, an organization in New Zealand proposed that sheep shearing be added to the Commonwealth Games and the Olympics as a spectator sport in an effort to increase the awareness and the demand for wool.
Recall the Application. The decrease in the price of wool would be reflected by a movement ________ on the market supply curve for wool.
A) down and to the right
B) down and to the left
C) up and to the right
D) up and to the left
Recall the Application. The decrease in the price of wool would be reflected by a movement ________ on the market supply curve for wool.
A) down and to the right
B) down and to the left
C) up and to the right
D) up and to the left
Unlock Deck
Unlock for access to all 172 flashcards in this deck.
Unlock Deck
k this deck
31
The market demand curve shows the relationship between the price and the quantity demanded by all consumers, everything else being equal.
Unlock Deck
Unlock for access to all 172 flashcards in this deck.
Unlock Deck
k this deck
32
A supply curve is defined as the relationship between
A) the price of a good and the quantity that consumers are willing to buy.
B) the price of a good and the quantity that producers are willing to sell.
C) the income of consumers and the quantity of a product that consumers are willing to buy.
D) the income of consumers and the quantity of a product that producers are willing to sell.
Unlock Deck
Unlock for access to all 172 flashcards in this deck.
Unlock Deck
k this deck
33
Figure 4.6
David's Supply Schedule Celeste's Supply Schedule
Refer to Figure 4.6, which shows David's and Celeste's individual supply curves for flower arrangements per week. Assuming David and Celeste are the only producers in the market, if the market quantity supplied is 350, the price must be
A) $10.
B) $20.
C) $30.
D) $40.
Unlock Deck
Unlock for access to all 172 flashcards in this deck.
Unlock Deck
k this deck
34
Figure 4.6
David's Supply Schedule Celeste's Supply Schedule
Refer to Figure 4.6, which shows David's and Celeste's individual supply curves for flower arrangements per week. Assuming David and Celeste are the only producers in the market, what is the market quantity supplied at a price of $20?
A) 0
B) 100
C) 150
D) 200
Unlock Deck
Unlock for access to all 172 flashcards in this deck.
Unlock Deck
k this deck
35
Table 4.1
Quantity of Frozen Latte-On-A-Stick Supplied
Refer to Table 4.1, which shows Flo's and Rita's individual supply schedules for frozen latte-on-a-stick. Assuming Flo and Rita are the only suppliers in the market, if the market quantity supplied is 3, the price must be
A) $0.
B) $2.
C) $4.
D) $5.
Quantity of Frozen Latte-On-A-Stick Supplied
Refer to Table 4.1, which shows Flo's and Rita's individual supply schedules for frozen latte-on-a-stick. Assuming Flo and Rita are the only suppliers in the market, if the market quantity supplied is 3, the price must be
A) $0.
B) $2.
C) $4.
D) $5.
Unlock Deck
Unlock for access to all 172 flashcards in this deck.
Unlock Deck
k this deck
36
Recall the Application about the decrease in the price of wool in the 1990s to answer the following question(s). In the 1990s, the world price of wool decreased by about 30 percent and prices have remained relatively low since then. In 2012, an organization in New Zealand proposed that sheep shearing be added to the Commonwealth Games and the Olympics as a spectator sport in an effort to increase the awareness and the demand for wool.
Recall the Application. As the world price of wool decreased, the quantity of wool supplied by individual ranchers would ________, and the quantity supplied in the whole market would ________.
A) increase; increase
B) increase; decrease
C) decrease; decrease
D) decrease; increase
Recall the Application. As the world price of wool decreased, the quantity of wool supplied by individual ranchers would ________, and the quantity supplied in the whole market would ________.
A) increase; increase
B) increase; decrease
C) decrease; decrease
D) decrease; increase
Unlock Deck
Unlock for access to all 172 flashcards in this deck.
Unlock Deck
k this deck
37
Table 4.1
Quantity of Frozen Latte-On-A-Stick Supplied
Refer to Table 4.1, which shows Flo's and Rita's individual supply schedules for frozen latte-on-a-stick. Assuming Flo and Rita are the only suppliers in the market, if the market quantity supplied is 18, the price must be
A) $2.
B) $3.
C) $4.
D) $5.
Quantity of Frozen Latte-On-A-Stick Supplied
Refer to Table 4.1, which shows Flo's and Rita's individual supply schedules for frozen latte-on-a-stick. Assuming Flo and Rita are the only suppliers in the market, if the market quantity supplied is 18, the price must be
A) $2.
B) $3.
C) $4.
D) $5.
Unlock Deck
Unlock for access to all 172 flashcards in this deck.
Unlock Deck
k this deck
38
Table 4.1
Quantity of Frozen Latte-On-A-Stick Supplied
Refer to Table 4.1, which shows Flo's and Rita's individual supply schedules for frozen latte-on-a-stick. Assuming Flo and Rita are the only suppliers in the market, what is the market quantity supplied at a price of $1?
A) 0
B) 1
C) 3
D) 5
Quantity of Frozen Latte-On-A-Stick Supplied
Refer to Table 4.1, which shows Flo's and Rita's individual supply schedules for frozen latte-on-a-stick. Assuming Flo and Rita are the only suppliers in the market, what is the market quantity supplied at a price of $1?
A) 0
B) 1
C) 3
D) 5
Unlock Deck
Unlock for access to all 172 flashcards in this deck.
Unlock Deck
k this deck
39
As the price of a product rises, the quantity supplied decreases.
Unlock Deck
Unlock for access to all 172 flashcards in this deck.
Unlock Deck
k this deck
40
On the "supply side" of a market, producers indicate to consumers what they are willing to sell, in what quantity and at what price.
Unlock Deck
Unlock for access to all 172 flashcards in this deck.
Unlock Deck
k this deck
41
Excess demand in an unregulated market will cause the price of a product to fall.
Unlock Deck
Unlock for access to all 172 flashcards in this deck.
Unlock Deck
k this deck
42
Governments sometime create an excess demand for a product by setting a maximum price that is less than the equilibrium price, resulting in a permanent excess demand for the product. This is known as a price floor.
Unlock Deck
Unlock for access to all 172 flashcards in this deck.
Unlock Deck
k this deck
43
Recall the Application about the policies used by the European Union to support the agricultural sectors of is member countries to answer the following question(s).
According to this Application, the policies used by the European Union to support the agricultural sectors of its member countries created excess supply. Excess supply can be generated if a government establishes a
A) price ceiling below the market equilibrium price.
B) price ceiling above the market equilibrium price.
C) price floor below the market equilibrium price.
D) price floor above the market equilibrium price.
Unlock Deck
Unlock for access to all 172 flashcards in this deck.
Unlock Deck
k this deck
44
Suppose that the quantity of cars supplied exceeds the quantity of cars demanded. We would expect that
A) the price of cars will increase.
B) the price of cars will decrease.
C) the supply will increase (supply will shift to the right) to meet the demand.
D) the demand will decrease (demand will shift to the left) to meet the supply.
A) the price of cars will increase.
B) the price of cars will decrease.
C) the supply will increase (supply will shift to the right) to meet the demand.
D) the demand will decrease (demand will shift to the left) to meet the supply.
Unlock Deck
Unlock for access to all 172 flashcards in this deck.
Unlock Deck
k this deck
45
4.3 Market Equilibrium: Bringing Demand and Supply Together
Figure 4.2 illustrates the supply and demand for t-shirts. If the actual price of t-shirts is $7, we would expect that
A) demand will decrease until quantity demanded equals quantity supplied.
B) supply will increase until quantity demanded equals quantity supplied.
C) price will increase until quantity demanded equals quantity supplied.
D) there will be no change in the price since the market is in equilibrium.
Unlock Deck
Unlock for access to all 172 flashcards in this deck.
Unlock Deck
k this deck
46
Suppose that the quantity of cars demanded exceeds the quantity of cars supplied. We would expect that
A) the price of cars will increase.
B) the price of cars will decrease.
C) the supply will increase (supply will shift to the right) to meet the demand.
D) the demand will decrease (demand will shift to the left) to meet the supply.
A) the price of cars will increase.
B) the price of cars will decrease.
C) the supply will increase (supply will shift to the right) to meet the demand.
D) the demand will decrease (demand will shift to the left) to meet the supply.
Unlock Deck
Unlock for access to all 172 flashcards in this deck.
Unlock Deck
k this deck
47
Excess supply in an unregulated market will cause the price of a product to fall.
Unlock Deck
Unlock for access to all 172 flashcards in this deck.
Unlock Deck
k this deck
48
A government sometimes creates an excess supply of a product by setting a minimum price at which the product may be sold to consumers. This is sometimes called a
A) price ceiling.
B) price floor.
C) tax.
D) subsidy.
A) price ceiling.
B) price floor.
C) tax.
D) subsidy.
Unlock Deck
Unlock for access to all 172 flashcards in this deck.
Unlock Deck
k this deck
49
4.3 Market Equilibrium: Bringing Demand and Supply Together
Figure 4.2 illustrates the supply and demand for t-shirts. If the actual price of t-shirts is $10, we would expect that
A) demand will decrease until quantity demanded equals quantity supplied.
B) supply will increase until quantity demanded equals quantity supplied.
C) price will increase until quantity demanded equals quantity supplied.
D) there will be no change in the price since the market is in equilibrium.
Unlock Deck
Unlock for access to all 172 flashcards in this deck.
Unlock Deck
k this deck
50
Recall the Application about the policies used by the European Union to support the agricultural sectors of is member countries to answer the following question(s).
According to this Application, in recent years the European Union has reformed its agriculture policies by reducing or eliminating minimum prices. Ceteris paribus, these policy reforms would ________ excess supply by ________ prices.
A) reduce; raising
B) reduce; lowering
C) increase; raising
D) increase; lowering
Unlock Deck
Unlock for access to all 172 flashcards in this deck.
Unlock Deck
k this deck
51
4.3 Market Equilibrium: Bringing Demand and Supply Together
Figure 4.2 illustrates the supply and demand for t-shirts. If the actual price of t-shirts is $15, there is an
A) excess demand of 8 t-shirts.
B) excess supply of 8 t-shirts.
C) excess demand of 10 t-shirts.
D) excess supply of 10 t-shirts.
Figure 4.2 illustrates the supply and demand for t-shirts. If the actual price of t-shirts is $15, there is an
A) excess demand of 8 t-shirts.
B) excess supply of 8 t-shirts.
C) excess demand of 10 t-shirts.
D) excess supply of 10 t-shirts.
Unlock Deck
Unlock for access to all 172 flashcards in this deck.
Unlock Deck
k this deck
52
When consumers are willing to buy more than producers are willing to sell
A) there is excess supply of the product in the market.
B) there is excess demand for the product in the market.
C) the market is in equilibrium.
D) the demand curve will shift until the quantity supplied equals the quantity demanded.
A) there is excess supply of the product in the market.
B) there is excess demand for the product in the market.
C) the market is in equilibrium.
D) the demand curve will shift until the quantity supplied equals the quantity demanded.
Unlock Deck
Unlock for access to all 172 flashcards in this deck.
Unlock Deck
k this deck
53
The government sometimes creates an excess demand for a product by setting a maximum price at which the product may be sold to consumers. This is sometimes called a
A) price ceiling.
B) price floor.
C) tax.
D) subsidy.
A) price ceiling.
B) price floor.
C) tax.
D) subsidy.
Unlock Deck
Unlock for access to all 172 flashcards in this deck.
Unlock Deck
k this deck
54
In the event of excess supply in the coffee market
A) the price of coffee will increase.
B) the price of coffee will decrease.
C) the supply of coffee will decrease (supply will shift to the left) to meet the demand.
D) the demand for coffee will increase (demand will shift to the right) to meet the supply.
A) the price of coffee will increase.
B) the price of coffee will decrease.
C) the supply of coffee will decrease (supply will shift to the left) to meet the demand.
D) the demand for coffee will increase (demand will shift to the right) to meet the supply.
Unlock Deck
Unlock for access to all 172 flashcards in this deck.
Unlock Deck
k this deck
55
4.3 Market Equilibrium: Bringing Demand and Supply Together
Figure 4.2 illustrates the supply and demand for t-shirts. If the actual price of t-shirts is $15, we would expect that
A) demand will decrease until quantity demanded equals quantity supplied.
B) supply will increase until quantity demanded equals quantity supplied.
C) price will decrease until quantity demanded equals quantity supplied.
D) there will be no change in the price since the market is in equilibrium.
Unlock Deck
Unlock for access to all 172 flashcards in this deck.
Unlock Deck
k this deck
56
What happens if the price of a product is below the equilibrium price?
A) The buyers will stop purchasing a "cheap" product.
B) The producer will lower the price to sell more product.
C) There will be an excess demand for the product.
D) There will be a surplus of the product.
A) The buyers will stop purchasing a "cheap" product.
B) The producer will lower the price to sell more product.
C) There will be an excess demand for the product.
D) There will be a surplus of the product.
Unlock Deck
Unlock for access to all 172 flashcards in this deck.
Unlock Deck
k this deck
57
Suppose that a market for a product is in equilibrium at a price of $5 per unit. At any price above $5 per unit
A) there will be an excess demand for the product.
B) there will be an excess supply of the product.
C) the quantity supplied of the product will be less than the quantity demanded of that product.
D) there will be a shortage of that product.
A) there will be an excess demand for the product.
B) there will be an excess supply of the product.
C) the quantity supplied of the product will be less than the quantity demanded of that product.
D) there will be a shortage of that product.
Unlock Deck
Unlock for access to all 172 flashcards in this deck.
Unlock Deck
k this deck
58
Recall the Application about the policies used by the European Union to support the agricultural sectors of is member countries to answer the following question(s).
According to this Application, the policies used by the European Union to support the agricultural sectors of its member countries created excess supply. This would occur if these policies set a ________ price which was ________ the market equilibrium price.
A) maximum; above
B) maximum; below
C) minimum; above
D) minimum; below
Unlock Deck
Unlock for access to all 172 flashcards in this deck.
Unlock Deck
k this deck
59
If the quantity of a product demanded is greater than the quantity of a product supplied, there is pressure in the market to push the price downward.
Unlock Deck
Unlock for access to all 172 flashcards in this deck.
Unlock Deck
k this deck
60
Suppose that a market for a product is in equilibrium at a price of $3 per unit. At any price below $3 per unit
A) there will be an excess demand for the product.
B) there will be an excess supply of the product.
C) the quantity demanded of the product will be less than the quantity supplied of that product.
D) there will be a surplus of that product.
A) there will be an excess demand for the product.
B) there will be an excess supply of the product.
C) the quantity demanded of the product will be less than the quantity supplied of that product.
D) there will be a surplus of that product.
Unlock Deck
Unlock for access to all 172 flashcards in this deck.
Unlock Deck
k this deck
61
4.4 Market Effects of Changes in Demand
Figure 4.3 illustrates the demand for tacos. Assume tacos are an inferior good. An increase in income would bring about a movement from
A) point a to point b.
B) point c to point b.
C) D2 to D1.
D) D0 to D1.
Figure 4.3 illustrates the demand for tacos. Assume tacos are an inferior good. An increase in income would bring about a movement from
A) point a to point b.
B) point c to point b.
C) D2 to D1.
D) D0 to D1.
Unlock Deck
Unlock for access to all 172 flashcards in this deck.
Unlock Deck
k this deck
62
Governments sometime create an excess supply of a product by setting a minimum price that is greater than the equilibrium price, resulting in a permanent excess supply of the product. This is known as a price ceiling.
Unlock Deck
Unlock for access to all 172 flashcards in this deck.
Unlock Deck
k this deck
63
4.4 Market Effects of Changes in Demand
Figure 4.3 illustrates the demand for tacos. A successful advertising campaign to sell tacos would bring about a movement from
A) point a to point b.
B) point c to point b.
C) D2 to D1.
D) D0 to D1.
Figure 4.3 illustrates the demand for tacos. A successful advertising campaign to sell tacos would bring about a movement from
A) point a to point b.
B) point c to point b.
C) D2 to D1.
D) D0 to D1.
Unlock Deck
Unlock for access to all 172 flashcards in this deck.
Unlock Deck
k this deck
64
4.4 Market Effects of Changes in Demand
Figure 4.3 illustrates the demand for tacos. Assume that tacos and beer are complements. An increase in the price of beer would bring about a movement from
A) point a to point b.
B) point c to point b.
C) D2 to D1.
D) D0 to D2.
Figure 4.3 illustrates the demand for tacos. Assume that tacos and beer are complements. An increase in the price of beer would bring about a movement from
A) point a to point b.
B) point c to point b.
C) D2 to D1.
D) D0 to D2.
Unlock Deck
Unlock for access to all 172 flashcards in this deck.
Unlock Deck
k this deck
65
4.4 Market Effects of Changes in Demand
Figure 4.3 illustrates the demand for tacos. An increase in the demand for tacos is represented by the movement from
A) point a to point b.
B) point c to point b.
C) D2 to D1.
D) D0 to D1.
Figure 4.3 illustrates the demand for tacos. An increase in the demand for tacos is represented by the movement from
A) point a to point b.
B) point c to point b.
C) D2 to D1.
D) D0 to D1.
Unlock Deck
Unlock for access to all 172 flashcards in this deck.
Unlock Deck
k this deck
66
Suppose that consumers expect that the price of a product will increase in the future. The result is that
A) the current demand for the product increases.
B) the current demand for the product decreases.
C) the current supply of the product increases.
D) the current supply of the product decreases.
A) the current demand for the product increases.
B) the current demand for the product decreases.
C) the current supply of the product increases.
D) the current supply of the product decreases.
Unlock Deck
Unlock for access to all 172 flashcards in this deck.
Unlock Deck
k this deck
67
4.4 Market Effects of Changes in Demand
Figure 4.3 illustrates the demand for tacos. A decrease in the demand for tacos is represented by the movement from
A) point a to point b.
B) point c to point b.
C) D2 to D1.
D) D0 to D1.
Figure 4.3 illustrates the demand for tacos. A decrease in the demand for tacos is represented by the movement from
A) point a to point b.
B) point c to point b.
C) D2 to D1.
D) D0 to D1.
Unlock Deck
Unlock for access to all 172 flashcards in this deck.
Unlock Deck
k this deck
68
4.4 Market Effects of Changes in Demand
Figure 4.3 illustrates the demand for tacos. A decrease in price of tacos would bring about a movement from
A) point a to point c.
B) point c to point a.
C) D2 to D0.
D) D0 to D2.
Figure 4.3 illustrates the demand for tacos. A decrease in price of tacos would bring about a movement from
A) point a to point c.
B) point c to point a.
C) D2 to D0.
D) D0 to D2.
Unlock Deck
Unlock for access to all 172 flashcards in this deck.
Unlock Deck
k this deck
69
Assume that tortilla chips and salsa are complements. When the price of tortilla chips decreases
A) the demand for salsa increases.
B) the demand for salsa decreases.
C) the supply of salsa decreases.
D) the demand for tortilla chips decreases.
A) the demand for salsa increases.
B) the demand for salsa decreases.
C) the supply of salsa decreases.
D) the demand for tortilla chips decreases.
Unlock Deck
Unlock for access to all 172 flashcards in this deck.
Unlock Deck
k this deck
70
4.4 Market Effects of Changes in Demand
Figure 4.3 illustrates the demand for tacos. An increase in price of tacos would bring about a movement from
A) point a to point c.
B) point c to point a.
C) D2 to D0.
D) D0 to D1.
Figure 4.3 illustrates the demand for tacos. An increase in price of tacos would bring about a movement from
A) point a to point c.
B) point c to point a.
C) D2 to D0.
D) D0 to D1.
Unlock Deck
Unlock for access to all 172 flashcards in this deck.
Unlock Deck
k this deck
71
When the price of almonds falls
A) the demand for almonds decreases, ceteris paribus.
B) the demand for almonds increases, ceteris paribus.
C) the quantity of almonds demanded decreases, ceteris paribus.
D) the quantity of almonds demanded increases, ceteris paribus.
A) the demand for almonds decreases, ceteris paribus.
B) the demand for almonds increases, ceteris paribus.
C) the quantity of almonds demanded decreases, ceteris paribus.
D) the quantity of almonds demanded increases, ceteris paribus.
Unlock Deck
Unlock for access to all 172 flashcards in this deck.
Unlock Deck
k this deck
72
Assume that coffee and tea are substitutes. When the price of coffee increases
A) the demand for tea decreases.
B) the demand for tea increases.
C) the supply of tea increases.
D) the supply of tea decreases.
A) the demand for tea decreases.
B) the demand for tea increases.
C) the supply of tea increases.
D) the supply of tea decreases.
Unlock Deck
Unlock for access to all 172 flashcards in this deck.
Unlock Deck
k this deck
73
4.4 Market Effects of Changes in Demand
Figure 4.3 illustrates the demand for tacos. Assume that tacos and burritos are substitutes. A decrease in the price of burritos would bring about a movement from
A) point a to point c.
B) point c to point b.
C) D2 to D0.
D) D1 to D2.
Figure 4.3 illustrates the demand for tacos. Assume that tacos and burritos are substitutes. A decrease in the price of burritos would bring about a movement from
A) point a to point c.
B) point c to point b.
C) D2 to D0.
D) D1 to D2.
Unlock Deck
Unlock for access to all 172 flashcards in this deck.
Unlock Deck
k this deck
74
Landon demands more sushi as his income increases. From this we can conclude that, for Landon,
A) sushi is a normal good.
B) sushi is an inferior good.
C) sushi is a complementary good.
D) sushi is a substitute good.
A) sushi is a normal good.
B) sushi is an inferior good.
C) sushi is a complementary good.
D) sushi is a substitute good.
Unlock Deck
Unlock for access to all 172 flashcards in this deck.
Unlock Deck
k this deck
75
4.4 Market Effects of Changes in Demand
Figure 4.3 illustrates the demand for tacos. An increase in the number of consumers in the market would bring about a movement from
A) point a to point b.
B) point c to point a.
C) D2 to D1.
D) D0 to D2.
Figure 4.3 illustrates the demand for tacos. An increase in the number of consumers in the market would bring about a movement from
A) point a to point b.
B) point c to point a.
C) D2 to D1.
D) D0 to D2.
Unlock Deck
Unlock for access to all 172 flashcards in this deck.
Unlock Deck
k this deck
76
Suppose that a product benefits from a successful advertising campaign. The result is that
A) the demand for the product increases.
B) the demand for the product decreases.
C) the supply of the product increases.
D) the supply of the product decreases.
A) the demand for the product increases.
B) the demand for the product decreases.
C) the supply of the product increases.
D) the supply of the product decreases.
Unlock Deck
Unlock for access to all 172 flashcards in this deck.
Unlock Deck
k this deck
77
4.4 Market Effects of Changes in Demand
Figure 4.3 illustrates the demand for tacos. Assume tacos are a normal good. An increase in income would bring about a movement from
A) point a to point b.
B) point c to point b.
C) D2 to D1.
D) D0 to D1.
Figure 4.3 illustrates the demand for tacos. Assume tacos are a normal good. An increase in income would bring about a movement from
A) point a to point b.
B) point c to point b.
C) D2 to D1.
D) D0 to D1.
Unlock Deck
Unlock for access to all 172 flashcards in this deck.
Unlock Deck
k this deck
78
When the price of apples goes up
A) the demand for apples will decrease, ceteris paribus.
B) the demand for apples will increase, ceteris paribus.
C) the quantity of apples demanded will decrease, ceteris paribus.
D) the quantity of apples demanded will increase, ceteris paribus.
A) the demand for apples will decrease, ceteris paribus.
B) the demand for apples will increase, ceteris paribus.
C) the quantity of apples demanded will decrease, ceteris paribus.
D) the quantity of apples demanded will increase, ceteris paribus.
Unlock Deck
Unlock for access to all 172 flashcards in this deck.
Unlock Deck
k this deck
79
4.4 Market Effects of Changes in Demand
Figure 4.3 illustrates the demand for tacos. If people expect the price of tacos to decrease in the near future, this would most likely bring about a movement from
A) point a to point b.
B) point c to point a.
C) D2 to D0.
D) D0 to D1.
Figure 4.3 illustrates the demand for tacos. If people expect the price of tacos to decrease in the near future, this would most likely bring about a movement from
A) point a to point b.
B) point c to point a.
C) D2 to D0.
D) D0 to D1.
Unlock Deck
Unlock for access to all 172 flashcards in this deck.
Unlock Deck
k this deck
80
4.4 Market Effects of Changes in Demand
Figure 4.3 illustrates the demand for tacos. Assume that tacos and beer are complements. A decrease in the price of beer would bring about a movement from
A) point a to point c.
B) point c to point a.
C) D2 to D0.
D) D0 to D2.
Figure 4.3 illustrates the demand for tacos. Assume that tacos and beer are complements. A decrease in the price of beer would bring about a movement from
A) point a to point c.
B) point c to point a.
C) D2 to D0.
D) D0 to D2.
Unlock Deck
Unlock for access to all 172 flashcards in this deck.
Unlock Deck
k this deck
Unlock Deck
Unlock for access to all 172 flashcards in this deck.


