Deck 11: Qualitative Research and Analysis
Full screen (f)
Question
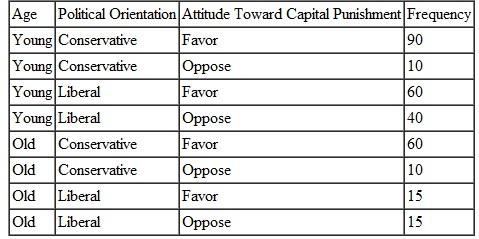
Using the data in the accompanying table, construct and interpret tables showing:
a. The bivariate relationship between age and attitude toward capital punishment
b. The bivariate relationship between political orientation and attitude toward capital punishment
c. The multivariate relationship linking age, political orientation, and attitude toward capital punishment
a. The bivariate relationship between age and attitude toward capital punishment
b. The bivariate relationship between political orientation and attitude toward capital punishment
c. The multivariate relationship linking age, political orientation, and attitude toward capital punishment
Question
Here are our answers to the question about statistical significance relating to Figure: Fifteen years show no significant change inviolent victimization; significant increases are shown for three years; violent victimization declines significantly in five years. The increase from 1976 to 1977 and the decrease from 1979 to 1980 are close; notice the edge of the 95 percent confidence interval borders the nochange line. We recommend that you read the Maltz and Zawitz publication. It's listed in the references and can be downloaded from the Bureau of Justice Statistics website at http://bjs.ojp.usdoj.gov/content/pub/pdf/dvctue.pdf.
Figure Point Estimates and Confidence Intervals
Source: Maltz and Zawitz (1998, 4).
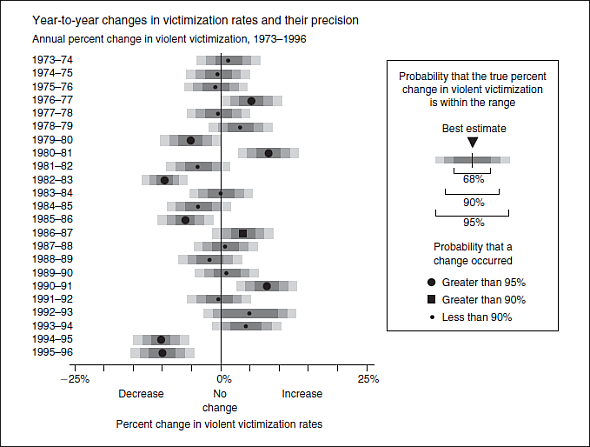
Figure Point Estimates and Confidence Intervals
Source: Maltz and Zawitz (1998, 4).

Unlock Deck
Sign up to unlock the cards in this deck!
Unlock Deck
Unlock Deck
1/2
Play
Full screen (f)
Deck 11: Qualitative Research and Analysis
Using the data in the accompanying table, construct and interpret tables showing:
a. The bivariate relationship between age and attitude toward capital punishment
b. The bivariate relationship between political orientation and attitude toward capital punishment
c. The multivariate relationship linking age, political orientation, and attitude toward capital punishment
a. The bivariate relationship between age and attitude toward capital punishment
b. The bivariate relationship between political orientation and attitude toward capital punishment
c. The multivariate relationship linking age, political orientation, and attitude toward capital punishment
Bivariate analysis:
Bivariate analysis is method to find relationship between two variables. Hence, this analysis helps to identify the nature of relationship between two different variables. It is the most useful method in the criminal justice system.
For calculate relationship between the variables:
 a)
a)
Compute percentage favorable attitude of young towards capital punishment:
It I given that total frequency of young favorable attitude towards capital punishment is 60 from liberal and 90 from conservative. Hence, the total is 150 and total frequency of young is 200.
The percentage of favorable attitude of young towards capital punishment is frequency of selected attributes divided by total frequency.
 Hence, the percentage of favorable attitude of young over capital punishment is
 .It means the percentage unfavorable attitude young over capital punishment is 25%.
Compute percentage favorable attitude of old towards capital punishment:
It I given that total frequency of old favorable attitude towards capital punishment is 15 from liberal and 70 from conservative. Hence, the total is 75 and total frequency for old is 200.
The percentage of favorable attitude of young towards capital punishment is frequency of selected attributes divided by total frequency.
 Hence, the percentage favorable attitude of old over capital punishment is
 . It means the percentage unfavorable attitude old over capital punishment is 25%.
Compute bivariate relationship between age and attitude towards capital punishment:
Above calculation shows 75% of both young and old people reveal that their attitude over capital punishment is favorable. However, 25% of both young and old people are against to the capital punishment. There is no important difference between attitudes of youngsters as well as old behind capital punishment.
b)
Compute percentage people are liberal and favorable attitude towards capital punishment:
It I given that total frequency of people liberal and favorable attitude towards capital punishment is 60 from young and 15 from old. Hence, the total is 75 and total frequency of liberal is 130.
The percentage of favorable attitude of young towards capital punishment is frequency of selected attributes divided by total frequency.
 Hence, the percentage people are liberal with favorable attitude over capital punishment is
 . It means the percentage people are liberal with opposite attitude is 42.308%.
Compute percentage people are conservative and favorable attitude towards capital punishment:
It I given that total frequency of people conservative and favorable attitude towards capital punishment is 90 from young and 60 from old. Hence, the total is 150 and total frequency of conservative is 170.
The percentage of favorable attitude of young towards capital punishment is frequency of selected attributes divided by total frequency.
 Hence, the percentage people are conservative with favorable attitude over capital punishment is
 . It means the percentage people are conservative with opposite attitude is 11.765%.
Compute bivariate relationship between political orientation and attitude towards capital punishment:
The above results show, 57.692% of the people are liberal in political orientation and hold favorable attitude towards capital punishment. Same time 88.235% of the people is conservative and hold favorable attitude towards capital punishment.
Hence, there is significant difference between conservative people and liberal people in terms of their attitude towards capital punishment. Specifically, conservative people are more supporting capital punishment than liberal.
c)
Compute multivariate relationship between age, political orientation, and attitude toward capital punishment:
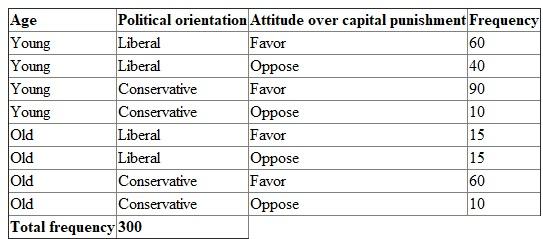
The below given table is show frequency of age, political orientation, and attitude over capital punishment over capital punishment. Total frequency of all the attributes is 300.
 Calculation has been using excel function. The formula for excel function is given below:
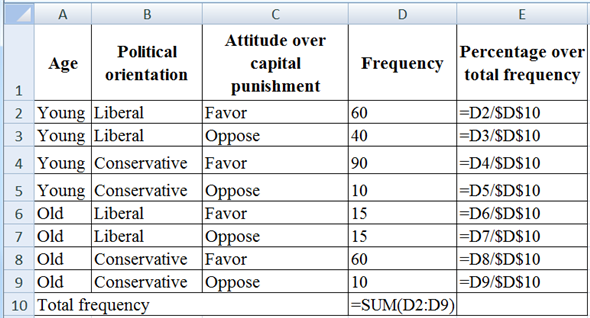 The percentage over total frequency is given below:
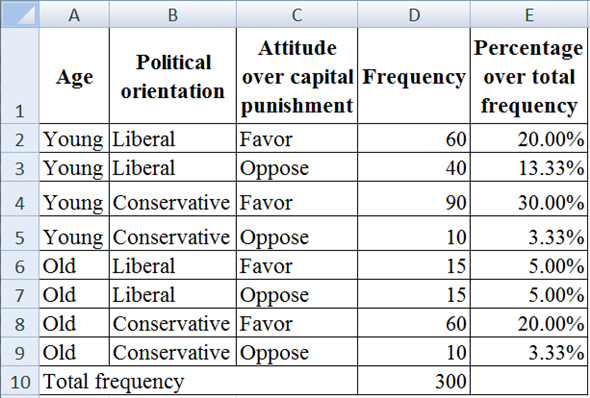 Finding:
While consider the above table, the percentage attitude of each particular group of people are different from most of the attitude of others. However, some relationship is visible in this table. They are; young liberal with favorable attitude towards the capital punishment has the relationship with old conservative people along with favorable attitude towards capital punishment.
Similarly, young conservative people having opposite attitude over capital punishment have relationship with old conservative people with opposite attitude over capital punishment. These are the relationship visible with the above table.
Bivariate analysis is method to find relationship between two variables. Hence, this analysis helps to identify the nature of relationship between two different variables. It is the most useful method in the criminal justice system.
For calculate relationship between the variables:
a)Compute percentage favorable attitude of young towards capital punishment:
It I given that total frequency of young favorable attitude towards capital punishment is 60 from liberal and 90 from conservative. Hence, the total is 150 and total frequency of young is 200.
The percentage of favorable attitude of young towards capital punishment is frequency of selected attributes divided by total frequency.
Hence, the percentage of favorable attitude of young over capital punishment is .It means the percentage unfavorable attitude young over capital punishment is 25%.Compute percentage favorable attitude of old towards capital punishment:
It I given that total frequency of old favorable attitude towards capital punishment is 15 from liberal and 70 from conservative. Hence, the total is 75 and total frequency for old is 200.
The percentage of favorable attitude of young towards capital punishment is frequency of selected attributes divided by total frequency.
Hence, the percentage favorable attitude of old over capital punishment is . It means the percentage unfavorable attitude old over capital punishment is 25%.Compute bivariate relationship between age and attitude towards capital punishment:
Above calculation shows 75% of both young and old people reveal that their attitude over capital punishment is favorable. However, 25% of both young and old people are against to the capital punishment. There is no important difference between attitudes of youngsters as well as old behind capital punishment.
b)
Compute percentage people are liberal and favorable attitude towards capital punishment:
It I given that total frequency of people liberal and favorable attitude towards capital punishment is 60 from young and 15 from old. Hence, the total is 75 and total frequency of liberal is 130.
The percentage of favorable attitude of young towards capital punishment is frequency of selected attributes divided by total frequency.
Hence, the percentage people are liberal with favorable attitude over capital punishment is . It means the percentage people are liberal with opposite attitude is 42.308%. Compute percentage people are conservative and favorable attitude towards capital punishment:
It I given that total frequency of people conservative and favorable attitude towards capital punishment is 90 from young and 60 from old. Hence, the total is 150 and total frequency of conservative is 170.
The percentage of favorable attitude of young towards capital punishment is frequency of selected attributes divided by total frequency.
Hence, the percentage people are conservative with favorable attitude over capital punishment is . It means the percentage people are conservative with opposite attitude is 11.765%.Compute bivariate relationship between political orientation and attitude towards capital punishment:
The above results show, 57.692% of the people are liberal in political orientation and hold favorable attitude towards capital punishment. Same time 88.235% of the people is conservative and hold favorable attitude towards capital punishment.
Hence, there is significant difference between conservative people and liberal people in terms of their attitude towards capital punishment. Specifically, conservative people are more supporting capital punishment than liberal.
c)
Compute multivariate relationship between age, political orientation, and attitude toward capital punishment:
The below given table is show frequency of age, political orientation, and attitude over capital punishment over capital punishment. Total frequency of all the attributes is 300.
Calculation has been using excel function. The formula for excel function is given below: The percentage over total frequency is given below: Finding: While consider the above table, the percentage attitude of each particular group of people are different from most of the attitude of others. However, some relationship is visible in this table. They are; young liberal with favorable attitude towards the capital punishment has the relationship with old conservative people along with favorable attitude towards capital punishment.
Similarly, young conservative people having opposite attitude over capital punishment have relationship with old conservative people with opposite attitude over capital punishment. These are the relationship visible with the above table.
Here are our answers to the question about statistical significance relating to Figure: Fifteen years show no significant change inviolent victimization; significant increases are shown for three years; violent victimization declines significantly in five years. The increase from 1976 to 1977 and the decrease from 1979 to 1980 are close; notice the edge of the 95 percent confidence interval borders the nochange line. We recommend that you read the Maltz and Zawitz publication. It's listed in the references and can be downloaded from the Bureau of Justice Statistics website at http://bjs.ojp.usdoj.gov/content/pub/pdf/dvctue.pdf.
Figure Point Estimates and Confidence Intervals
Source: Maltz and Zawitz (1998, 4).
Figure Point Estimates and Confidence Intervals
Source: Maltz and Zawitz (1998, 4).
NO ANSWER
Unlock Deck
Unlock for access to all 2 flashcards in this deck.


