Deck 10: Chi-Square Tests and the F-Distribution
Full screen (f)
Question
A sociologist believes that the levels of educational attainment of homeless persons are not uniformly
distributed. To test this claim, you randomly survey 100 homeless persons and record the educational
attainment of each. The results are shown in the following table. Find the critical value χ to test the
sociologistʹs claim. Use = 0.10.
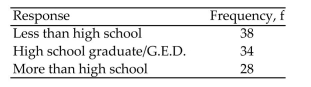
distributed. To test this claim, you randomly survey 100 homeless persons and record the educational
attainment of each. The results are shown in the following table. Find the critical value χ
to test thesociologistʹs claim. Use
= 0.10. Question
Many track runners believe that they have a better chance of winning if they start in the inside lane that is closest to the field. For the data below, the lane closest to the field is Lane 1, the next lane is Lane 2, and so on
Until the outermost lane, Lane 6. The data lists the number of wins for track runners in the different starting
Positions. Calculate the chi-square test statistic χ to test the claim that the number of wins is uniformly
Distributed across the different starting positions. The results are based on 240 wins.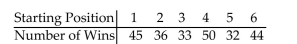
A)6.750
B)9.326
C)12.592
D)15.541
Until the outermost lane, Lane 6. The data lists the number of wins for track runners in the different starting
Positions. Calculate the chi-square test statistic χ
to test the claim that the number of wins is uniformlyDistributed across the different starting positions. The results are based on 240 wins.
A)6.750
B)9.326
C)12.592
D)15.541
Question
The frequency distribution shows the ages for a sample of 100 employees. Find the expected frequencies for
each class to determine if the employee ages are normally distributed.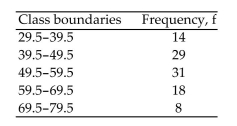
each class to determine if the employee ages are normally distributed.
Question
A sociologist believes that the levels of educational attainment of homeless persons are not uniformly
distributed. To test this claim, you randomly survey 100 homeless persons and record the educational
attainment of each. The results are shown in the following table. At α = 0.10, is there evidence to support the
sociologistʹs claim that the distribution is not uniform?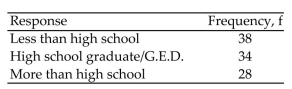
distributed. To test this claim, you randomly survey 100 homeless persons and record the educational
attainment of each. The results are shown in the following table. At α
= 0.10, is there evidence to support thesociologistʹs claim that the distribution is not uniform?
Question
The frequency distribution shows the ages for a sample of 100 employees. Are the ages of employees normally
distributed? Use = 0.05.
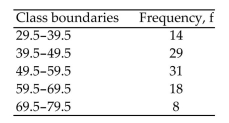
distributed? Use
= 0.05. Question
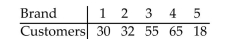
A coffeehouse wishes to see if customers have any preference among 5 different brands of coffee. A sample of 200 customers provided the data below. Calculate the chi-square test statistic χ  to test the claim that the
Distribution is uniform..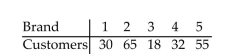
A)37.45
B)45.91
C)48.91
D)55.63
to test the claim that theDistribution is uniform..
A)37.45
B)45.91
C)48.91
D)55.63
Question
A sociologist believes that the levels of educational attainment of homeless persons are not uniformly
distributed. To test this claim, you randomly survey 100 homeless persons and record the educational
attainment of each. The results are shown in the following table. Calculate the chi-square test statistic χ to
to
test the sociologistʹs claim.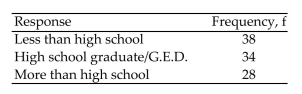
distributed. To test this claim, you randomly survey 100 homeless persons and record the educational
attainment of each. The results are shown in the following table. Calculate the chi-square test statistic χ
totest the sociologistʹs claim.
Question
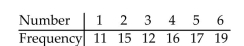
Each side of a standard six-sided die should appear approximately  of the time when the die is rolled. A player suspects that a certain die is loaded. The suspected die is rolled 90 times. The results are shown below.
Find the critical value χ to test the playerʹs claim. Use
A)9.236
B)1.610
C)12.833
D)11.071
of the time when the die is rolled. A player suspects that a certain die is loaded. The suspected die is rolled 90 times. The results are shown below.Find the critical value χ
to test the playerʹs claim. Use A)9.236
B)1.610
C)12.833
D)11.071
Question
Each side of a standard six-sided die should appear approximately  oof the time when the die is rolled. A player suspects that a certain die is loaded. The suspected die is rolled 90 times. The results are shown below.
Calculate the chi-square test statistic χ to test the playerʹs claim.
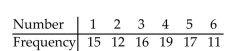
A)3.067
B)2.143
C)5.013
D)4.312
oof the time when the die is rolled. A player suspects that a certain die is loaded. The suspected die is rolled 90 times. The results are shown below.Calculate the chi-square test statistic χ
to test the playerʹs claim. A)3.067
B)2.143
C)5.013
D)4.312
Question
Each side of a standard six-sided die should appear approximately  of the time when the die is rolled. A
player suspects that a certain die is loaded. The suspected die is rolled 90 times. The results are shown below.
Test the playerʹs claim.

of the time when the die is rolled. Aplayer suspects that a certain die is loaded. The suspected die is rolled 90 times. The results are shown below.
Test the playerʹs claim.
Question
Many track runners believe that they have a better chance of winning if they start in the inside lane that is
closest to the field. For the data below, the lane closest to the field is Lane 1, the next lane is Lane 2, and so on
until the outermost lane, Lane 6. The data lists the number of wins for track runners in the different starting
positions. Test the claim that the number of wins is uniformly distributed across the different starting
positions. The results are based on 240 wins.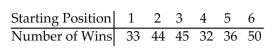
Question
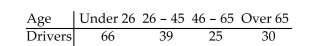
A random sample of 160 car crashes are selected and categorized by age. The results are listed below. The age distribution of drivers for the given categories is 18% for the under 26 group, 39% for the 26-45 group, 31% for
The 45-65 group, and 12% for the group over 65. Calculate the chi-square test statistic χ to test the claim that
All ages have crash rates proportional to their driving rates.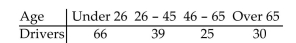
A)75.101
B)85.123
C)101.324
D)95.431
The 45-65 group, and 12% for the group over 65. Calculate the chi-square test statistic χ
to test the claim thatAll ages have crash rates proportional to their driving rates.
A)75.101
B)85.123
C)101.324
D)95.431
Question
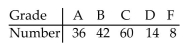
A teacher figures that final grades in the statistics department are distributed as: A, 25%; B, 25%; C, 40%; D, 5%; F, 5%. At the end of a randomly selected semester, the following number of grades were recorded. Find the
Critical value χ to determine if the grade distribution for the department is different than expected. Use
  .01.
.01. 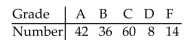
A)13.277
B)11.143
C)9.488
D)7.779
Critical value χ
to determine if the grade distribution for the department is different than expected. Use .01. A)13.277
B)11.143
C)9.488
D)7.779
Question
A teacher figures that final grades in the statistics department are distributed as: A, 25%; B, 25%; C, 40%; D, 5%;
F, 5%. At the end of a randomly selected semester, the following number of grades were recorded. Determine if
the grade distribution for the department is different than expected. Use
F, 5%. At the end of a randomly selected semester, the following number of grades were recorded. Determine if
the grade distribution for the department is different than expected. Use
Question
Many track runners believe that they have a better chance of winning if they start in the inside lane that is closest to the field. For the data below, the lane closest to the field is Lane 1, the next lane is Lane 2, and so on
Until the outermost lane, Lane 6. The data lists the number of wins for track runners in the different starting
Positions. Find the critical value χ to test the claim that the number of wins is uniformly distributed across
The different starting positions. The results are based on 240 wins.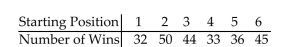
A)11.070
B)9.236
C)15.086
D)12.833
Until the outermost lane, Lane 6. The data lists the number of wins for track runners in the different starting
Positions. Find the critical value χ
to test the claim that the number of wins is uniformly distributed acrossThe different starting positions. The results are based on 240 wins.
A)11.070
B)9.236
C)15.086
D)12.833
Question
A teacher figures that final grades in the statistics department are distributed as: A, 25%; B, 25%; C, 40%; D, 5%; F, 5%. At the end of a randomly selected semester, the following number of grades were recorded. Calculate
The chi-square test statistic χ to determine if the grade distribution for the department is different than
Expected.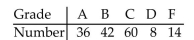
A)5.25
B)6.87
C)3.41
D)4.82
The chi-square test statistic χ
to determine if the grade distribution for the department is different thanExpected.
A)5.25
B)6.87
C)3.41
D)4.82
Question
A new coffeehouse wishes to see whether customers have any preference among 5 different brands of coffee. A
sample of 200 customers provided the data below. Test the claim that the distribution is uniform. Use = 0.01.
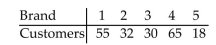
sample of 200 customers provided the data below. Test the claim that the distribution is uniform. Use
= 0.01. Question
A coffeehouse wishes to see if customers have any preference among 5 different brands of coffee. A sample of 200 customers provided the data below. Find the critical value χ  to test the claim that the distribution is
Uniform.
A)13.277
B)9.488
C)11.143
D)14.860
to test the claim that the distribution isUniform.
A)13.277
B)9.488
C)11.143
D)14.860
Question
A random sample of 160 car crashes are selected and categorized by age. The results are listed below. The age
distribution of drivers for the given categories is 18% for the under 26 group, 39% for the 26-45 group, 31% for
the 46-65 group, and 12% for the group over 65. Test the claim that all ages have crash rates proportional to
their driving rates. Use = 0.05.
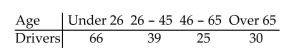
distribution of drivers for the given categories is 18% for the under 26 group, 39% for the 26-45 group, 31% for
the 46-65 group, and 12% for the group over 65. Test the claim that all ages have crash rates proportional to
their driving rates. Use
= 0.05. Question
A random sample of 160 car crashes are selected and categorized by age. The results are listed below. The age distribution of drivers for the given categories is 18% for the under 26 group, 39% for the 26-45 group, 31% for
The 45-65 group, and 12% for the group over 65. Find the critical value χ to test the claim that all ages have
Crash rates proportional to their driving rates. Use
A)7.815
B)6.251
C)11.143
D)9.348
The 45-65 group, and 12% for the group over 65. Find the critical value χ
to test the claim that all ages haveCrash rates proportional to their driving rates. Use
A)7.815
B)6.251
C)11.143
D)9.348
Question
The contingency table below shows the results of a random sample of 200 state representatives that was conducted to see whether their opinions on a bill are related to their party affiliation. 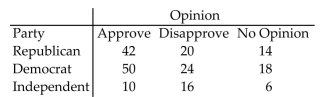 Find the chi-square test statistic, χ
  to test the claim of independence.
A)8.030
B)11.765
C)7.662
D)9.483
Find the chi-square test statistic, χ to test the claim of independence.A)8.030
B)11.765
C)7.662
D)9.483
Question
Perform the indicated hypothesis test. Be sure to do the following: identify the claim and state the null and alternative
hypotheses. Determine the critical value. Calculate the test statistic. Decide to reject or to fail to reject the null
hypothesis and interpret the decision in the context of the original claim.
The data below shows the age and favorite type of music of 779 randomly selected people.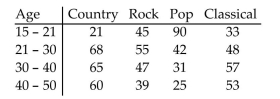 Test the claim that preferred music type is dependent on age. Use
hypotheses. Determine the critical value. Calculate the test statistic. Decide to reject or to fail to reject the null
hypothesis and interpret the decision in the context of the original claim.
The data below shows the age and favorite type of music of 779 randomly selected people.
Test the claim that preferred music type is dependent on age. Use Question
Perform the indicated hypothesis test. Be sure to do the following: identify the claim and state the null and alternative
hypotheses. Determine the critical value. Calculate the test statistic. Decide to reject or to fail to reject the null
hypothesis and interpret the decision in the context of the original claim.
The contingency table below shows the party and opinions on a bill of a random sample of 200 state
representatives.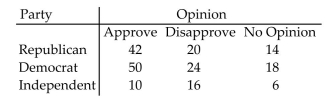 Test the claim that opinions on the bill are dependent on party affiliation. Use α
  = 0.05 .
hypotheses. Determine the critical value. Calculate the test statistic. Decide to reject or to fail to reject the null
hypothesis and interpret the decision in the context of the original claim.
The contingency table below shows the party and opinions on a bill of a random sample of 200 state
representatives.
Test the claim that opinions on the bill are dependent on party affiliation. Use α = 0.05 . Question
A sports researcher is interested in determining if there is a relationship between the type of sport and type of team winning (home team versus visiting team). A random sample of 526 games is selected and the results are
Given below. Calculate the chi-square test statistic χ to test the claim that the type of team winning is
Independent of the sport.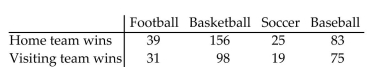
A)3.290
B)2.919
C)5.391
D)4.192
Given below. Calculate the chi-square test statistic χ
to test the claim that the type of team winning isIndependent of the sport.
A)3.290
B)2.919
C)5.391
D)4.192
Question
A researcher wants to determine whether the number of minutes adults spend online per day is related to gender. A random sample of 315 adults was selected and the results are shown below. Calculate the chi -square
Test statistic χ to determine if there is enough evidence to conclude that the number of minutes spent online
Per day is related to gender.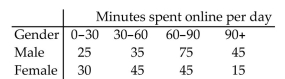
A)18.146
B)19.874
C)20.912
D)21.231
Test statistic χ
to determine if there is enough evidence to conclude that the number of minutes spent onlinePer day is related to gender.
A)18.146
B)19.874
C)20.912
D)21.231
Question
Perform the indicated hypothesis test. Be sure to do the following: identify the claim and state the null and alternative
hypotheses. Determine the critical value. Calculate the test statistic. Decide to reject or to fail to reject the null
hypothesis and interpret the decision in the context of the original claim.
A sports researcher is interested in determining if there is a relationship between the type of sport and type of
team winning (home team versus visiting team). A random sample of 526 games is selected and the results are
given below.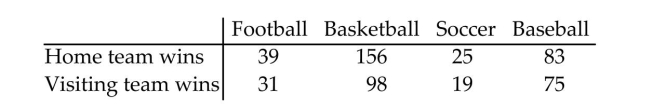 Test the claim that the type of team winning is independent of the type of sport. Use
hypotheses. Determine the critical value. Calculate the test statistic. Decide to reject or to fail to reject the null
hypothesis and interpret the decision in the context of the original claim.
A sports researcher is interested in determining if there is a relationship between the type of sport and type of
team winning (home team versus visiting team). A random sample of 526 games is selected and the results are
given below.
Test the claim that the type of team winning is independent of the type of sport. Use Question
Perform the indicated hypothesis test. Be sure to do the following: identify the claim and state the null and alternative
hypotheses. Determine the critical value. Calculate the test statistic. Decide to reject or to fail to reject the null
hypothesis and interpret the decision in the context of the original claim.
A researcher is interested in determining if there is a relationship between exercise and blood pressure for
adults over 50. A random sample of 236 adults over 50 is selected and the results are given below.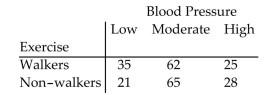 Test the claim that walking and blood pressure are independent. Use
hypotheses. Determine the critical value. Calculate the test statistic. Decide to reject or to fail to reject the null
hypothesis and interpret the decision in the context of the original claim.
A researcher is interested in determining if there is a relationship between exercise and blood pressure for
adults over 50. A random sample of 236 adults over 50 is selected and the results are given below.
Test the claim that walking and blood pressure are independent. Use Question
A sports researcher is interested in determining if there is a relationship between the number of home team and visiting team wins and different sports. A random sample of 526 games is selected and the results are given
Below. Find the critical value χ to test the claim that the number of home team and visiting team wins is
Independent of the sport. Use = 0.01.
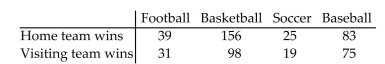
A)11.345
B)12.838
C)7.815
D)9.348
Below. Find the critical value χ
to test the claim that the number of home team and visiting team wins isIndependent of the sport. Use
= 0.01. A)11.345
B)12.838
C)7.815
D)9.348
Question
Find the indicated expected frequency.
A researcher wants to determine whether the number of minutes adults spend online per day is related to gender. A random sample of 315 adults was selected and the results are shown below. Find the expected
Frequency for the cell to determine if there is enough evidence to conclude that the number of minutes
Spent online per day is related to gender. Round to the nearest tenth if necessary.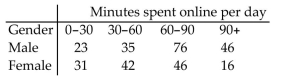
A)33
B)52.3
C)44
D)69.7
A researcher wants to determine whether the number of minutes adults spend online per day is related to gender. A random sample of 315 adults was selected and the results are shown below. Find the expected
Frequency for the cell
to determine if there is enough evidence to conclude that the number of minutesSpent online per day is related to gender. Round to the nearest tenth if necessary.
A)33
B)52.3
C)44
D)69.7
Question
Find the indicated expected frequency.
A sports researcher is interested in determining if there is a relationship between the number of home team and visiting team wins and different sports. A random sample of 526 games is selected and the results are given
Below. Find the expected frequency for tto test the claim that the number of home team and visiting team
Wins are independent of the sport. Round to the nearest tenth if necessary.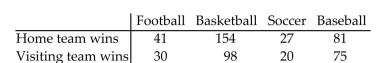
A)106.8
B)19.9
C)145.2
D)27.1
A sports researcher is interested in determining if there is a relationship between the number of home team and visiting team wins and different sports. A random sample of 526 games is selected and the results are given
Below. Find the expected frequency for
tto test the claim that the number of home team and visiting teamWins are independent of the sport. Round to the nearest tenth if necessary.
A)106.8
B)19.9
C)145.2
D)27.1
Question
A medical researcher is interested in determining if there is a relationship between adults over 50 who walk regularly and low, moderate, and high blood pressure. A random sample of 236 adults over 50 is selected and
The results are given below. Find the critical value χ to test the claim that walking and low, moderate, and
High blood pressure are not related. Use = 0.01.
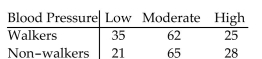
A)9.210
B)9.348
C)6.251
D)0.584
The results are given below. Find the critical value χ
to test the claim that walking and low, moderate, andHigh blood pressure are not related. Use
= 0.01. A)9.210
B)9.348
C)6.251
D)0.584
Question
A researcher wants to determine whether the number of minutes adults spend online per day is related to gender. A random sample of 315 adults was selected and the results are shown below. Find the critical value  to determine if there is enough evidence to conclude that the number of minutes spent online per day is
Related to gender. Use = 0.05.
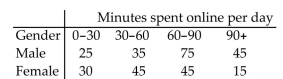
A)7.815
B)9.348
C)11.345
D)6.251
to determine if there is enough evidence to conclude that the number of minutes spent online per day isRelated to gender. Use
= 0.05. A)7.815
B)9.348
C)11.345
D)6.251
Question
The contingency table below shows the results of a random sample of 200 state representatives that was conducted to see whether their opinions on a bill are related to their party affiliation. 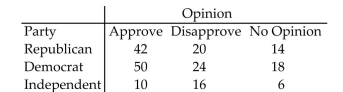 Find the critical value χ
  , to test the claim of independence using α = 0.05.
A)9.488
B)7.779
C)11.143
D)13.277
Find the critical value χ , to test the claim of independence using α = 0.05.A)9.488
B)7.779
C)11.143
D)13.277
Question
Find the marginal frequencies for the given contingency table
The following contingency table was based on a random sample of drivers and classifies drivers by age group and number of accidents in the past three years.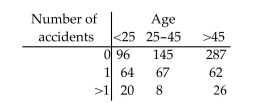
A)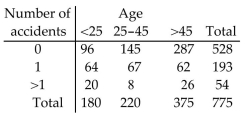
B)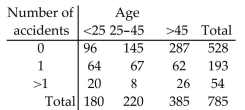
C)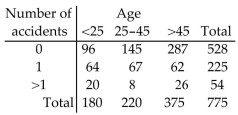
D)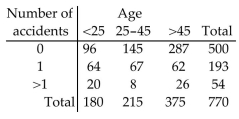
The following contingency table was based on a random sample of drivers and classifies drivers by age group and number of accidents in the past three years.
A)
B)
C)
D)
Question
Find the marginal frequencies for the given contingency table
A)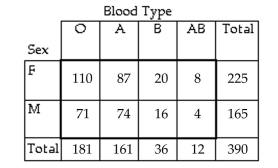
B)
C)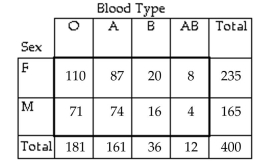
D)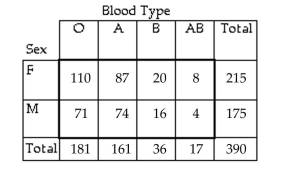
A)
B)
C)
D)
Question
Find the indicated expected frequency.
The contingency table below shows the results of a random sample of 400 state representatives that was conducted to see whether their opinions on a bill are related to their party affiliation.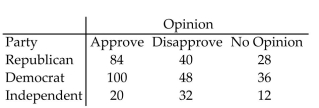 Find the expected frequency for the cell
  Round to the nearest tenth if necessary.
A)55.2
B)45.6
C)93.84
D)34.96
The contingency table below shows the results of a random sample of 400 state representatives that was conducted to see whether their opinions on a bill are related to their party affiliation.
Find the expected frequency for the cell Round to the nearest tenth if necessary.A)55.2
B)45.6
C)93.84
D)34.96
Question
Perform the indicated hypothesis test. Be sure to do the following: identify the claim and state the null and alternative
hypotheses. Determine the critical value. Calculate the test statistic. Decide to reject or to fail to reject the null
hypothesis and interpret the decision in the context of the original claim.
A researcher wants to determine whether the time spent online per day is related to gender. A random sample
of 315 adults was selected and the results are shown below.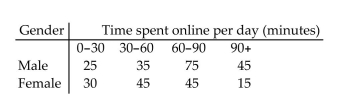 Test the hypothesis that the time spent online per day is related to gender. Use
hypotheses. Determine the critical value. Calculate the test statistic. Decide to reject or to fail to reject the null
hypothesis and interpret the decision in the context of the original claim.
A researcher wants to determine whether the time spent online per day is related to gender. A random sample
of 315 adults was selected and the results are shown below.
Test the hypothesis that the time spent online per day is related to gender. Use Question
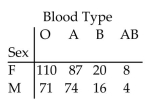
Find the marginal frequencies for the given contingency table
The table below describes the smoking habits of a group of asthma sufferers.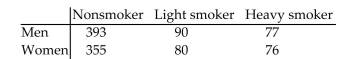
A)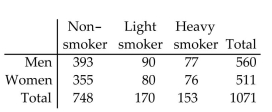
B)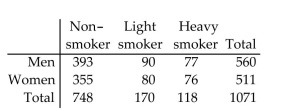
C)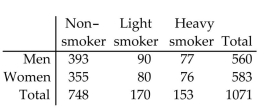
D)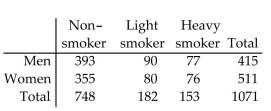
The table below describes the smoking habits of a group of asthma sufferers.
A)
B)
C)
D)
Question
Find the indicated expected frequency.
A medical researcher is interested in determining if there is a relationship between adults over 50 who walk regularly and low, moderate, and high blood pressure. A random sample of 236 adults over 50 is selected and
The results are given below. Find the expected frequency to test the claim that walking and low, moderate,
And high blood pressure are not related. Round to the nearest tenth if necessary.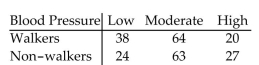
A)61.3
B)29.9
C)65.7
D)22.7
A medical researcher is interested in determining if there is a relationship between adults over 50 who walk regularly and low, moderate, and high blood pressure. A random sample of 236 adults over 50 is selected and
The results are given below. Find the expected frequency
to test the claim that walking and low, moderate,And high blood pressure are not related. Round to the nearest tenth if necessary.
A)61.3
B)29.9
C)65.7
D)22.7
Question
A medical researcher is interested in determining if there is a relationship between adults over 50 who walk regularly and low, moderate, and high blood pressure. A random sample of 236 adults over 50 is selected and
The results are given below. Calculate the chi-square test statistic χ to test the claim that walking and low,
Moderate, and high blood pressure are not related.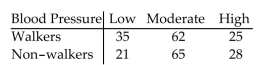
A)3.473
B)16.183
C)18.112
D)6.003
The results are given below. Calculate the chi-square test statistic χ
to test the claim that walking and low,Moderate, and high blood pressure are not related.
A)3.473
B)16.183
C)18.112
D)6.003
Question
Perform a homogeneity of proportions test to test whether the population proportions are equal. The hypotheses to be
tested are:
H0: The proportions are equal
Ha: At least one of the proportions is different from the others.
Random samples of 400 men and 400 women were obtained and participants were asked whether they
planned to vote in the next election. The results are listed below. Perform a homogeneity of proportions test to
test the claim that the proportion of men who plan to vote in the next election is the same as the proportion of
women who plan to vote. Use = 0.05.
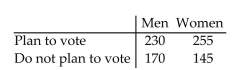
tested are:
H0: The proportions are equal
Ha: At least one of the proportions is different from the others.
Random samples of 400 men and 400 women were obtained and participants were asked whether they
planned to vote in the next election. The results are listed below. Perform a homogeneity of proportions test to
test the claim that the proportion of men who plan to vote in the next election is the same as the proportion of
women who plan to vote. Use
= 0.05. Question
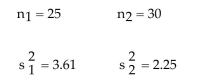
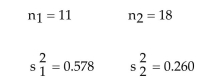
Calculate the test statistic F to test the claim that  Two samples are randomly selected from populations that are normal. The sample statistics are given below.
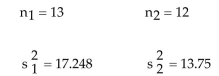
A)1.254
B)0.797
C)1.120
D)1.573
Two samples are randomly selected from populations that are normal. The sample statistics are given below. A)1.254
B)0.797
C)1.120
D)1.573
Question
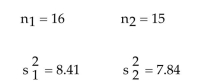
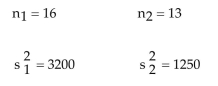
Calculate the test statistic F to test the claim that  Two samples are randomly selected from populations that are normal. The sample statistics are given below.
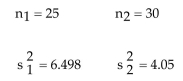
A)1.604
B)1.267
C)0.623
D)2.573
Two samples are randomly selected from populations that are normal. The sample statistics are given below. A)1.604
B)1.267
C)0.623
D)2.573
Question
Find the critical value  to test the claim that
  Two samples are randomly selected from populations that are normal. The sample statistics are given below. Use α
A)2.46
B)3.66
C)2.95
D)2.40
to test the claim that Two samples are randomly selected from populations that are normal. The sample statistics are given below. Use α A)2.46
B)3.66
C)2.95
D)2.40
Question
Find the critical value  to test the claim that
  Two samples are randomly selected from populations that are normal. The sample statistics are given below. Use
A)4.40
B)2.79
C)4.25
D)3.43
to test the claim that Two samples are randomly selected from populations that are normal. The sample statistics are given below. Use A)4.40
B)2.79
C)4.25
D)3.43
Question
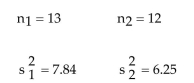
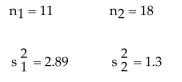
Calculate the test statistic F to test the claim that  Two samples are randomly selected from populations that are normal. The sample statistics are given below.
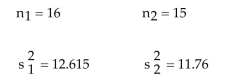
A)1.073
B)0.932
C)1.036
D)1.151
Two samples are randomly selected from populations that are normal. The sample statistics are given below. A)1.073
B)0.932
C)1.036
D)1.151
Question
Perform the indicated hypothesis test. Be sure to do the following: identify the claim and state the null and alternative
hypotheses. Determine the critical value and rejection region. Calculate the test statistic. Decide to reject or to fail to
reject the null hypothesis and interpret the decision in the context of the original claim. Assume that the samples are
independent and that each population has a normal distribution.
Test the claim that Two samples are randomly selected from populations that are normal. The
sample statistics are given below. Use
hypotheses. Determine the critical value and rejection region. Calculate the test statistic. Decide to reject or to fail to
reject the null hypothesis and interpret the decision in the context of the original claim. Assume that the samples are
independent and that each population has a normal distribution.
Test the claim that
Two samples are randomly selected from populations that are normal. Thesample statistics are given below. Use
Question
Find the critical value  for a one-tailed test using α
  = 0.05, d.f.N = 6, and d.f.D = 16.
A)2.74
B)3.94
C)2.66
D)2.19
for a one-tailed test using α = 0.05, d.f.N = 6, and d.f.D = 16.A)2.74
B)3.94
C)2.66
D)2.19
Question
Perform the indicated hypothesis test. Be sure to do the following: identify the claim and state the null and alternative
hypotheses. Determine the critical value and rejection region. Calculate the test statistic. Decide to reject or to fail to
reject the null hypothesis and interpret the decision in the context of the original claim. Assume that the samples are
independent and that each population has a normal distribution.
Test the claim that Two samples are randomly selected from populations that are normal. The
sample statistics are given below. Use
hypotheses. Determine the critical value and rejection region. Calculate the test statistic. Decide to reject or to fail to
reject the null hypothesis and interpret the decision in the context of the original claim. Assume that the samples are
independent and that each population has a normal distribution.
Test the claim that
Two samples are randomly selected from populations that are normal. Thesample statistics are given below. Use
Question
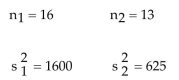
Calculate the test statistic F to test the claim that  Two samples are randomly selected from populations that are normal. The sample statistics are given below.
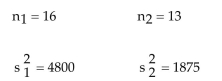
A)2.560
B)1.600
C)0.391
D)6.554
Two samples are randomly selected from populations that are normal. The sample statistics are given below. A)2.560
B)1.600
C)0.391
D)6.554
Question
Find the critical value  for a two-tailed test using α
  = 0.05, d.f.N = 5, and d.f.D = 10.
A)4.24
B)4.07
C)4.47
D)6.62
for a two-tailed test using α = 0.05, d.f.N = 5, and d.f.D = 10.A)4.24
B)4.07
C)4.47
D)6.62
Question
Perform a homogeneity of proportions test to test whether the population proportions are equal. The hypotheses to be
tested are:
H0: The proportions are equal
Ha: At least one of the proportions is different from the others.
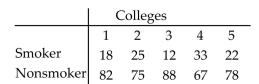
A random sample of 100 students from 5 different colleges was randomly selected, and the number who smoke
was recorded. The results are listed below. Perform a homogeneity of proportions test to test the claim that the
proportion of students who smoke is the same in all 5 colleges. Use
tested are:
H0: The proportions are equal
Ha: At least one of the proportions is different from the others.
A random sample of 100 students from 5 different colleges was randomly selected, and the number who smoke
was recorded. The results are listed below. Perform a homogeneity of proportions test to test the claim that the
proportion of students who smoke is the same in all 5 colleges. Use
Question
Find the critical value  to test the claim that
  Two samples are randomly selected from populations that are normal. The sample statistics are given below. Use
A)2.15
B)2.21
C)2.14
D)2.09
to test the claim that Two samples are randomly selected from populations that are normal. The sample statistics are given below. Use A)2.15
B)2.21
C)2.14
D)2.09
Question
Find the critical value  for a two-tailed test using α
  = 0.02, d.f.N = 5, and d.f.D = 10.
A)5.64
B)10.05
C)5.99
D)5.39
for a two-tailed test using α = 0.02, d.f.N = 5, and d.f.D = 10.A)5.64
B)10.05
C)5.99
D)5.39
Question
Perform the indicated hypothesis test. Be sure to do the following: identify the claim and state the null and alternative
hypotheses. Determine the critical value and rejection region. Calculate the test statistic. Decide to reject or to fail to
reject the null hypothesis and interpret the decision in the context of the original claim. Assume that the samples are
independent and that each population has a normal distribution.
Test the claim that Two samples are randomly selected from populations that are normal. The
sample statistics are given below. Use
hypotheses. Determine the critical value and rejection region. Calculate the test statistic. Decide to reject or to fail to
reject the null hypothesis and interpret the decision in the context of the original claim. Assume that the samples are
independent and that each population has a normal distribution.
Test the claim that
Two samples are randomly selected from populations that are normal. Thesample statistics are given below. Use
Question
Calculate the test statistic F to test the claim that  Two samples are randomly selected from populations that are normal. The sample statistics are given below.
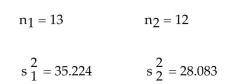
A)1.254
B)0.797
C)1.573
D)1.120
Two samples are randomly selected from populations that are normal. The sample statistics are given below. A)1.254
B)0.797
C)1.573
D)1.120
Question
Find the critical value  for a one-tailed test using α
  = 0.01, d.f.N = 3, and d.f.D = 20.
A)4.94
B)25.58
C)5.82
D)3.09
for a one-tailed test using α = 0.01, d.f.N = 3, and d.f.D = 20.A)4.94
B)25.58
C)5.82
D)3.09
Question
Find the critical value  to test the claim that
  Two samples are randomly selected from populations that are normal. The sample statistics are given below. Use
A)4.01
B)3.18
C)2.62
D)3.67
to test the claim that Two samples are randomly selected from populations that are normal. The sample statistics are given below. Use A)4.01
B)3.18
C)2.62
D)3.67
Question
Find the critical value  to test the claim that
  Two samples are randomly selected from populations that are normal. The sample statistics are given below. Use
A)3.59
B)2.45
C)2.92
D)4.56
to test the claim that Two samples are randomly selected from populations that are normal. The sample statistics are given below. Use A)3.59
B)2.45
C)2.92
D)4.56
Question
Calculate the test statistic F to test the claim that  Two samples are randomly selected from populations that are normal. The sample statistics are given below.
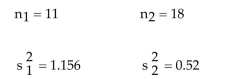
A)2.223
B)1.490
C)4.933
D)0.450
Two samples are randomly selected from populations that are normal. The sample statistics are given below. A)2.223
B)1.490
C)4.933
D)0.450
Question
The weights of a random sample of 25 women between the ages of 25 and 34 had a standard deviation of 28
pounds. The weights of a random sample of 41 women between the ages of 55 and 64 had a standard
deviation of 21 pounds. Construct a 95% confidence interval for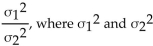 are the variances of
the weights of women between the ages 25 and 34 and the weights of women between the ages of 55 and 64
respectively.
pounds. The weights of a random sample of 41 women between the ages of 55 and 64 had a standard
deviation of 21 pounds. Construct a 95% confidence interval for
are the variances ofthe weights of women between the ages 25 and 34 and the weights of women between the ages of 55 and 64
respectively.
Question
Find the left-tailed and right-tailed critical F-values for a two-tailed test. Let α  = 0.02, d.f.N = 7, and
d.f.D = 5.
= 0.02, d.f.N = 7, andd.f.D = 5.
Question
Perform the indicated hypothesis test. Be sure to do the following: identify the claim and state the null and alternative
hypotheses. Determine the critical value and rejection region. Calculate the test statistic. Decide to reject or to fail to
reject the null hypothesis and interpret the decision in the context of the original claim. Assume that the samples are
independent and that each population has a normal distribution.
Test the claim that Two samples are randomly selected from populations that are normal. The
sample statistics are given below. Use
hypotheses. Determine the critical value and rejection region. Calculate the test statistic. Decide to reject or to fail to
reject the null hypothesis and interpret the decision in the context of the original claim. Assume that the samples are
independent and that each population has a normal distribution.
Test the claim that
Two samples are randomly selected from populations that are normal. Thesample statistics are given below. Use
Question
Perform the indicated hypothesis test. Be sure to do the following: identify the claim and state the null and alternative
hypotheses. Determine the critical value and rejection region. Calculate the test statistic. Decide to reject or to fail to
reject the null hypothesis and interpret the decision in the context of the original claim. Assume that the samples are
independent and that each population has a normal distribution.
The weights of a random sample of 121 women between the ages of 25 and 34 had a standard deviation of 28
pounds. The weights of 121 women between the ages of 55 and 64 had a standard deviation 21 pounds. Test
the claim that the older women are from a population with a standard deviation less than that for women in
the 25 to 34 age group. Use
Question
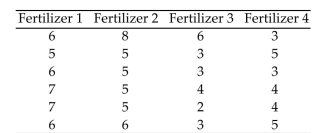
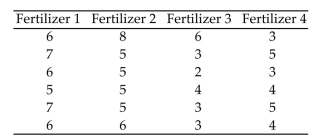
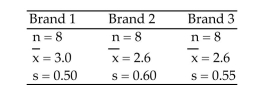
Four different types of fertilizers are used on raspberry plants. The number of raspberries on each randomly selected plant is given below. Find the critical value F0 to test the claim that the type of fertilizer makes no
Difference in the mean number of raspberries per plant. Use
A)4.94
B)4.43
C)26.69
D)4.22
Difference in the mean number of raspberries per plant. Use
A)4.94
B)4.43
C)26.69
D)4.22
Question
Perform the indicated hypothesis test. Be sure to do the following: identify the claim and state the null and alternative
hypotheses. Determine the critical value and rejection region. Calculate the test statistic. Decide to reject or to fail to
reject the null hypothesis and interpret the decision in the context of the original claim. Assume that the samples are
independent and that each population has a normal distribution.
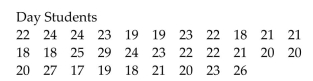
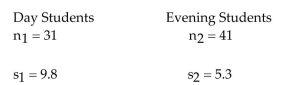
A statistics teacher wants to see whether there is a significant difference between the variance of the ages of day
students and the variance of the ages of night students. A random sample of 31 students is selected from each
group. The data are given below. Test the claim that there is no difference between the variances of the two
groups.
Use
hypotheses. Determine the critical value and rejection region. Calculate the test statistic. Decide to reject or to fail to
reject the null hypothesis and interpret the decision in the context of the original claim. Assume that the samples are
independent and that each population has a normal distribution.
A statistics teacher wants to see whether there is a significant difference between the variance of the ages of day
students and the variance of the ages of night students. A random sample of 31 students is selected from each
group. The data are given below. Test the claim that there is no difference between the variances of the two
groups.
Use
Question
Perform the indicated hypothesis test. Be sure to do the following: identify the claim and state the null and alternative
hypotheses. Determine the critical value and rejection region. Calculate the test statistic. Decide to reject or to fail to
reject the null hypothesis and interpret the decision in the context of the original claim. Assume that the samples are
independent and that each population has a normal distribution.
At a college, 61 female students were randomly selected and it was found that their monthly income had a
standard deviation of $218.70. For 121 male students, the standard deviation was $303.66. Test the claim that
variance of monthly incomes is higher for male students than it is for female students. Use
Question
A medical researcher wishes to try three different techniques to lower blood pressure of patients with high blood pressure. The subjects are randomly selected and assigned to one of three groups. Group 1 is given
Medication, Group 2 is given an exercise program, and Group 3 is assigned a diet program. At the end of six
Weeks, each subjectʹs blood pressure is recorded. Find the critical value to test the claim that there is no
Difference among the means. Use = 0.05.
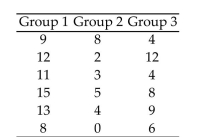
A)3.68
B)19.43
C)4.77
D)39.43
Medication, Group 2 is given an exercise program, and Group 3 is assigned a diet program. At the end of six
Weeks, each subjectʹs blood pressure is recorded. Find the critical value
to test the claim that there is noDifference among the means. Use
= 0.05. A)3.68
B)19.43
C)4.77
D)39.43
Question
Perform the indicated hypothesis test. Be sure to do the following: identify the claim and state the null and alternative
hypotheses. Determine the critical value and rejection region. Calculate the test statistic. Decide to reject or to fail to
reject the null hypothesis and interpret the decision in the context of the original claim. Assume that the samples are
independent and that each population has a normal distribution.
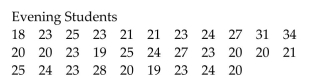
A statistics teacher believes that the variance of test scores of students in her evening statistics class is lower
than the variance of test scores of students in her day class. The results of an exam, given to the day and
evening students, are shown below. Can the teacher conclude that the scores of evening students have a lower
variance? Use
hypotheses. Determine the critical value and rejection region. Calculate the test statistic. Decide to reject or to fail to
reject the null hypothesis and interpret the decision in the context of the original claim. Assume that the samples are
independent and that each population has a normal distribution.
A statistics teacher believes that the variance of test scores of students in her evening statistics class is lower
than the variance of test scores of students in her day class. The results of an exam, given to the day and
evening students, are shown below. Can the teacher conclude that the scores of evening students have a lower
variance? Use
Question
Perform the indicated hypothesis test. Be sure to do the following: identify the claim and state the null and alternative
hypotheses. Determine the critical value and rejection region. Calculate the test statistic. Decide to reject or to fail to
reject the null hypothesis and interpret the decision in the context of the original claim. Assume that the samples are
independent and that each population has a normal distribution.
Test the claim that Two samples are randomly selected from populations that are normal. The
sample statistics are given below. Use
hypotheses. Determine the critical value and rejection region. Calculate the test statistic. Decide to reject or to fail to
reject the null hypothesis and interpret the decision in the context of the original claim. Assume that the samples are
independent and that each population has a normal distribution.
Test the claim that
Two samples are randomly selected from populations that are normal. Thesample statistics are given below. Use
Question
Find the test statistic F to test the claim that the populations have the same mean. 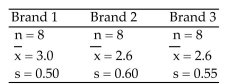
A)1.403
B)1.021
C)1.182
D)0.832
A)1.403
B)1.021
C)1.182
D)0.832
Question
Perform the indicated hypothesis test. Be sure to do the following: identify the claim and state the null and alternative
hypotheses. Determine the critical value and rejection region. Calculate the test statistic. Decide to reject or to fail to
reject the null hypothesis and interpret the decision in the context of the original claim. Assume that the samples are
independent and that each population has a normal distribution.
A random sample of 21 women had blood pressure levels with a variance of 553.6. A random sample of 18 men
had blood pressure levels with a variance of 368.64. Test the claim that the blood pressure levels for women
have a larger variance than those for men. Use
Question
Find the left-tailed and right-tailed critical F-values for a two-tailed test. Use the sample statistics below. Let  α = 0.05.
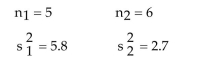
α = 0.05. Question
Perform the indicated hypothesis test. Be sure to do the following: identify the claim and state the null and alternative
hypotheses. Determine the critical value and rejection region. Calculate the test statistic. Decide to reject or to fail to
reject the null hypothesis and interpret the decision in the context of the original claim. Assume that the samples are
independent and that each population has a normal distribution.
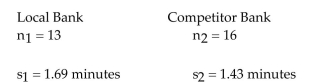
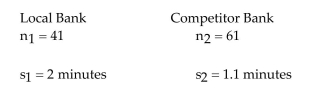
A local bank has the reputation of having a variance in waiting times as low as that of any bank in the area. A
competitor bank in the area checks the waiting time at both banks and claims that its variance of waiting times
is lower than at the local bank. The sample statistics are listed below. Test the competitorʹs claim. Use
hypotheses. Determine the critical value and rejection region. Calculate the test statistic. Decide to reject or to fail to
reject the null hypothesis and interpret the decision in the context of the original claim. Assume that the samples are
independent and that each population has a normal distribution.
A local bank has the reputation of having a variance in waiting times as low as that of any bank in the area. A
competitor bank in the area checks the waiting time at both banks and claims that its variance of waiting times
is lower than at the local bank. The sample statistics are listed below. Test the competitorʹs claim. Use
Question
Perform the indicated hypothesis test. Be sure to do the following: identify the claim and state the null and alternative
hypotheses. Determine the critical value and rejection region. Calculate the test statistic. Decide to reject or to fail to
reject the null hypothesis and interpret the decision in the context of the original claim. Assume that the samples are
independent and that each population has a normal distribution.
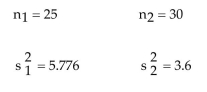
A medical researcher suspects that the variance of the pulse rate of smokers is higher than the variance of the
pulse rate of non-smokers. Use the sample statistics below to test the researcherʹs suspicion. Use α = 0.05.
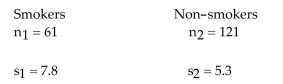
hypotheses. Determine the critical value and rejection region. Calculate the test statistic. Decide to reject or to fail to
reject the null hypothesis and interpret the decision in the context of the original claim. Assume that the samples are
independent and that each population has a normal distribution.
A medical researcher suspects that the variance of the pulse rate of smokers is higher than the variance of the
pulse rate of non-smokers. Use the sample statistics below to test the researcherʹs suspicion. Use
α = 0.05. Question
Four different types of fertilizers are used on raspberry plants. The number of raspberries on each randomly selected plant is given below. Find the test statistic F to test the claim that the type of fertilizer makes no
Difference in the mean number of raspberries per plant.
A)8.357
B)8.123
C)7.123
D)6.912
Difference in the mean number of raspberries per plant.
A)8.357
B)8.123
C)7.123
D)6.912
Question
A medical researcher wishes to try three different techniques to lower blood pressure of patients with high blood pressure. The subjects are randomly selected and assigned to one of three groups. Group 1 is given
Medication, Group 2 is given an exercise program, and Group 3 is assigned a diet program. At the end of six
Weeks, each subjectʹs blood pressure is recorded. Find the test statistic F to test the claim that there is no
Difference among the means.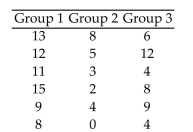 949
949
804
A)11.095
B)9.812
C)8.369
D)12.162
Medication, Group 2 is given an exercise program, and Group 3 is assigned a diet program. At the end of six
Weeks, each subjectʹs blood pressure is recorded. Find the test statistic F to test the claim that there is no
Difference among the means.
949804
A)11.095
B)9.812
C)8.369
D)12.162
Question
Perform the indicated hypothesis test. Be sure to do the following: identify the claim and state the null and alternative
hypotheses. Determine the critical value and rejection region. Calculate the test statistic. Decide to reject or to fail to
reject the null hypothesis and interpret the decision in the context of the original claim. Assume that the samples are
independent and that each population has a normal distribution.
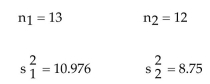
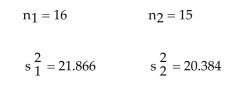
A study was conducted to determine if the variances of elementary school teacher salaries from two
neighboring districts were equal. A sample of 25 teachers from each district was selected. The first district had
a standard deviation of = $4830, and the second district had a standard deviation
  = $4410. Test the claim
that the variances of the salaries from both districts are equal. Use
hypotheses. Determine the critical value and rejection region. Calculate the test statistic. Decide to reject or to fail to
reject the null hypothesis and interpret the decision in the context of the original claim. Assume that the samples are
independent and that each population has a normal distribution.
A study was conducted to determine if the variances of elementary school teacher salaries from two
neighboring districts were equal. A sample of 25 teachers from each district was selected. The first district had
a standard deviation of
= $4830, and the second district had a standard deviation = $4410. Test the claimthat the variances of the salaries from both districts are equal. Use
Question
Find the critical  -value to test the claim that the populations have the same mean. Use
A)3.47
B)3.210
C)2.819
D)1.892
-value to test the claim that the populations have the same mean. Use A)3.47
B)3.210
C)2.819
D)1.892
Question
Perform the indicated hypothesis test. Be sure to do the following: identify the claim and state the null and alternative
hypotheses. Determine the critical value and rejection region. Calculate the test statistic. Decide to reject or to fail to
reject the null hypothesis and interpret the decision in the context of the original claim. Assume that the samples are
independent and that each population has a normal distribution.
A local bank has the reputation of having a variance in waiting times as low as that of any bank in the area. A
competitor bank in the area checks the waiting time at both banks and claims that its variance of waiting times
is lower than at the local bank. The sample statistics are listed below. Test the competitorʹs claim. Use

Unlock Deck
Sign up to unlock the cards in this deck!
Unlock Deck
Unlock Deck
1/91
Play
Full screen (f)
Deck 10: Chi-Square Tests and the F-Distribution
1
A sociologist believes that the levels of educational attainment of homeless persons are not uniformly
distributed. To test this claim, you randomly survey 100 homeless persons and record the educational
attainment of each. The results are shown in the following table. Find the critical value χ to test the
sociologistʹs claim. Use = 0.10.
distributed. To test this claim, you randomly survey 100 homeless persons and record the educational
attainment of each. The results are shown in the following table. Find the critical value χ
to test thesociologistʹs claim. Use
= 0.10. 4.605
2
Many track runners believe that they have a better chance of winning if they start in the inside lane that is closest to the field. For the data below, the lane closest to the field is Lane 1, the next lane is Lane 2, and so on
Until the outermost lane, Lane 6. The data lists the number of wins for track runners in the different starting
Positions. Calculate the chi-square test statistic χ to test the claim that the number of wins is uniformly
Distributed across the different starting positions. The results are based on 240 wins.
A)6.750
B)9.326
C)12.592
D)15.541
Until the outermost lane, Lane 6. The data lists the number of wins for track runners in the different starting
Positions. Calculate the chi-square test statistic χ
to test the claim that the number of wins is uniformlyDistributed across the different starting positions. The results are based on 240 wins.
A)6.750
B)9.326
C)12.592
D)15.541
6.750
3
The frequency distribution shows the ages for a sample of 100 employees. Find the expected frequencies for
each class to determine if the employee ages are normally distributed.
each class to determine if the employee ages are normally distributed.
11, 26, 32, 21, and 7, respectively.
4
A sociologist believes that the levels of educational attainment of homeless persons are not uniformly
distributed. To test this claim, you randomly survey 100 homeless persons and record the educational
attainment of each. The results are shown in the following table. At α = 0.10, is there evidence to support the
sociologistʹs claim that the distribution is not uniform?
distributed. To test this claim, you randomly survey 100 homeless persons and record the educational
attainment of each. The results are shown in the following table. At α
= 0.10, is there evidence to support thesociologistʹs claim that the distribution is not uniform?
Unlock Deck
Unlock for access to all 91 flashcards in this deck.
Unlock Deck
k this deck
5
The frequency distribution shows the ages for a sample of 100 employees. Are the ages of employees normally
distributed? Use = 0.05.
distributed? Use
= 0.05. Unlock Deck
Unlock for access to all 91 flashcards in this deck.
Unlock Deck
k this deck
6
A coffeehouse wishes to see if customers have any preference among 5 different brands of coffee. A sample of 200 customers provided the data below. Calculate the chi-square test statistic χ to test the claim that the
Distribution is uniform..
A)37.45
B)45.91
C)48.91
D)55.63
to test the claim that theDistribution is uniform..
A)37.45
B)45.91
C)48.91
D)55.63
Unlock Deck
Unlock for access to all 91 flashcards in this deck.
Unlock Deck
k this deck
7
A sociologist believes that the levels of educational attainment of homeless persons are not uniformly
distributed. To test this claim, you randomly survey 100 homeless persons and record the educational
attainment of each. The results are shown in the following table. Calculate the chi-square test statistic χ to
test the sociologistʹs claim.
distributed. To test this claim, you randomly survey 100 homeless persons and record the educational
attainment of each. The results are shown in the following table. Calculate the chi-square test statistic χ
totest the sociologistʹs claim.
Unlock Deck
Unlock for access to all 91 flashcards in this deck.
Unlock Deck
k this deck
8
Each side of a standard six-sided die should appear approximately of the time when the die is rolled. A player suspects that a certain die is loaded. The suspected die is rolled 90 times. The results are shown below.
Find the critical value χ to test the playerʹs claim. Use
A)9.236
B)1.610
C)12.833
D)11.071
of the time when the die is rolled. A player suspects that a certain die is loaded. The suspected die is rolled 90 times. The results are shown below.Find the critical value χ
to test the playerʹs claim. Use A)9.236
B)1.610
C)12.833
D)11.071
Unlock Deck
Unlock for access to all 91 flashcards in this deck.
Unlock Deck
k this deck
9
Each side of a standard six-sided die should appear approximately oof the time when the die is rolled. A player suspects that a certain die is loaded. The suspected die is rolled 90 times. The results are shown below.
Calculate the chi-square test statistic χ to test the playerʹs claim.
A)3.067
B)2.143
C)5.013
D)4.312
oof the time when the die is rolled. A player suspects that a certain die is loaded. The suspected die is rolled 90 times. The results are shown below.Calculate the chi-square test statistic χ
to test the playerʹs claim. A)3.067
B)2.143
C)5.013
D)4.312
Unlock Deck
Unlock for access to all 91 flashcards in this deck.
Unlock Deck
k this deck
10
Each side of a standard six-sided die should appear approximately of the time when the die is rolled. A
player suspects that a certain die is loaded. The suspected die is rolled 90 times. The results are shown below.
Test the playerʹs claim.
of the time when the die is rolled. Aplayer suspects that a certain die is loaded. The suspected die is rolled 90 times. The results are shown below.
Test the playerʹs claim.
Unlock Deck
Unlock for access to all 91 flashcards in this deck.
Unlock Deck
k this deck
11
Many track runners believe that they have a better chance of winning if they start in the inside lane that is
closest to the field. For the data below, the lane closest to the field is Lane 1, the next lane is Lane 2, and so on
until the outermost lane, Lane 6. The data lists the number of wins for track runners in the different starting
positions. Test the claim that the number of wins is uniformly distributed across the different starting
positions. The results are based on 240 wins.
closest to the field. For the data below, the lane closest to the field is Lane 1, the next lane is Lane 2, and so on
until the outermost lane, Lane 6. The data lists the number of wins for track runners in the different starting
positions. Test the claim that the number of wins is uniformly distributed across the different starting
positions. The results are based on 240 wins.
Unlock Deck
Unlock for access to all 91 flashcards in this deck.
Unlock Deck
k this deck
12
A random sample of 160 car crashes are selected and categorized by age. The results are listed below. The age distribution of drivers for the given categories is 18% for the under 26 group, 39% for the 26-45 group, 31% for
The 45-65 group, and 12% for the group over 65. Calculate the chi-square test statistic χ to test the claim that
All ages have crash rates proportional to their driving rates.
A)75.101
B)85.123
C)101.324
D)95.431
The 45-65 group, and 12% for the group over 65. Calculate the chi-square test statistic χ
to test the claim thatAll ages have crash rates proportional to their driving rates.
A)75.101
B)85.123
C)101.324
D)95.431
Unlock Deck
Unlock for access to all 91 flashcards in this deck.
Unlock Deck
k this deck
13
A teacher figures that final grades in the statistics department are distributed as: A, 25%; B, 25%; C, 40%; D, 5%; F, 5%. At the end of a randomly selected semester, the following number of grades were recorded. Find the
Critical value χ to determine if the grade distribution for the department is different than expected. Use .01.
A)13.277
B)11.143
C)9.488
D)7.779
Critical value χ
to determine if the grade distribution for the department is different than expected. Use .01. A)13.277
B)11.143
C)9.488
D)7.779
Unlock Deck
Unlock for access to all 91 flashcards in this deck.
Unlock Deck
k this deck
14
A teacher figures that final grades in the statistics department are distributed as: A, 25%; B, 25%; C, 40%; D, 5%;
F, 5%. At the end of a randomly selected semester, the following number of grades were recorded. Determine if
the grade distribution for the department is different than expected. Use
F, 5%. At the end of a randomly selected semester, the following number of grades were recorded. Determine if
the grade distribution for the department is different than expected. Use
Unlock Deck
Unlock for access to all 91 flashcards in this deck.
Unlock Deck
k this deck
15
Many track runners believe that they have a better chance of winning if they start in the inside lane that is closest to the field. For the data below, the lane closest to the field is Lane 1, the next lane is Lane 2, and so on
Until the outermost lane, Lane 6. The data lists the number of wins for track runners in the different starting
Positions. Find the critical value χ to test the claim that the number of wins is uniformly distributed across
The different starting positions. The results are based on 240 wins.
A)11.070
B)9.236
C)15.086
D)12.833
Until the outermost lane, Lane 6. The data lists the number of wins for track runners in the different starting
Positions. Find the critical value χ
to test the claim that the number of wins is uniformly distributed acrossThe different starting positions. The results are based on 240 wins.
A)11.070
B)9.236
C)15.086
D)12.833
Unlock Deck
Unlock for access to all 91 flashcards in this deck.
Unlock Deck
k this deck
16
A teacher figures that final grades in the statistics department are distributed as: A, 25%; B, 25%; C, 40%; D, 5%; F, 5%. At the end of a randomly selected semester, the following number of grades were recorded. Calculate
The chi-square test statistic χ to determine if the grade distribution for the department is different than
Expected.
A)5.25
B)6.87
C)3.41
D)4.82
The chi-square test statistic χ
to determine if the grade distribution for the department is different thanExpected.
A)5.25
B)6.87
C)3.41
D)4.82
Unlock Deck
Unlock for access to all 91 flashcards in this deck.
Unlock Deck
k this deck
17
A new coffeehouse wishes to see whether customers have any preference among 5 different brands of coffee. A
sample of 200 customers provided the data below. Test the claim that the distribution is uniform. Use = 0.01.
sample of 200 customers provided the data below. Test the claim that the distribution is uniform. Use
= 0.01. Unlock Deck
Unlock for access to all 91 flashcards in this deck.
Unlock Deck
k this deck
18
A coffeehouse wishes to see if customers have any preference among 5 different brands of coffee. A sample of 200 customers provided the data below. Find the critical value χ to test the claim that the distribution is
Uniform.
A)13.277
B)9.488
C)11.143
D)14.860
to test the claim that the distribution isUniform.
A)13.277
B)9.488
C)11.143
D)14.860
Unlock Deck
Unlock for access to all 91 flashcards in this deck.
Unlock Deck
k this deck
19
A random sample of 160 car crashes are selected and categorized by age. The results are listed below. The age
distribution of drivers for the given categories is 18% for the under 26 group, 39% for the 26-45 group, 31% for
the 46-65 group, and 12% for the group over 65. Test the claim that all ages have crash rates proportional to
their driving rates. Use = 0.05.
distribution of drivers for the given categories is 18% for the under 26 group, 39% for the 26-45 group, 31% for
the 46-65 group, and 12% for the group over 65. Test the claim that all ages have crash rates proportional to
their driving rates. Use
= 0.05. Unlock Deck
Unlock for access to all 91 flashcards in this deck.
Unlock Deck
k this deck
20
A random sample of 160 car crashes are selected and categorized by age. The results are listed below. The age distribution of drivers for the given categories is 18% for the under 26 group, 39% for the 26-45 group, 31% for
The 45-65 group, and 12% for the group over 65. Find the critical value χ to test the claim that all ages have
Crash rates proportional to their driving rates. Use
A)7.815
B)6.251
C)11.143
D)9.348
The 45-65 group, and 12% for the group over 65. Find the critical value χ
to test the claim that all ages haveCrash rates proportional to their driving rates. Use
A)7.815
B)6.251
C)11.143
D)9.348
Unlock Deck
Unlock for access to all 91 flashcards in this deck.
Unlock Deck
k this deck
21
The contingency table below shows the results of a random sample of 200 state representatives that was conducted to see whether their opinions on a bill are related to their party affiliation. Find the chi-square test statistic, χ to test the claim of independence.
A)8.030
B)11.765
C)7.662
D)9.483
Find the chi-square test statistic, χ to test the claim of independence.A)8.030
B)11.765
C)7.662
D)9.483
Unlock Deck
Unlock for access to all 91 flashcards in this deck.
Unlock Deck
k this deck
22
Perform the indicated hypothesis test. Be sure to do the following: identify the claim and state the null and alternative
hypotheses. Determine the critical value. Calculate the test statistic. Decide to reject or to fail to reject the null
hypothesis and interpret the decision in the context of the original claim.
The data below shows the age and favorite type of music of 779 randomly selected people. Test the claim that preferred music type is dependent on age. Use
hypotheses. Determine the critical value. Calculate the test statistic. Decide to reject or to fail to reject the null
hypothesis and interpret the decision in the context of the original claim.
The data below shows the age and favorite type of music of 779 randomly selected people.
Test the claim that preferred music type is dependent on age. Use Unlock Deck
Unlock for access to all 91 flashcards in this deck.
Unlock Deck
k this deck
23
Perform the indicated hypothesis test. Be sure to do the following: identify the claim and state the null and alternative
hypotheses. Determine the critical value. Calculate the test statistic. Decide to reject or to fail to reject the null
hypothesis and interpret the decision in the context of the original claim.
The contingency table below shows the party and opinions on a bill of a random sample of 200 state
representatives. Test the claim that opinions on the bill are dependent on party affiliation. Use α = 0.05 .
hypotheses. Determine the critical value. Calculate the test statistic. Decide to reject or to fail to reject the null
hypothesis and interpret the decision in the context of the original claim.
The contingency table below shows the party and opinions on a bill of a random sample of 200 state
representatives.
Test the claim that opinions on the bill are dependent on party affiliation. Use α = 0.05 . Unlock Deck
Unlock for access to all 91 flashcards in this deck.
Unlock Deck
k this deck
24
A sports researcher is interested in determining if there is a relationship between the type of sport and type of team winning (home team versus visiting team). A random sample of 526 games is selected and the results are
Given below. Calculate the chi-square test statistic χ to test the claim that the type of team winning is
Independent of the sport.
A)3.290
B)2.919
C)5.391
D)4.192
Given below. Calculate the chi-square test statistic χ
to test the claim that the type of team winning isIndependent of the sport.
A)3.290
B)2.919
C)5.391
D)4.192
Unlock Deck
Unlock for access to all 91 flashcards in this deck.
Unlock Deck
k this deck
25
A researcher wants to determine whether the number of minutes adults spend online per day is related to gender. A random sample of 315 adults was selected and the results are shown below. Calculate the chi -square
Test statistic χ to determine if there is enough evidence to conclude that the number of minutes spent online
Per day is related to gender.
A)18.146
B)19.874
C)20.912
D)21.231
Test statistic χ
to determine if there is enough evidence to conclude that the number of minutes spent onlinePer day is related to gender.
A)18.146
B)19.874
C)20.912
D)21.231
Unlock Deck
Unlock for access to all 91 flashcards in this deck.
Unlock Deck
k this deck
26
Perform the indicated hypothesis test. Be sure to do the following: identify the claim and state the null and alternative
hypotheses. Determine the critical value. Calculate the test statistic. Decide to reject or to fail to reject the null
hypothesis and interpret the decision in the context of the original claim.
A sports researcher is interested in determining if there is a relationship between the type of sport and type of
team winning (home team versus visiting team). A random sample of 526 games is selected and the results are
given below. Test the claim that the type of team winning is independent of the type of sport. Use
hypotheses. Determine the critical value. Calculate the test statistic. Decide to reject or to fail to reject the null
hypothesis and interpret the decision in the context of the original claim.
A sports researcher is interested in determining if there is a relationship between the type of sport and type of
team winning (home team versus visiting team). A random sample of 526 games is selected and the results are
given below.
Test the claim that the type of team winning is independent of the type of sport. Use Unlock Deck
Unlock for access to all 91 flashcards in this deck.
Unlock Deck
k this deck
27
Perform the indicated hypothesis test. Be sure to do the following: identify the claim and state the null and alternative
hypotheses. Determine the critical value. Calculate the test statistic. Decide to reject or to fail to reject the null
hypothesis and interpret the decision in the context of the original claim.
A researcher is interested in determining if there is a relationship between exercise and blood pressure for
adults over 50. A random sample of 236 adults over 50 is selected and the results are given below. Test the claim that walking and blood pressure are independent. Use
hypotheses. Determine the critical value. Calculate the test statistic. Decide to reject or to fail to reject the null
hypothesis and interpret the decision in the context of the original claim.
A researcher is interested in determining if there is a relationship between exercise and blood pressure for
adults over 50. A random sample of 236 adults over 50 is selected and the results are given below.
Test the claim that walking and blood pressure are independent. Use Unlock Deck
Unlock for access to all 91 flashcards in this deck.
Unlock Deck
k this deck
28
A sports researcher is interested in determining if there is a relationship between the number of home team and visiting team wins and different sports. A random sample of 526 games is selected and the results are given
Below. Find the critical value χ to test the claim that the number of home team and visiting team wins is
Independent of the sport. Use = 0.01.
A)11.345
B)12.838
C)7.815
D)9.348
Below. Find the critical value χ
to test the claim that the number of home team and visiting team wins isIndependent of the sport. Use
= 0.01. A)11.345
B)12.838
C)7.815
D)9.348
Unlock Deck
Unlock for access to all 91 flashcards in this deck.
Unlock Deck
k this deck
29
Find the indicated expected frequency.
A researcher wants to determine whether the number of minutes adults spend online per day is related to gender. A random sample of 315 adults was selected and the results are shown below. Find the expected
Frequency for the cell to determine if there is enough evidence to conclude that the number of minutes
Spent online per day is related to gender. Round to the nearest tenth if necessary.
A)33
B)52.3
C)44
D)69.7
A researcher wants to determine whether the number of minutes adults spend online per day is related to gender. A random sample of 315 adults was selected and the results are shown below. Find the expected
Frequency for the cell
to determine if there is enough evidence to conclude that the number of minutesSpent online per day is related to gender. Round to the nearest tenth if necessary.
A)33
B)52.3
C)44
D)69.7
Unlock Deck
Unlock for access to all 91 flashcards in this deck.
Unlock Deck
k this deck
30
Find the indicated expected frequency.
A sports researcher is interested in determining if there is a relationship between the number of home team and visiting team wins and different sports. A random sample of 526 games is selected and the results are given
Below. Find the expected frequency for tto test the claim that the number of home team and visiting team
Wins are independent of the sport. Round to the nearest tenth if necessary.
A)106.8
B)19.9
C)145.2
D)27.1
A sports researcher is interested in determining if there is a relationship between the number of home team and visiting team wins and different sports. A random sample of 526 games is selected and the results are given
Below. Find the expected frequency for
tto test the claim that the number of home team and visiting teamWins are independent of the sport. Round to the nearest tenth if necessary.
A)106.8
B)19.9
C)145.2
D)27.1
Unlock Deck
Unlock for access to all 91 flashcards in this deck.
Unlock Deck
k this deck
31
A medical researcher is interested in determining if there is a relationship between adults over 50 who walk regularly and low, moderate, and high blood pressure. A random sample of 236 adults over 50 is selected and
The results are given below. Find the critical value χ to test the claim that walking and low, moderate, and
High blood pressure are not related. Use = 0.01.
A)9.210
B)9.348
C)6.251
D)0.584
The results are given below. Find the critical value χ
to test the claim that walking and low, moderate, andHigh blood pressure are not related. Use
= 0.01. A)9.210
B)9.348
C)6.251
D)0.584
Unlock Deck
Unlock for access to all 91 flashcards in this deck.
Unlock Deck
k this deck
32
A researcher wants to determine whether the number of minutes adults spend online per day is related to gender. A random sample of 315 adults was selected and the results are shown below. Find the critical value to determine if there is enough evidence to conclude that the number of minutes spent online per day is
Related to gender. Use = 0.05.
A)7.815
B)9.348
C)11.345
D)6.251
to determine if there is enough evidence to conclude that the number of minutes spent online per day isRelated to gender. Use
= 0.05. A)7.815
B)9.348
C)11.345
D)6.251
Unlock Deck
Unlock for access to all 91 flashcards in this deck.
Unlock Deck
k this deck
33
The contingency table below shows the results of a random sample of 200 state representatives that was conducted to see whether their opinions on a bill are related to their party affiliation. Find the critical value χ , to test the claim of independence using α = 0.05.
A)9.488
B)7.779
C)11.143
D)13.277
Find the critical value χ , to test the claim of independence using α = 0.05.A)9.488
B)7.779
C)11.143
D)13.277
Unlock Deck
Unlock for access to all 91 flashcards in this deck.
Unlock Deck
k this deck
34
Find the marginal frequencies for the given contingency table
The following contingency table was based on a random sample of drivers and classifies drivers by age group and number of accidents in the past three years.
A)
B)
C)
D)
The following contingency table was based on a random sample of drivers and classifies drivers by age group and number of accidents in the past three years.
A)
B)
C)
D)
Unlock Deck
Unlock for access to all 91 flashcards in this deck.
Unlock Deck
k this deck
35
Find the marginal frequencies for the given contingency table
A)
B)
C)
D)
A)
B)
C)
D)
Unlock Deck
Unlock for access to all 91 flashcards in this deck.
Unlock Deck
k this deck
36
Find the indicated expected frequency.
The contingency table below shows the results of a random sample of 400 state representatives that was conducted to see whether their opinions on a bill are related to their party affiliation. Find the expected frequency for the cell Round to the nearest tenth if necessary.
A)55.2
B)45.6
C)93.84
D)34.96
The contingency table below shows the results of a random sample of 400 state representatives that was conducted to see whether their opinions on a bill are related to their party affiliation.
Find the expected frequency for the cell Round to the nearest tenth if necessary.A)55.2
B)45.6
C)93.84
D)34.96
Unlock Deck
Unlock for access to all 91 flashcards in this deck.
Unlock Deck
k this deck
37
Perform the indicated hypothesis test. Be sure to do the following: identify the claim and state the null and alternative
hypotheses. Determine the critical value. Calculate the test statistic. Decide to reject or to fail to reject the null
hypothesis and interpret the decision in the context of the original claim.
A researcher wants to determine whether the time spent online per day is related to gender. A random sample
of 315 adults was selected and the results are shown below. Test the hypothesis that the time spent online per day is related to gender. Use
hypotheses. Determine the critical value. Calculate the test statistic. Decide to reject or to fail to reject the null
hypothesis and interpret the decision in the context of the original claim.
A researcher wants to determine whether the time spent online per day is related to gender. A random sample
of 315 adults was selected and the results are shown below.
Test the hypothesis that the time spent online per day is related to gender. Use Unlock Deck
Unlock for access to all 91 flashcards in this deck.
Unlock Deck
k this deck
38
Find the marginal frequencies for the given contingency table
The table below describes the smoking habits of a group of asthma sufferers.
A)
B)
C)
D)
The table below describes the smoking habits of a group of asthma sufferers.
A)
B)
C)
D)
Unlock Deck
Unlock for access to all 91 flashcards in this deck.
Unlock Deck
k this deck
39
Find the indicated expected frequency.
A medical researcher is interested in determining if there is a relationship between adults over 50 who walk regularly and low, moderate, and high blood pressure. A random sample of 236 adults over 50 is selected and
The results are given below. Find the expected frequency to test the claim that walking and low, moderate,
And high blood pressure are not related. Round to the nearest tenth if necessary.
A)61.3
B)29.9
C)65.7
D)22.7
A medical researcher is interested in determining if there is a relationship between adults over 50 who walk regularly and low, moderate, and high blood pressure. A random sample of 236 adults over 50 is selected and
The results are given below. Find the expected frequency
to test the claim that walking and low, moderate,And high blood pressure are not related. Round to the nearest tenth if necessary.
A)61.3
B)29.9
C)65.7
D)22.7
Unlock Deck
Unlock for access to all 91 flashcards in this deck.
Unlock Deck
k this deck
40
A medical researcher is interested in determining if there is a relationship between adults over 50 who walk regularly and low, moderate, and high blood pressure. A random sample of 236 adults over 50 is selected and
The results are given below. Calculate the chi-square test statistic χ to test the claim that walking and low,
Moderate, and high blood pressure are not related.
A)3.473
B)16.183
C)18.112
D)6.003
The results are given below. Calculate the chi-square test statistic χ
to test the claim that walking and low,Moderate, and high blood pressure are not related.
A)3.473
B)16.183
C)18.112
D)6.003
Unlock Deck
Unlock for access to all 91 flashcards in this deck.
Unlock Deck
k this deck
41
Perform a homogeneity of proportions test to test whether the population proportions are equal. The hypotheses to be
tested are:
H0: The proportions are equal
Ha: At least one of the proportions is different from the others.
Random samples of 400 men and 400 women were obtained and participants were asked whether they
planned to vote in the next election. The results are listed below. Perform a homogeneity of proportions test to
test the claim that the proportion of men who plan to vote in the next election is the same as the proportion of
women who plan to vote. Use = 0.05.
tested are:
H0: The proportions are equal
Ha: At least one of the proportions is different from the others.
Random samples of 400 men and 400 women were obtained and participants were asked whether they
planned to vote in the next election. The results are listed below. Perform a homogeneity of proportions test to
test the claim that the proportion of men who plan to vote in the next election is the same as the proportion of
women who plan to vote. Use
= 0.05. Unlock Deck
Unlock for access to all 91 flashcards in this deck.
Unlock Deck
k this deck
42
Calculate the test statistic F to test the claim that Two samples are randomly selected from populations that are normal. The sample statistics are given below.
A)1.254
B)0.797
C)1.120
D)1.573
Two samples are randomly selected from populations that are normal. The sample statistics are given below. A)1.254
B)0.797
C)1.120
D)1.573
Unlock Deck
Unlock for access to all 91 flashcards in this deck.
Unlock Deck
k this deck
43
Calculate the test statistic F to test the claim that Two samples are randomly selected from populations that are normal. The sample statistics are given below.
A)1.604
B)1.267
C)0.623
D)2.573
Two samples are randomly selected from populations that are normal. The sample statistics are given below. A)1.604
B)1.267
C)0.623
D)2.573
Unlock Deck
Unlock for access to all 91 flashcards in this deck.
Unlock Deck
k this deck
44
Find the critical value to test the claim that Two samples are randomly selected from populations that are normal. The sample statistics are given below. Use α
A)2.46
B)3.66
C)2.95
D)2.40
to test the claim that Two samples are randomly selected from populations that are normal. The sample statistics are given below. Use α A)2.46
B)3.66
C)2.95
D)2.40
Unlock Deck
Unlock for access to all 91 flashcards in this deck.
Unlock Deck
k this deck
45
Find the critical value to test the claim that Two samples are randomly selected from populations that are normal. The sample statistics are given below. Use
A)4.40
B)2.79
C)4.25
D)3.43
to test the claim that Two samples are randomly selected from populations that are normal. The sample statistics are given below. Use A)4.40
B)2.79
C)4.25
D)3.43
Unlock Deck
Unlock for access to all 91 flashcards in this deck.
Unlock Deck
k this deck
46
Calculate the test statistic F to test the claim that Two samples are randomly selected from populations that are normal. The sample statistics are given below.
A)1.073
B)0.932
C)1.036
D)1.151
Two samples are randomly selected from populations that are normal. The sample statistics are given below. A)1.073
B)0.932
C)1.036
D)1.151
Unlock Deck
Unlock for access to all 91 flashcards in this deck.
Unlock Deck
k this deck
47
Perform the indicated hypothesis test. Be sure to do the following: identify the claim and state the null and alternative
hypotheses. Determine the critical value and rejection region. Calculate the test statistic. Decide to reject or to fail to
reject the null hypothesis and interpret the decision in the context of the original claim. Assume that the samples are
independent and that each population has a normal distribution.
Test the claim that Two samples are randomly selected from populations that are normal. The
sample statistics are given below. Use
hypotheses. Determine the critical value and rejection region. Calculate the test statistic. Decide to reject or to fail to
reject the null hypothesis and interpret the decision in the context of the original claim. Assume that the samples are
independent and that each population has a normal distribution.
Test the claim that
Two samples are randomly selected from populations that are normal. Thesample statistics are given below. Use
Unlock Deck
Unlock for access to all 91 flashcards in this deck.
Unlock Deck
k this deck
48
Find the critical value for a one-tailed test using α = 0.05, d.f.N = 6, and d.f.D = 16.
A)2.74
B)3.94
C)2.66
D)2.19
for a one-tailed test using α = 0.05, d.f.N = 6, and d.f.D = 16.A)2.74
B)3.94
C)2.66
D)2.19
Unlock Deck
Unlock for access to all 91 flashcards in this deck.
Unlock Deck
k this deck
49
Perform the indicated hypothesis test. Be sure to do the following: identify the claim and state the null and alternative
hypotheses. Determine the critical value and rejection region. Calculate the test statistic. Decide to reject or to fail to
reject the null hypothesis and interpret the decision in the context of the original claim. Assume that the samples are
independent and that each population has a normal distribution.
Test the claim that Two samples are randomly selected from populations that are normal. The
sample statistics are given below. Use
hypotheses. Determine the critical value and rejection region. Calculate the test statistic. Decide to reject or to fail to
reject the null hypothesis and interpret the decision in the context of the original claim. Assume that the samples are
independent and that each population has a normal distribution.
Test the claim that
Two samples are randomly selected from populations that are normal. Thesample statistics are given below. Use
Unlock Deck
Unlock for access to all 91 flashcards in this deck.
Unlock Deck
k this deck
50
Calculate the test statistic F to test the claim that Two samples are randomly selected from populations that are normal. The sample statistics are given below.
A)2.560
B)1.600
C)0.391
D)6.554
Two samples are randomly selected from populations that are normal. The sample statistics are given below. A)2.560
B)1.600
C)0.391
D)6.554
Unlock Deck
Unlock for access to all 91 flashcards in this deck.
Unlock Deck
k this deck
51
Find the critical value for a two-tailed test using α = 0.05, d.f.N = 5, and d.f.D = 10.
A)4.24
B)4.07
C)4.47
D)6.62
for a two-tailed test using α = 0.05, d.f.N = 5, and d.f.D = 10.A)4.24
B)4.07
C)4.47
D)6.62
Unlock Deck
Unlock for access to all 91 flashcards in this deck.
Unlock Deck
k this deck
52
Perform a homogeneity of proportions test to test whether the population proportions are equal. The hypotheses to be
tested are:
H0: The proportions are equal
Ha: At least one of the proportions is different from the others.
A random sample of 100 students from 5 different colleges was randomly selected, and the number who smoke
was recorded. The results are listed below. Perform a homogeneity of proportions test to test the claim that the
proportion of students who smoke is the same in all 5 colleges. Use
Unlock Deck
Unlock for access to all 91 flashcards in this deck.
Unlock Deck
k this deck
53
Find the critical value to test the claim that Two samples are randomly selected from populations that are normal. The sample statistics are given below. Use
A)2.15
B)2.21
C)2.14
D)2.09
to test the claim that Two samples are randomly selected from populations that are normal. The sample statistics are given below. Use A)2.15
B)2.21
C)2.14
D)2.09
Unlock Deck
Unlock for access to all 91 flashcards in this deck.
Unlock Deck
k this deck
54
Find the critical value for a two-tailed test using α = 0.02, d.f.N = 5, and d.f.D = 10.
A)5.64
B)10.05
C)5.99
D)5.39
for a two-tailed test using α = 0.02, d.f.N = 5, and d.f.D = 10.A)5.64
B)10.05
C)5.99
D)5.39
Unlock Deck
Unlock for access to all 91 flashcards in this deck.
Unlock Deck
k this deck
55
Perform the indicated hypothesis test. Be sure to do the following: identify the claim and state the null and alternative
hypotheses. Determine the critical value and rejection region. Calculate the test statistic. Decide to reject or to fail to
reject the null hypothesis and interpret the decision in the context of the original claim. Assume that the samples are
independent and that each population has a normal distribution.
Test the claim that Two samples are randomly selected from populations that are normal. The
sample statistics are given below. Use
hypotheses. Determine the critical value and rejection region. Calculate the test statistic. Decide to reject or to fail to
reject the null hypothesis and interpret the decision in the context of the original claim. Assume that the samples are
independent and that each population has a normal distribution.
Test the claim that
Two samples are randomly selected from populations that are normal. Thesample statistics are given below. Use
Unlock Deck
Unlock for access to all 91 flashcards in this deck.
Unlock Deck
k this deck
56
Calculate the test statistic F to test the claim that Two samples are randomly selected from populations that are normal. The sample statistics are given below.
A)1.254
B)0.797
C)1.573
D)1.120
Two samples are randomly selected from populations that are normal. The sample statistics are given below. A)1.254
B)0.797
C)1.573
D)1.120
Unlock Deck
Unlock for access to all 91 flashcards in this deck.
Unlock Deck
k this deck
57
Find the critical value for a one-tailed test using α = 0.01, d.f.N = 3, and d.f.D = 20.
A)4.94
B)25.58
C)5.82
D)3.09
for a one-tailed test using α = 0.01, d.f.N = 3, and d.f.D = 20.A)4.94
B)25.58
C)5.82
D)3.09
Unlock Deck
Unlock for access to all 91 flashcards in this deck.
Unlock Deck
k this deck
58
Find the critical value to test the claim that Two samples are randomly selected from populations that are normal. The sample statistics are given below. Use
A)4.01
B)3.18
C)2.62
D)3.67
to test the claim that Two samples are randomly selected from populations that are normal. The sample statistics are given below. Use A)4.01
B)3.18
C)2.62
D)3.67
Unlock Deck
Unlock for access to all 91 flashcards in this deck.
Unlock Deck
k this deck
59
Find the critical value to test the claim that Two samples are randomly selected from populations that are normal. The sample statistics are given below. Use
A)3.59
B)2.45
C)2.92
D)4.56
to test the claim that Two samples are randomly selected from populations that are normal. The sample statistics are given below. Use A)3.59
B)2.45
C)2.92
D)4.56
Unlock Deck
Unlock for access to all 91 flashcards in this deck.
Unlock Deck
k this deck
60
Calculate the test statistic F to test the claim that Two samples are randomly selected from populations that are normal. The sample statistics are given below.
A)2.223
B)1.490
C)4.933
D)0.450
Two samples are randomly selected from populations that are normal. The sample statistics are given below. A)2.223
B)1.490
C)4.933
D)0.450
Unlock Deck
Unlock for access to all 91 flashcards in this deck.
Unlock Deck
k this deck
61
The weights of a random sample of 25 women between the ages of 25 and 34 had a standard deviation of 28
pounds. The weights of a random sample of 41 women between the ages of 55 and 64 had a standard
deviation of 21 pounds. Construct a 95% confidence interval for are the variances of
the weights of women between the ages 25 and 34 and the weights of women between the ages of 55 and 64
respectively.
pounds. The weights of a random sample of 41 women between the ages of 55 and 64 had a standard
deviation of 21 pounds. Construct a 95% confidence interval for
are the variances ofthe weights of women between the ages 25 and 34 and the weights of women between the ages of 55 and 64
respectively.
Unlock Deck
Unlock for access to all 91 flashcards in this deck.
Unlock Deck
k this deck
62
Find the left-tailed and right-tailed critical F-values for a two-tailed test. Let α = 0.02, d.f.N = 7, and
d.f.D = 5.
= 0.02, d.f.N = 7, andd.f.D = 5.
Unlock Deck
Unlock for access to all 91 flashcards in this deck.
Unlock Deck
k this deck
63
Perform the indicated hypothesis test. Be sure to do the following: identify the claim and state the null and alternative
hypotheses. Determine the critical value and rejection region. Calculate the test statistic. Decide to reject or to fail to
reject the null hypothesis and interpret the decision in the context of the original claim. Assume that the samples are
independent and that each population has a normal distribution.
Test the claim that Two samples are randomly selected from populations that are normal. The
sample statistics are given below. Use
hypotheses. Determine the critical value and rejection region. Calculate the test statistic. Decide to reject or to fail to
reject the null hypothesis and interpret the decision in the context of the original claim. Assume that the samples are
independent and that each population has a normal distribution.
Test the claim that
Two samples are randomly selected from populations that are normal. Thesample statistics are given below. Use
Unlock Deck
Unlock for access to all 91 flashcards in this deck.
Unlock Deck
k this deck
64
Perform the indicated hypothesis test. Be sure to do the following: identify the claim and state the null and alternative
hypotheses. Determine the critical value and rejection region. Calculate the test statistic. Decide to reject or to fail to
reject the null hypothesis and interpret the decision in the context of the original claim. Assume that the samples are
independent and that each population has a normal distribution.
The weights of a random sample of 121 women between the ages of 25 and 34 had a standard deviation of 28
pounds. The weights of 121 women between the ages of 55 and 64 had a standard deviation 21 pounds. Test
the claim that the older women are from a population with a standard deviation less than that for women in
the 25 to 34 age group. Use
Unlock Deck
Unlock for access to all 91 flashcards in this deck.
Unlock Deck
k this deck
65
Four different types of fertilizers are used on raspberry plants. The number of raspberries on each randomly selected plant is given below. Find the critical value F0 to test the claim that the type of fertilizer makes no
Difference in the mean number of raspberries per plant. Use
A)4.94
B)4.43
C)26.69
D)4.22
Difference in the mean number of raspberries per plant. Use
A)4.94
B)4.43
C)26.69
D)4.22
Unlock Deck
Unlock for access to all 91 flashcards in this deck.
Unlock Deck
k this deck
66
Perform the indicated hypothesis test. Be sure to do the following: identify the claim and state the null and alternative
hypotheses. Determine the critical value and rejection region. Calculate the test statistic. Decide to reject or to fail to
reject the null hypothesis and interpret the decision in the context of the original claim. Assume that the samples are
independent and that each population has a normal distribution.
A statistics teacher wants to see whether there is a significant difference between the variance of the ages of day
students and the variance of the ages of night students. A random sample of 31 students is selected from each
group. The data are given below. Test the claim that there is no difference between the variances of the two
groups.
Use
Unlock Deck
Unlock for access to all 91 flashcards in this deck.
Unlock Deck
k this deck
67
Perform the indicated hypothesis test. Be sure to do the following: identify the claim and state the null and alternative
hypotheses. Determine the critical value and rejection region. Calculate the test statistic. Decide to reject or to fail to
reject the null hypothesis and interpret the decision in the context of the original claim. Assume that the samples are
independent and that each population has a normal distribution.
At a college, 61 female students were randomly selected and it was found that their monthly income had a
standard deviation of $218.70. For 121 male students, the standard deviation was $303.66. Test the claim that
variance of monthly incomes is higher for male students than it is for female students. Use
Unlock Deck
Unlock for access to all 91 flashcards in this deck.
Unlock Deck
k this deck
68
A medical researcher wishes to try three different techniques to lower blood pressure of patients with high blood pressure. The subjects are randomly selected and assigned to one of three groups. Group 1 is given
Medication, Group 2 is given an exercise program, and Group 3 is assigned a diet program. At the end of six
Weeks, each subjectʹs blood pressure is recorded. Find the critical value to test the claim that there is no
Difference among the means. Use = 0.05.
A)3.68
B)19.43
C)4.77
D)39.43
Medication, Group 2 is given an exercise program, and Group 3 is assigned a diet program. At the end of six
Weeks, each subjectʹs blood pressure is recorded. Find the critical value
to test the claim that there is noDifference among the means. Use
= 0.05. A)3.68
B)19.43
C)4.77
D)39.43
Unlock Deck
Unlock for access to all 91 flashcards in this deck.
Unlock Deck
k this deck
69
Perform the indicated hypothesis test. Be sure to do the following: identify the claim and state the null and alternative
hypotheses. Determine the critical value and rejection region. Calculate the test statistic. Decide to reject or to fail to
reject the null hypothesis and interpret the decision in the context of the original claim. Assume that the samples are
independent and that each population has a normal distribution.
A statistics teacher believes that the variance of test scores of students in her evening statistics class is lower
than the variance of test scores of students in her day class. The results of an exam, given to the day and
evening students, are shown below. Can the teacher conclude that the scores of evening students have a lower
variance? Use
Unlock Deck
Unlock for access to all 91 flashcards in this deck.
Unlock Deck
k this deck
70
Perform the indicated hypothesis test. Be sure to do the following: identify the claim and state the null and alternative
hypotheses. Determine the critical value and rejection region. Calculate the test statistic. Decide to reject or to fail to
reject the null hypothesis and interpret the decision in the context of the original claim. Assume that the samples are
independent and that each population has a normal distribution.
Test the claim that Two samples are randomly selected from populations that are normal. The
sample statistics are given below. Use
hypotheses. Determine the critical value and rejection region. Calculate the test statistic. Decide to reject or to fail to
reject the null hypothesis and interpret the decision in the context of the original claim. Assume that the samples are
independent and that each population has a normal distribution.
Test the claim that
Two samples are randomly selected from populations that are normal. Thesample statistics are given below. Use
Unlock Deck
Unlock for access to all 91 flashcards in this deck.
Unlock Deck
k this deck
71
Find the test statistic F to test the claim that the populations have the same mean.
A)1.403
B)1.021
C)1.182
D)0.832
A)1.403
B)1.021
C)1.182
D)0.832
Unlock Deck
Unlock for access to all 91 flashcards in this deck.
Unlock Deck
k this deck
72
Perform the indicated hypothesis test. Be sure to do the following: identify the claim and state the null and alternative
hypotheses. Determine the critical value and rejection region. Calculate the test statistic. Decide to reject or to fail to
reject the null hypothesis and interpret the decision in the context of the original claim. Assume that the samples are
independent and that each population has a normal distribution.
A random sample of 21 women had blood pressure levels with a variance of 553.6. A random sample of 18 men
had blood pressure levels with a variance of 368.64. Test the claim that the blood pressure levels for women
have a larger variance than those for men. Use
Unlock Deck
Unlock for access to all 91 flashcards in this deck.
Unlock Deck
k this deck
73
Find the left-tailed and right-tailed critical F-values for a two-tailed test. Use the sample statistics below. Let α = 0.05.
α = 0.05. Unlock Deck
Unlock for access to all 91 flashcards in this deck.
Unlock Deck
k this deck
74
Perform the indicated hypothesis test. Be sure to do the following: identify the claim and state the null and alternative
hypotheses. Determine the critical value and rejection region. Calculate the test statistic. Decide to reject or to fail to
reject the null hypothesis and interpret the decision in the context of the original claim. Assume that the samples are
independent and that each population has a normal distribution.
A local bank has the reputation of having a variance in waiting times as low as that of any bank in the area. A
competitor bank in the area checks the waiting time at both banks and claims that its variance of waiting times
is lower than at the local bank. The sample statistics are listed below. Test the competitorʹs claim. Use
Unlock Deck
Unlock for access to all 91 flashcards in this deck.
Unlock Deck
k this deck
75
Perform the indicated hypothesis test. Be sure to do the following: identify the claim and state the null and alternative
hypotheses. Determine the critical value and rejection region. Calculate the test statistic. Decide to reject or to fail to
reject the null hypothesis and interpret the decision in the context of the original claim. Assume that the samples are
independent and that each population has a normal distribution.
A medical researcher suspects that the variance of the pulse rate of smokers is higher than the variance of the
pulse rate of non-smokers. Use the sample statistics below to test the researcherʹs suspicion. Use α = 0.05.
hypotheses. Determine the critical value and rejection region. Calculate the test statistic. Decide to reject or to fail to
reject the null hypothesis and interpret the decision in the context of the original claim. Assume that the samples are
independent and that each population has a normal distribution.
A medical researcher suspects that the variance of the pulse rate of smokers is higher than the variance of the
pulse rate of non-smokers. Use the sample statistics below to test the researcherʹs suspicion. Use
α = 0.05. Unlock Deck
Unlock for access to all 91 flashcards in this deck.
Unlock Deck
k this deck
76
Four different types of fertilizers are used on raspberry plants. The number of raspberries on each randomly selected plant is given below. Find the test statistic F to test the claim that the type of fertilizer makes no
Difference in the mean number of raspberries per plant.
A)8.357
B)8.123
C)7.123
D)6.912
Difference in the mean number of raspberries per plant.
A)8.357
B)8.123
C)7.123
D)6.912
Unlock Deck
Unlock for access to all 91 flashcards in this deck.
Unlock Deck
k this deck
77
A medical researcher wishes to try three different techniques to lower blood pressure of patients with high blood pressure. The subjects are randomly selected and assigned to one of three groups. Group 1 is given
Medication, Group 2 is given an exercise program, and Group 3 is assigned a diet program. At the end of six
Weeks, each subjectʹs blood pressure is recorded. Find the test statistic F to test the claim that there is no
Difference among the means. 949
804
A)11.095
B)9.812
C)8.369
D)12.162
Medication, Group 2 is given an exercise program, and Group 3 is assigned a diet program. At the end of six
Weeks, each subjectʹs blood pressure is recorded. Find the test statistic F to test the claim that there is no
Difference among the means.
949804
A)11.095
B)9.812
C)8.369
D)12.162
Unlock Deck
Unlock for access to all 91 flashcards in this deck.
Unlock Deck
k this deck
78
Perform the indicated hypothesis test. Be sure to do the following: identify the claim and state the null and alternative
hypotheses. Determine the critical value and rejection region. Calculate the test statistic. Decide to reject or to fail to
reject the null hypothesis and interpret the decision in the context of the original claim. Assume that the samples are
independent and that each population has a normal distribution.
A study was conducted to determine if the variances of elementary school teacher salaries from two
neighboring districts were equal. A sample of 25 teachers from each district was selected. The first district had
a standard deviation of = $4830, and the second district had a standard deviation = $4410. Test the claim
that the variances of the salaries from both districts are equal. Use
hypotheses. Determine the critical value and rejection region. Calculate the test statistic. Decide to reject or to fail to
reject the null hypothesis and interpret the decision in the context of the original claim. Assume that the samples are
independent and that each population has a normal distribution.
A study was conducted to determine if the variances of elementary school teacher salaries from two
neighboring districts were equal. A sample of 25 teachers from each district was selected. The first district had
a standard deviation of
= $4830, and the second district had a standard deviation = $4410. Test the claimthat the variances of the salaries from both districts are equal. Use
Unlock Deck
Unlock for access to all 91 flashcards in this deck.
Unlock Deck
k this deck
79
Find the critical -value to test the claim that the populations have the same mean. Use
A)3.47
B)3.210
C)2.819
D)1.892
-value to test the claim that the populations have the same mean. Use A)3.47
B)3.210
C)2.819
D)1.892
Unlock Deck
Unlock for access to all 91 flashcards in this deck.
Unlock Deck
k this deck
80
Perform the indicated hypothesis test. Be sure to do the following: identify the claim and state the null and alternative
hypotheses. Determine the critical value and rejection region. Calculate the test statistic. Decide to reject or to fail to
reject the null hypothesis and interpret the decision in the context of the original claim. Assume that the samples are
independent and that each population has a normal distribution.
A local bank has the reputation of having a variance in waiting times as low as that of any bank in the area. A
competitor bank in the area checks the waiting time at both banks and claims that its variance of waiting times
is lower than at the local bank. The sample statistics are listed below. Test the competitorʹs claim. Use
Unlock Deck
Unlock for access to all 91 flashcards in this deck.
Unlock Deck
k this deck
Unlock Deck
Unlock for access to all 91 flashcards in this deck.


