Deck 6: Confidence Intervals
Full screen (f)
Question
Question
The number of wins in a season for 32 randomly selected professional football teams are listed below.
Construct a 90% confidence interval for the true mean number of wins in a season. Assume that is 2.6.

Construct a 90% confidence interval for the true mean number of wins in a season. Assume that
is 2.6. Question
Question
Question
Question
Question
Question
Question
Question
Question
Question
Question
Question
Question
In a sample of 10 randomly selected women, it was found that their mean height was 63.4 inches. From
previous studies, it is assumed that the standard deviation, is 2.4 inches and that the population of height
measurements is normally distributed.
a)Construct the 99% confidence interval for the population mean height of women.
b)If the sample size was doubled to 20 women, what will be the effect on the confidence interval?
previous studies, it is assumed that the standard deviation,
is 2.4 inches and that the population of heightmeasurements is normally distributed.
a)Construct the 99% confidence interval for the population mean height of women.
b)If the sample size was doubled to 20 women, what will be the effect on the confidence interval?
Question
Question
The numbers of advertisements seen or heard in one week for 30 randomly selected people in the United States
are listed below. Construct a 95% confidence interval for the true mean number of advertisements. Assume
that is 159.5.
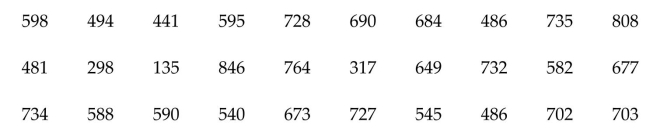
are listed below. Construct a 95% confidence interval for the true mean number of advertisements. Assume
that
is 159.5. Question
Question
Question
Question
Question
A random sample of 200 high school seniors is given the SAT-V test. The mean score for this sample is  = 451.
What can you say about the mean score μ of all high school seniors?
= 451.What can you say about the mean score μ of all high school seniors?
Question
The grade point averages for 10 randomly selected students in a statistics class with 125 students are listed
below. What can you say about the mean score of all 125 students?
below. What can you say about the mean score
of all 125 students? Question
Question
Question
The grade point averages for 10 randomly selected students in a statistics class with 125 students are listed
below. What is the effect on the width of the confidence interval if the sample size is increased to 20? Explain your
reasoning.
below.
What is the effect on the width of the confidence interval if the sample size is increased to 20? Explain yourreasoning.
Question
Question
Question
Question
Question
Question
Question
A certain confidence in interval is  Find the sample mean
  and the error of estimate E.
Find the sample mean and the error of estimate E. Question
Question
Question
Question
Question
Question
Question
Question
Construct a 98% confidence interval for the population mean,  Assume the population has a normal
distribution. A random sample of 20 college students has mean annual earnings of $3140 with a standard
deviation of $686.
Assume the population has a normaldistribution. A random sample of 20 college students has mean annual earnings of $3140 with a standard
deviation of $686.
Question
Question
Question
The numbers of advertisements seen or heard in one week for 30 randomly selected people in the United States
are listed below. Construct a 95% confidence interval for the true mean number of advertisements.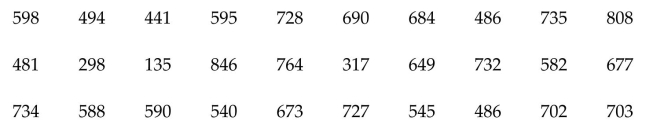
are listed below. Construct a 95% confidence interval for the true mean number of advertisements.
Question
Question
Construct a 95% confidence interval for the population mean,  Assume the population has a normal
distribution. In a random sample of 26 computers, the mean repair cost was $166 with a standard deviation of
$39.
Assume the population has a normaldistribution. In a random sample of 26 computers, the mean repair cost was $166 with a standard deviation of
$39.
Question
a)Construct a 95% confidence interval for the population mean,  Assume the population has a normal
distribution. In a random sample of 26 computers, the mean repair cost was $143 with a standard deviation of
$35.
b)Suppose you did some research on repair costs for computers and found that the standard deviation is σ = 35. Use the normal distribution to construct a 95% confidence interval for the population mean,
  Compare
the results.
Assume the population has a normaldistribution. In a random sample of 26 computers, the mean repair cost was $143 with a standard deviation of
$35.
b)Suppose you did some research on repair costs for computers and found that the standard deviation is
σ = 35. Use the normal distribution to construct a 95% confidence interval for the population mean, Comparethe results.
Question
Question
Question
Question
Question
Question
Question
Question
Question
Question
Question
Question
Question
Question
Question
Question
Question
Question
Question
Question
Question
Question
Question
Question
Question
Question
Question
Question
Question
Question
Question
Question
Question
The number of wins in a season for 32 randomly selected professional football teams are listed below.
Construct a 90% confidence interval for the true mean number of wins in a season.
Construct a 90% confidence interval for the true mean number of wins in a season.

Unlock Deck
Sign up to unlock the cards in this deck!
Unlock Deck
Unlock Deck
1/97
Play
Full screen (f)
Deck 6: Confidence Intervals
1
In a sample of 10 randomly selected women, it was found that their mean height was 63.4 inches. From previous studies, it is assumed that the standard deviation σ is 2.4 and that the population of height
Measurements is normally distributed. Construct the 95% confidence interval for the population mean.
A)(61.9, 64.9)
B)(58.1, 67.3)
C)(59.7, 66.5)
D)(60.8, 65.4)
Measurements is normally distributed. Construct the 95% confidence interval for the population mean.
A)(61.9, 64.9)
B)(58.1, 67.3)
C)(59.7, 66.5)
D)(60.8, 65.4)
(61.9, 64.9)
2
The number of wins in a season for 32 randomly selected professional football teams are listed below.
Construct a 90% confidence interval for the true mean number of wins in a season. Assume that is 2.6.
Construct a 90% confidence interval for the true mean number of wins in a season. Assume that
is 2.6. (7.2, 8.8)
3
A group of 49 randomly selected students has a mean age of 22.4 years. Assume the population standard deviation is 3.8. Construct a 98% confidence interval for the population mean.
A)(21.1, 23.7)
B)(20.3, 24.5)
C)(19.8, 25.1)
D)(18.8, 26.3)
A)(21.1, 23.7)
B)(20.3, 24.5)
C)(19.8, 25.1)
D)(18.8, 26.3)
(21.1, 23.7)
4
In a random sample of 60 computers, the mean repair cost was $150. Assume the population standard deviation is $36. Construct a 90% confidence interval for the population mean.
A)($142, $158)
B)($138, $162)
C)($141, $159)
D)($537, $654)
A)($142, $158)
B)($138, $162)
C)($141, $159)
D)($537, $654)
Unlock Deck
Unlock for access to all 97 flashcards in this deck.
Unlock Deck
k this deck
5
A random sample of 40 students has a mean annual earnings of $3120. Assume the population standard deviation is $677. Construct the confidence interval for the population mean, = 0.95.
A)($2910, $3330)
B)($210, $110)
C)($4812, $5342)
D)($1987, $2346)
A)($2910, $3330)
B)($210, $110)
C)($4812, $5342)
D)($1987, $2346)
Unlock Deck
Unlock for access to all 97 flashcards in this deck.
Unlock Deck
k this deck
6
A random sample of 40 students has a test score with = 81.5. Assume the population standard deviation is 10.2. Construct the confidence interval for the population mean, = 0.90.
A)(78.8, 84.2)
B)(51.8, 92.3)
C)(66.3, 89.1)
D)(71.8, 93.5)
A)(78.8, 84.2)
B)(51.8, 92.3)
C)(66.3, 89.1)
D)(71.8, 93.5)
Unlock Deck
Unlock for access to all 97 flashcards in this deck.
Unlock Deck
k this deck
7
A random sample of 150 students has a grade point average with a mean of 2.86. Assume the population standard deviation is 0.78. Construct the confidence interval for the population mean, if c = 0.98.
A)(2.71, 3.01)
B)(2.51, 3.53)
C)(2.43, 3.79)
D)(2.31, 3.88)
A)(2.71, 3.01)
B)(2.51, 3.53)
C)(2.43, 3.79)
D)(2.31, 3.88)
Unlock Deck
Unlock for access to all 97 flashcards in this deck.
Unlock Deck
k this deck
8
Find the critical value that corresponds to a 94% confidence level.
A)
B)
C)
D)
A)
B)
C)
D)
Unlock Deck
Unlock for access to all 97 flashcards in this deck.
Unlock Deck
k this deck
9
The standard IQ test has a mean of 96 and a standard deviation of 14. We want to be 99% certain that we are within 4 IQ points of the true mean. Determine the required sample size.
A)82
B)10
C)178
D)1
A)82
B)10
C)178
D)1
Unlock Deck
Unlock for access to all 97 flashcards in this deck.
Unlock Deck
k this deck
10
In a recent study of 42 eighth graders, the mean number of hours per week that they watched television was 19.6. Assume the population standard deviation is 5.8 hours. Find the 98% confidence interval for the
Population mean.
A)(17.5, 21.7)
B)(14.1, 23.2)
C)(18.3, 20.9)
D)(19.1, 20.4)
Population mean.
A)(17.5, 21.7)
B)(14.1, 23.2)
C)(18.3, 20.9)
D)(19.1, 20.4)
Unlock Deck
Unlock for access to all 97 flashcards in this deck.
Unlock Deck
k this deck
11
In a recent study of 92 eighth graders, the mean number of hours per week that they watched television was
22.6. Assume the population standard deviation is 5.2 hours.
a)Find the 99% confidence interval of the mean.
b)If the standard deviation is doubled to 10.4, what will be the effect on the confidence interval?
22.6. Assume the population standard deviation is 5.2 hours.
a)Find the 99% confidence interval of the mean.
b)If the standard deviation is doubled to 10.4, what will be the effect on the confidence interval?
Unlock Deck
Unlock for access to all 97 flashcards in this deck.
Unlock Deck
k this deck
12
A random sample of 56 fluorescent light bulbs has a mean life of 645 hours. Assume the population standard deviation is 31 hours. Construct a 95% confidence interval for the population mean.
A)(636.9, 653.1)
B)(539.6, 551.2)
C)(112.0, 118.9)
D)(712.0, 768.0)
A)(636.9, 653.1)
B)(539.6, 551.2)
C)(112.0, 118.9)
D)(712.0, 768.0)
Unlock Deck
Unlock for access to all 97 flashcards in this deck.
Unlock Deck
k this deck
13
Find the margin of error for the given values of c, , and n.
A)0.15
B)0.08
C)0.11
D)0.12
A)0.15
B)0.08
C)0.11
D)0.12
Unlock Deck
Unlock for access to all 97 flashcards in this deck.
Unlock Deck
k this deck
14
In a random sample of 60 computers, the mean repair cost was $150. Assume the population standard
deviation is $36.
a)Construct the 99% confidence interval for the population mean repair cost.
b)If the level of confidence was lowered to 95%, what will be the effect on the confidence interval?
deviation is $36.
a)Construct the 99% confidence interval for the population mean repair cost.
b)If the level of confidence was lowered to 95%, what will be the effect on the confidence interval?
Unlock Deck
Unlock for access to all 97 flashcards in this deck.
Unlock Deck
k this deck
15
In a sample of 10 randomly selected women, it was found that their mean height was 63.4 inches. From
previous studies, it is assumed that the standard deviation, is 2.4 inches and that the population of height
measurements is normally distributed.
a)Construct the 99% confidence interval for the population mean height of women.
b)If the sample size was doubled to 20 women, what will be the effect on the confidence interval?
previous studies, it is assumed that the standard deviation,
is 2.4 inches and that the population of heightmeasurements is normally distributed.
a)Construct the 99% confidence interval for the population mean height of women.
b)If the sample size was doubled to 20 women, what will be the effect on the confidence interval?
Unlock Deck
Unlock for access to all 97 flashcards in this deck.
Unlock Deck
k this deck
16
Find the margin of error for the given values of c, and n.
A)$210
B)$77
C)$2891
D)$7
A)$210
B)$77
C)$2891
D)$7
Unlock Deck
Unlock for access to all 97 flashcards in this deck.
Unlock Deck
k this deck
17
The numbers of advertisements seen or heard in one week for 30 randomly selected people in the United States
are listed below. Construct a 95% confidence interval for the true mean number of advertisements. Assume
that is 159.5.
are listed below. Construct a 95% confidence interval for the true mean number of advertisements. Assume
that
is 159.5. Unlock Deck
Unlock for access to all 97 flashcards in this deck.
Unlock Deck
k this deck
18
A group of 40 bowlers showed that their average score was 192. Assume the population standard deviation is 8. Find the 95% confidence interval of the mean score of all bowlers.
A)(189.5, 194.5)
B)(186.5, 197.5)
C)(188.5, 195.6)
D)(187.3, 196.1)
A)(189.5, 194.5)
B)(186.5, 197.5)
C)(188.5, 195.6)
D)(187.3, 196.1)
Unlock Deck
Unlock for access to all 97 flashcards in this deck.
Unlock Deck
k this deck
19
Find the margin of error for the given values of c, and n.
A)1.73
B)0.16
C)1.05
D)0.94
A)1.73
B)0.16
C)1.05
D)0.94
Unlock Deck
Unlock for access to all 97 flashcards in this deck.
Unlock Deck
k this deck
20
Determine the sampling error if the grade point averages for 10 randomly selected students from a class of 125 students has a mean of = 2.8. Assume the grade point average of the 125 students has a mean of ? = 3.5.
A)0.7
B)3.15
C)-0.7
D)2.45
A)0.7
B)3.15
C)-0.7
D)2.45
Unlock Deck
Unlock for access to all 97 flashcards in this deck.
Unlock Deck
k this deck
21
In order to set rates, an insurance company is trying to estimate the number of sick days that full time workers at an auto repair shop take per year. A previous study indicated that the standard deviation was 2.8 days. How
Large a sample must be selected if the company wants to be 95% confident that the true mean differs from the
Sample mean by no more than 1 day?
A)31
B)141
C)512
D)1024
Large a sample must be selected if the company wants to be 95% confident that the true mean differs from the
Sample mean by no more than 1 day?
A)31
B)141
C)512
D)1024
Unlock Deck
Unlock for access to all 97 flashcards in this deck.
Unlock Deck
k this deck
22
A random sample of 200 high school seniors is given the SAT-V test. The mean score for this sample is = 451.
What can you say about the mean score μ of all high school seniors?
= 451.What can you say about the mean score μ of all high school seniors?
Unlock Deck
Unlock for access to all 97 flashcards in this deck.
Unlock Deck
k this deck
23
The grade point averages for 10 randomly selected students in a statistics class with 125 students are listed
below. What can you say about the mean score of all 125 students?
below. What can you say about the mean score
of all 125 students? Unlock Deck
Unlock for access to all 97 flashcards in this deck.
Unlock Deck
k this deck
24
Construct the indicated confidence interval for the population mean using the t-distribution. c = 0.99, = 22.4, s = 3.8, n = 19
A)(19.9, 24.9)
B)(16.3, 26.9)
C)(17.2, 23.6)
D)(18.7, 24.1)
A)(19.9, 24.9)
B)(16.3, 26.9)
C)(17.2, 23.6)
D)(18.7, 24.1)
Unlock Deck
Unlock for access to all 97 flashcards in this deck.
Unlock Deck
k this deck
25
Construct the indicated confidence interval for the population mean ? using the t-distribution. c = 0.95, = 645, s = 31, n = 16
A)(628.5, 661.5)
B)(876.2, 981.5)
C)(531.2, 612.9)
D)(321.7, 365.8)
A)(628.5, 661.5)
B)(876.2, 981.5)
C)(531.2, 612.9)
D)(321.7, 365.8)
Unlock Deck
Unlock for access to all 97 flashcards in this deck.
Unlock Deck
k this deck
26
The grade point averages for 10 randomly selected students in a statistics class with 125 students are listed
below. What is the effect on the width of the confidence interval if the sample size is increased to 20? Explain your
reasoning.
below.
What is the effect on the width of the confidence interval if the sample size is increased to 20? Explain yourreasoning.
Unlock Deck
Unlock for access to all 97 flashcards in this deck.
Unlock Deck
k this deck
27
Find the value of E, the margin of error, for c = 0.90, n = 10 and s = 3.1.
A)1.80
B)1.36
C)0.57
D)1.78
A)1.80
B)1.36
C)0.57
D)1.78
Unlock Deck
Unlock for access to all 97 flashcards in this deck.
Unlock Deck
k this deck
28
Given the same sample statistics, which level of confidence will produce the narrowest confidence interval:
75%, 85%, 90%, or 95%? Explain your reasoning.
75%, 85%, 90%, or 95%? Explain your reasoning.
Unlock Deck
Unlock for access to all 97 flashcards in this deck.
Unlock Deck
k this deck
29
Find the value of E, the margin of error, for c = 0.95, n = 15 and s = 5.6.
A)3.10
B)3.19
C)2.55
D)0.80
A)3.10
B)3.19
C)2.55
D)0.80
Unlock Deck
Unlock for access to all 97 flashcards in this deck.
Unlock Deck
k this deck
30
Use the confidence interval to find the margin of error and the sample mean. (12, 20)
A)E = 4, = 16
B)E = 88, = 16
C)E = 8, = 12
D)E = 4, = 20
A)E = 4, = 16
B)E = 88, = 16
C)E = 8, = 12
D)E = 4, = 20
Unlock Deck
Unlock for access to all 97 flashcards in this deck.
Unlock Deck
k this deck
31
Find the value of E, the margin of error, for c = 0.99, n = 16 and s = 2.6.
A)1.92
B)0.48
C)1.69
D)0.42
A)1.92
B)0.48
C)1.69
D)0.42
Unlock Deck
Unlock for access to all 97 flashcards in this deck.
Unlock Deck
k this deck
32
Find the critical value, for c = 0.99 and n = 10.
A)3.250
B)3.169
C)2.262
D)1.833
A)3.250
B)3.169
C)2.262
D)1.833
Unlock Deck
Unlock for access to all 97 flashcards in this deck.
Unlock Deck
k this deck
33
A certain confidence in interval is Find the sample mean and the error of estimate E.
Find the sample mean and the error of estimate E. Unlock Deck
Unlock for access to all 97 flashcards in this deck.
Unlock Deck
k this deck
34
Find the critical value, for c = 0.95 and n = 16.
A)2.131
B)2.120
C)2.602
D)2.947
A)2.131
B)2.120
C)2.602
D)2.947
Unlock Deck
Unlock for access to all 97 flashcards in this deck.
Unlock Deck
k this deck
35
In order to set rates, an insurance company is trying to estimate the number of sick days that full time workers
at an auto repair shop take per year. A previous study indicated that the standard deviation was 2.8 days. a)
How large a sample must be selected if the company wants to be 95% confident that the true mean differs from
the sample mean by no more than 1 day? b)Repeat part (a)using a 98% confidence interval. Which level of
confidence requires a larger sample size? Explain.
Unlock Deck
Unlock for access to all 97 flashcards in this deck.
Unlock Deck
k this deck
36
Find the critical value, for c = 0.90 and n = 15.
A)1.761
B)1.753
C)2.145
D)2.624
A)1.761
B)1.753
C)2.145
D)2.624
Unlock Deck
Unlock for access to all 97 flashcards in this deck.
Unlock Deck
k this deck
37
In order to fairly set flat rates for auto mechanics, a shop foreman needs to estimate the average time it takes to replace a fuel pump in a car. How large a sample must he select if he wants to be 99% confident that the true
Average time is within 15 minutes of the sample average? Assume the standard deviation of all times is 30
Minutes.
A)27
B)26
C)6
D)5
Average time is within 15 minutes of the sample average? Assume the standard deviation of all times is 30
Minutes.
A)27
B)26
C)6
D)5
Unlock Deck
Unlock for access to all 97 flashcards in this deck.
Unlock Deck
k this deck
38
A nurse at a local hospital is interested in estimating the birth weight of infants. How large a sample must she select if she desires to be 95% confident that the true mean is within 3 ounces of the sample mean? The
Standard deviation of the birth weights is known to be 6 ounces.
A)16
B)15
C)4
D)3
Standard deviation of the birth weights is known to be 6 ounces.
A)16
B)15
C)4
D)3
Unlock Deck
Unlock for access to all 97 flashcards in this deck.
Unlock Deck
k this deck
39
There were 800 math instructors at a mathematics convention. Forty instructors were randomly selected and
given an IQ test. The scores produced a mean of 130 with a standard deviation of 10. Find a 95% confidence
interval for the mean of the 800 instructors. Use the finite population correction factor.
given an IQ test. The scores produced a mean of 130 with a standard deviation of 10. Find a 95% confidence
interval for the mean of the 800 instructors. Use the finite population correction factor.
Unlock Deck
Unlock for access to all 97 flashcards in this deck.
Unlock Deck
k this deck
40
In order to efficiently bid on a contract, a contractor wants to be 95% confident that his error is less than two hours in estimating the average time it takes to install tile flooring. Previous contracts indicate that the
Standard deviation is 4.5 hours. How large a sample must be selected?
A)20
B)4
C)5
D)19
Standard deviation is 4.5 hours. How large a sample must be selected?
A)20
B)4
C)5
D)19
Unlock Deck
Unlock for access to all 97 flashcards in this deck.
Unlock Deck
k this deck
41
Construct a 98% confidence interval for the population mean, Assume the population has a normal
distribution. A random sample of 20 college students has mean annual earnings of $3140 with a standard
deviation of $686.
Assume the population has a normaldistribution. A random sample of 20 college students has mean annual earnings of $3140 with a standard
deviation of $686.
Unlock Deck
Unlock for access to all 97 flashcards in this deck.
Unlock Deck
k this deck
42
Construct a 99% confidence interval for the population mean, Assume the population has a normal distribution. A group of 19 randomly selected students has a mean age of 22.4 years with a standard deviation
Of 3.8 years.
A)(19.9, 24.9)
B)(16.3, 26.9)
C)(17.2, 23.6)
D)(18.7, 24.1)
Of 3.8 years.
A)(19.9, 24.9)
B)(16.3, 26.9)
C)(17.2, 23.6)
D)(18.7, 24.1)
Unlock Deck
Unlock for access to all 97 flashcards in this deck.
Unlock Deck
k this deck
43
A local bank needs information concerning the checking account balances of its customers. A random sample of 15 accounts was checked. The mean balance was $686.75 with a standard deviation of $256.20. Find a 98%
Confidence interval for the true mean. Assume that the account balances are normally distributed.
A)($513.17, $860.33)
B)($238.23, $326.41)
C)($326.21, $437.90)
D)($487.31, $563.80)
Confidence interval for the true mean. Assume that the account balances are normally distributed.
A)($513.17, $860.33)
B)($238.23, $326.41)
C)($326.21, $437.90)
D)($487.31, $563.80)
Unlock Deck
Unlock for access to all 97 flashcards in this deck.
Unlock Deck
k this deck
44
The numbers of advertisements seen or heard in one week for 30 randomly selected people in the United States
are listed below. Construct a 95% confidence interval for the true mean number of advertisements.
are listed below. Construct a 95% confidence interval for the true mean number of advertisements.
Unlock Deck
Unlock for access to all 97 flashcards in this deck.
Unlock Deck
k this deck
45
Construct a 98% confidence interval for the population mean, Assume the population has a normal distribution. A study of 14 bowlers showed that their average score was 192 with a standard deviation of 8.
A)(186.3, 197.7)
B)(222.3, 256.1)
C)(328.3, 386.9)
D)(115.4, 158.8)
A)(186.3, 197.7)
B)(222.3, 256.1)
C)(328.3, 386.9)
D)(115.4, 158.8)
Unlock Deck
Unlock for access to all 97 flashcards in this deck.
Unlock Deck
k this deck
46
Construct a 95% confidence interval for the population mean, Assume the population has a normal
distribution. In a random sample of 26 computers, the mean repair cost was $166 with a standard deviation of
$39.
Assume the population has a normaldistribution. In a random sample of 26 computers, the mean repair cost was $166 with a standard deviation of
$39.
Unlock Deck
Unlock for access to all 97 flashcards in this deck.
Unlock Deck
k this deck
47
a)Construct a 95% confidence interval for the population mean, Assume the population has a normal
distribution. In a random sample of 26 computers, the mean repair cost was $143 with a standard deviation of
$35.
b)Suppose you did some research on repair costs for computers and found that the standard deviation is σ = 35. Use the normal distribution to construct a 95% confidence interval for the population mean, Compare
the results.
Assume the population has a normaldistribution. In a random sample of 26 computers, the mean repair cost was $143 with a standard deviation of
$35.
b)Suppose you did some research on repair costs for computers and found that the standard deviation is
σ = 35. Use the normal distribution to construct a 95% confidence interval for the population mean, Comparethe results.
Unlock Deck
Unlock for access to all 97 flashcards in this deck.
Unlock Deck
k this deck
48
A random sample of 10 parking meters in a beach community showed the following incomes for a day. Assume the incomes are normally distributed. Find the 95% confidence interval for the true mean.
A)($3.39, $6.01)
B)($2.11, $5.34)
C)($4.81, $6.31)
D)($1.35, $2.85)
A)($3.39, $6.01)
B)($2.11, $5.34)
C)($4.81, $6.31)
D)($1.35, $2.85)
Unlock Deck
Unlock for access to all 97 flashcards in this deck.
Unlock Deck
k this deck
49
Construct a 90% confidence interval for the population mean, Assume the population has a normal distribution. In a recent study of 22 eighth graders, the mean number of hours per week that they watched
Television was 19.6 with a standard deviation of 5.8 hours.
A)(17.47, 21.73)
B)(18.63, 20.89)
C)(5.87, 7.98)
D)(19.62, 23.12)
Television was 19.6 with a standard deviation of 5.8 hours.
A)(17.47, 21.73)
B)(18.63, 20.89)
C)(5.87, 7.98)
D)(19.62, 23.12)
Unlock Deck
Unlock for access to all 97 flashcards in this deck.
Unlock Deck
k this deck
50
A coffee machine is supposed to dispense 12 ounces of coffee in each cup. An inspector selects a random
sample of 40 cups of coffee and finds they have an average amount of 12.2 ounces with a standard deviation of
0.3 ounce. Use a 99% confidence interval to test whether the machine is dispensing acceptable amounts of
coffee.
sample of 40 cups of coffee and finds they have an average amount of 12.2 ounces with a standard deviation of
0.3 ounce. Use a 99% confidence interval to test whether the machine is dispensing acceptable amounts of
coffee.
Unlock Deck
Unlock for access to all 97 flashcards in this deck.
Unlock Deck
k this deck
51
Construct a 90% confidence interval for the population mean, Assume the population has a normal distribution. A sample of 15 randomly selected students has a grade point average of 2.86 with a standard
Deviation of 0.78.
A)(2.51, 3.21)
B)(2.41, 3.42)
C)(2.37, 3.56)
D)(2.28, 3.66)
Deviation of 0.78.
A)(2.51, 3.21)
B)(2.41, 3.42)
C)(2.37, 3.56)
D)(2.28, 3.66)
Unlock Deck
Unlock for access to all 97 flashcards in this deck.
Unlock Deck
k this deck
52
Construct a 95% confidence interval for the population mean, Assume the population has a normal distribution. A sample of 25 randomly selected students has a mean test score of 81.5 with a standard deviation
Of 10.2.
A)(77.29, 85.71)
B)(56.12, 78.34)
C)(66.35, 69.89)
D)(87.12, 98.32)
Of 10.2.
A)(77.29, 85.71)
B)(56.12, 78.34)
C)(66.35, 69.89)
D)(87.12, 98.32)
Unlock Deck
Unlock for access to all 97 flashcards in this deck.
Unlock Deck
k this deck
53
A random sample of 15 statistics textbooks has a mean price of $105 with a standard deviation of $30.25. Determine whether a normal distribution or a t-distribution should be used or whether neither of these can be
Used to construct a confidence interval. Assume the distribution of statistics textbook prices is not normally
Distributed.
A)Cannot use normal distribution or t-distribution.
B)Use normal distribution.
C)Use the t-distribution.
Used to construct a confidence interval. Assume the distribution of statistics textbook prices is not normally
Distributed.
A)Cannot use normal distribution or t-distribution.
B)Use normal distribution.
C)Use the t-distribution.
Unlock Deck
Unlock for access to all 97 flashcards in this deck.
Unlock Deck
k this deck
54
For a sample of 20 IQ scores the mean score is 105.8. The standard deviation, is 15. Determine whether a normal distribution or a t-distribution should be used or whether neither of these can be used to construct a
Confidence interval. Assume that IQ scores are normally distributed.
A)Use normal distribution.
B)Use the t-distribution.
C)Cannot use normal distribution or t-distribution.
Confidence interval. Assume that IQ scores are normally distributed.
A)Use normal distribution.
B)Use the t-distribution.
C)Cannot use normal distribution or t-distribution.
Unlock Deck
Unlock for access to all 97 flashcards in this deck.
Unlock Deck
k this deck
55
In a random sample of 28 families, the average weekly food expense was $95.60 with a standard deviation of $22.50. Determine whether a normal distribution or a t-distribution should be used or whether neither of these
Can be used to construct a confidence interval. Assume the distribution of weekly food expenses is normally
Shaped.
A)Use the t-distribution.
B)Use normal distribution.
C)Cannot use normal distribution or t-distribution.
Can be used to construct a confidence interval. Assume the distribution of weekly food expenses is normally
Shaped.
A)Use the t-distribution.
B)Use normal distribution.
C)Cannot use normal distribution or t-distribution.
Unlock Deck
Unlock for access to all 97 flashcards in this deck.
Unlock Deck
k this deck
56
The grade point averages for 10 randomly selected high school students are listed below. Assume the grade point averages are normally distributed. Find a 98% confidence interval for the true mean.
A)(1.55, 3.53)
B)(0.67, 1.81)
C)(2.12, 3.14)
D)(3.11, 4.35)
A)(1.55, 3.53)
B)(0.67, 1.81)
C)(2.12, 3.14)
D)(3.11, 4.35)
Unlock Deck
Unlock for access to all 97 flashcards in this deck.
Unlock Deck
k this deck
57
Construct a 95% confidence interval for the population mean, Assume the population has a normal distribution. A sample of 20 college students had mean annual earnings of $3120 with a standard deviation of
$677.
A)($2803, $3437)
B)($1324, $1567)
C)($2135, $2567)
D)($2657, $2891)
$677.
A)($2803, $3437)
B)($1324, $1567)
C)($2135, $2567)
D)($2657, $2891)
Unlock Deck
Unlock for access to all 97 flashcards in this deck.
Unlock Deck
k this deck
58
A manufacturer receives an order for fluorescent light bulbs. The order requires that the bulbs have a mean life
span of 850 hours. The manufacturer selects a random sample of 25 fluorescent light bulbs and finds that they
have a mean life span of 845 hours with a standard deviation of 15 hours. Test to see if the manufacturer is
making acceptable light bulbs. Use a 95% confidence level. Assume the data are normally distributed.
Unlock Deck
Unlock for access to all 97 flashcards in this deck.
Unlock Deck
k this deck
59
Construct a 95% confidence interval for the population mean, Assume the population has a normal distribution. A random sample of 16 fluorescent light bulbs has a mean life of 645 hours with a standard
Deviation of 31 hours.
A)(628.5, 661.5)
B)(876.2, 981.5)
C)(531.2, 612.9)
D)(321.7, 365.8)
Deviation of 31 hours.
A)(628.5, 661.5)
B)(876.2, 981.5)
C)(531.2, 612.9)
D)(321.7, 365.8)
Unlock Deck
Unlock for access to all 97 flashcards in this deck.
Unlock Deck
k this deck
60
A random sample of 40 college students has a mean earnings of $3120 with a standard deviation of $677 over the summer months. Determine whether a normal distribution or a t-distribution should be used or whether
Neither of these can be used to construct a confidence interval.
A)Use normal distribution.
B)Use the t-distribution.
C)Cannot use normal distribution or t-distribution.
Neither of these can be used to construct a confidence interval.
A)Use normal distribution.
B)Use the t-distribution.
C)Cannot use normal distribution or t-distribution.
Unlock Deck
Unlock for access to all 97 flashcards in this deck.
Unlock Deck
k this deck
61
A manufacturer of golf equipment wishes to estimate the number of left-handed golfers. How large a sample is needed in order to be 95% confident that the sample proportion will not differ from the true proportion by
More than 4%? A previous study indicates that the proportion of left-handed golfers is 9%.
A)197
B)139
C)217
D)19
More than 4%? A previous study indicates that the proportion of left-handed golfers is 9%.
A)197
B)139
C)217
D)19
Unlock Deck
Unlock for access to all 97 flashcards in this deck.
Unlock Deck
k this deck
62
When 490 college students were surveyed, 130 said they own their car. Construct a 95% confidence interval for
the proportion of college students who say they own their cars.
the proportion of college students who say they own their cars.
Unlock Deck
Unlock for access to all 97 flashcards in this deck.
Unlock Deck
k this deck
63
A researcher at a major hospital wishes to estimate the proportion of the adult population of the United States that has high blood pressure. How large a sample is needed in order to be 90% confident that the sample
Proportion will not differ from the true proportion by more than 5%?
A)271
B)9
C)542
D)164
Proportion will not differ from the true proportion by more than 5%?
A)271
B)9
C)542
D)164
Unlock Deck
Unlock for access to all 97 flashcards in this deck.
Unlock Deck
k this deck
64
A survey of 2210 golfers showed that 389 of them are left-handed. Find a point estimate for p, the population proportion of golfers that are left-handed.
A)0.176
B)0.824
C)0.214
D)0.150
A)0.176
B)0.824
C)0.214
D)0.150
Unlock Deck
Unlock for access to all 97 flashcards in this deck.
Unlock Deck
k this deck
65
In a survey of 2480 golfers, 15% said they were left-handed. The surveyʹs margin of error was 3%. Construct a confidence interval for the proportion of left-handed golfers.
A)(0.12, 0.18)
B)(0.18, 0.21)
C)(0.12, 0.15)
D)(0.11, 0.19)
A)(0.12, 0.18)
B)(0.18, 0.21)
C)(0.12, 0.15)
D)(0.11, 0.19)
Unlock Deck
Unlock for access to all 97 flashcards in this deck.
Unlock Deck
k this deck
66
In a survey of 10 golfers, 2 were found to be left-handed. Is it practical to construct the 90% confidence interval
for the population proportion, p? Explain.
for the population proportion, p? Explain.
Unlock Deck
Unlock for access to all 97 flashcards in this deck.
Unlock Deck
k this deck
67
A survey of 300 fatal accidents showed that 123 were alcohol related. Construct a 98% confidence interval for
the proportion of fatal accidents that were alcohol related.
the proportion of fatal accidents that were alcohol related.
Unlock Deck
Unlock for access to all 97 flashcards in this deck.
Unlock Deck
k this deck
68
The USA Today claims that 44% of adults who access the Internet read the international news online. You
want to check the accuracy of their claim by surveying a random sample of 120 adults who access the Internet
and asking them if they read the international news online. Fifty-two adults responded ʺyes.ʺ Use a 95%
confidence interval to test the newspaperʹs claim.
want to check the accuracy of their claim by surveying a random sample of 120 adults who access the Internet
and asking them if they read the international news online. Fifty-two adults responded ʺyes.ʺ Use a 95%
confidence interval to test the newspaperʹs claim.
Unlock Deck
Unlock for access to all 97 flashcards in this deck.
Unlock Deck
k this deck
69
A survey of 700 non-fatal accidents showed that 231 involved the use of a cell phone. Find a point estimate for p, the population proportion of non-fatal accidents that involved the use of a cell phone.
A)0.330
B)0.670
C)0.493
D)0.248
A)0.330
B)0.670
C)0.493
D)0.248
Unlock Deck
Unlock for access to all 97 flashcards in this deck.
Unlock Deck
k this deck
70
A pollster wishes to estimate the proportion of United States voters who favor capital punishment. How large a sample is needed in order to be 98% confident that the sample proportion will not differ from the true
Proportion by more than 3%?
A)1509
B)1068
C)20
D)3017
Proportion by more than 3%?
A)1509
B)1068
C)20
D)3017
Unlock Deck
Unlock for access to all 97 flashcards in this deck.
Unlock Deck
k this deck
71
A researcher wishes to estimate the number of households with two cars. How large a sample is needed in order to be 95% confident that the sample proportion will not differ from the true proportion by more than 5%?
A previous study indicates that the proportion of households with two cars is 22%.
A)264
B)186
C)339
D)4
A previous study indicates that the proportion of households with two cars is 22%.
A)264
B)186
C)339
D)4
Unlock Deck
Unlock for access to all 97 flashcards in this deck.
Unlock Deck
k this deck
72
A survey of 100 fatal accidents showed that 16 were alcohol related. Find a point estimate for p, the population proportion of accidents that were alcohol related.
A)0.16
B)0.84
C)0.190
D)0.138
A)0.16
B)0.84
C)0.190
D)0.138
Unlock Deck
Unlock for access to all 97 flashcards in this deck.
Unlock Deck
k this deck
73
A survey of 400 non-fatal accidents showed that 181 involved the use of a cell phone. Construct a 99%
confidence interval for the proportion of fatal accidents that involved the use of a cell phone.
confidence interval for the proportion of fatal accidents that involved the use of a cell phone.
Unlock Deck
Unlock for access to all 97 flashcards in this deck.
Unlock Deck
k this deck
74
A private opinion poll is conducted for a politician to determine what proportion of the population favors decriminalizing marijuana possession. How large a sample is needed in order to be 95% confident that the
Sample proportion will not differ from the true proportion by more than 4%?
A)601
B)423
C)1201
D)13
Sample proportion will not differ from the true proportion by more than 4%?
A)601
B)423
C)1201
D)13
Unlock Deck
Unlock for access to all 97 flashcards in this deck.
Unlock Deck
k this deck
75
A survey of 250 homeless persons showed that 11 were veterans. Find a point estimate p, for the population proportion of homeless persons who are veterans.
A)0.044
B)0.956
C)0.046
D)0.042
A)0.044
B)0.956
C)0.046
D)0.042
Unlock Deck
Unlock for access to all 97 flashcards in this deck.
Unlock Deck
k this deck
76
A survey of 280 homeless persons showed that 63 were veterans. Construct a 90% confidence interval for the proportion of homeless persons who are veterans.
A)(0.184, 0.266)
B)(0.176, 0.274)
C)(0.167, 0.283)
D)(0.161, 0.289)
A)(0.184, 0.266)
B)(0.176, 0.274)
C)(0.167, 0.283)
D)(0.161, 0.289)
Unlock Deck
Unlock for access to all 97 flashcards in this deck.
Unlock Deck
k this deck
77
When 410 college students were surveyed,150 said they own their car. Find a point estimate for p, the population proportion of students who own their cars.
A)0.366
B)0.634
C)0.577
D)0.268
A)0.366
B)0.634
C)0.577
D)0.268
Unlock Deck
Unlock for access to all 97 flashcards in this deck.
Unlock Deck
k this deck
78
The Federal Bureau of Labor Statistics surveyed 50,000 people and found the unemployment rate to be 5.8%.
The margin of error was 0.2%. Construct a confidence interval for the unemployment rate.
The margin of error was 0.2%. Construct a confidence interval for the unemployment rate.
Unlock Deck
Unlock for access to all 97 flashcards in this deck.
Unlock Deck
k this deck
79
A survey of 2450 golfers showed that 281 of them are left-handed. Construct a 98% confidence interval for the proportion of golfers that are left-handed.
A)(0.100, 0.130)
B)(0.203, 0.293)
C)(0.369, 0.451)
D)(0.683, 0.712)
A)(0.100, 0.130)
B)(0.203, 0.293)
C)(0.369, 0.451)
D)(0.683, 0.712)
Unlock Deck
Unlock for access to all 97 flashcards in this deck.
Unlock Deck
k this deck
80
The number of wins in a season for 32 randomly selected professional football teams are listed below.
Construct a 90% confidence interval for the true mean number of wins in a season.
Construct a 90% confidence interval for the true mean number of wins in a season.
Unlock Deck
Unlock for access to all 97 flashcards in this deck.
Unlock Deck
k this deck
Unlock Deck
Unlock for access to all 97 flashcards in this deck.


