Deck 6: The Normal Distribution
Full screen (f)
Question
The following formula can be used to find a specific value in a normal population: 
Question
Question
Question
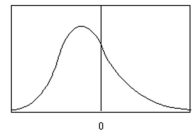 The figure below is an example of a negatively skewed distribution.
 Question
Question
Question
Question
Question
The z value that corresponds to the  percentile is z = 1.72.
percentile is z = 1.72. Question
Question
Question
Question
The  is 0.4878.
is 0.4878. Question
Question
Question
Question
Question
Question
Question
Question
Question
Question
Question
Question
Question
Question
Question
Question
Question
Question
Question
Question
Question
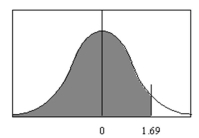 Find the area under the curve to the left of z = 1.69.
A)0.4545
B)0.4452
C)0.9545
D)0.9452
Question
Question
In the figure below, what is the area under the curve between z = 1.50 and z = 2.50? 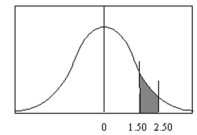
A)0.0802
B)0.0606
C)0.0764
D)1.00
A)0.0802
B)0.0606
C)0.0764
D)1.00
Question
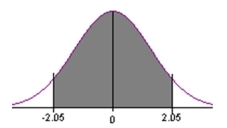 Find the area under the curve between z = -2.05 and z = 2.05.
A)0.4938
B)0.4798
C)0.9596
D)0.9876
Question
Using the normal distribution curve shown in the figure below, find the area under the curve between z = 0 and z = -2.16? 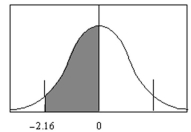
A)-0.4821
B)0.4821
C)-0.4846
D)0.4846
A)-0.4821
B)0.4821
C)-0.4846
D)0.4846
Question
Question
Question
Question
Question
If X is a normal random variable with mean 5, and if the probability that X is more than 4.08 is .5910 (as shown below), then what is the standard deviation of X? (Note: the diagram is not necessarily to scale.)
A)4.00
B)2.67
C)2.00
D)1.00
A)4.00
B)2.67
C)2.00
D)1.00
Question
If X is a normal random variable with mean 4, and if the probability that X is less than 5.54 is .67 (as shown below), then what is the standard deviation of X? (Note: the diagram is not necessarily to scale.)

A)1.75
B)3.50
C)4.20
D)12.25
A)1.75
B)3.50
C)4.20
D)12.25
Question
Question
Question
Question
Question
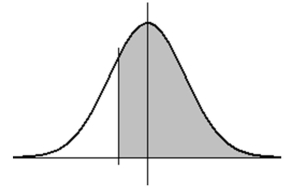
If X is a normal random variable with standard deviation 2.50, and if the probability that X is more than 5.95 is .1271 (as shown below), then what is the mean of X? (Note: the diagram is not necessarily to scale.) 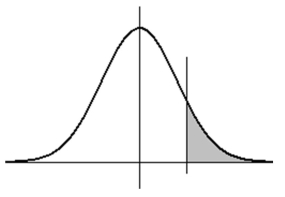
A)5.8
B)5.0
C)4.7
D)3.1
A)5.8
B)5.0
C)4.7
D)3.1
Question
Question
Question
Question
Question
Question
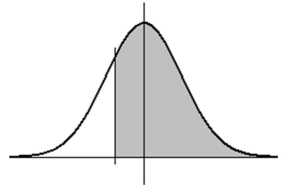
If X is a normal random variable with mean 6 and standard deviation 3.0, then find the value x such that P(Z < x) is equal to .86, as shown below.(Note: the diagram is not necessarily to scale.) 
A)9.24
B)7.32
C)6.66
D)6.00
A)9.24
B)7.32
C)6.66
D)6.00
Question
Question
If X is a normal random variable with mean 9 and standard deviation 2.5, then find the value x such that P(Z > x) is equal to .7054, as shown below.(Note: the diagram is not necessarily to scale.)
A)8.10
B)8.33
C)7.65
D)11.10
A)8.10
B)8.33
C)7.65
D)11.10
Question
Question
Question
If X is a normal random variable with standard deviation 3.00, and if the probability that X is less than 7.64 is .648 (as shown below), then what is the mean of X? (Note: the diagram is not necessarily to scale.) 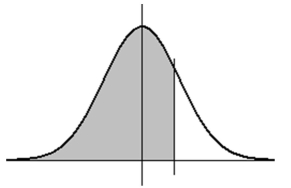
A)5.6
B)6.0
C)6.2
D)6.5
A)5.6
B)6.0
C)6.2
D)6.5
Question
Question
Question
Question
Question
Question
Question
Question
Question
Question
Question
Question
Question
Question
Question
Question
Question
Question
Question
As the sample size n increases, the shape of the distribution of the sample means taken with replacement
from a population with mean and standard deviation of will
approach a normal distribution.This distribution will have a mean of and a
standard deviation of . This statement summarizes the __________.
________________________________________
from a population with mean and standard deviation of will
approach a normal distribution.This distribution will have a mean of and a
standard deviation of .
This statement summarizes the __________.________________________________________
Question
What is the z value to the right of the mean such that 85% of the total area lies to the left of it as shown in
the figure below?
the figure below?

Unlock Deck
Sign up to unlock the cards in this deck!
Unlock Deck
Unlock Deck
1/81
Play
Full screen (f)
Deck 6: The Normal Distribution
1
The following formula can be used to find a specific value in a normal population:
True
2
The area under the curve is always positive even if the z value is negative.
True
3
The z value corresponding to 48.81% of the data is 2.20 in Table E of Appendix
False
4
The figure below is an example of a negatively skewed distribution. Unlock Deck
Unlock for access to all 81 flashcards in this deck.
Unlock Deck
k this deck
5
A random sample of size 4 is selected from population A which has a standard deviation of 6 and a
random sample of size 16 is selected from population B which has a standard deviation of 10.The
standard error of the mean for the sample from population A is smaller than that for the sample from
population
random sample of size 16 is selected from population B which has a standard deviation of 10.The
standard error of the mean for the sample from population A is smaller than that for the sample from
population
Unlock Deck
Unlock for access to all 81 flashcards in this deck.
Unlock Deck
k this deck
6
Which of the following properties does not apply to a theoretical normal distribution?
A)The normal distribution is bell-shaped.
B)The mean, median, and mode are equal.
C)The normal distribution is bimodal.
D)The curve never touches the x-axis.
A)The normal distribution is bell-shaped.
B)The mean, median, and mode are equal.
C)The normal distribution is bimodal.
D)The curve never touches the x-axis.
Unlock Deck
Unlock for access to all 81 flashcards in this deck.
Unlock Deck
k this deck
7
The area under the normal distribution curve that lies within three standard deviations of the mean is
approximately 95%.
approximately 95%.
Unlock Deck
Unlock for access to all 81 flashcards in this deck.
Unlock Deck
k this deck
8
On an easy test, the mean score was 97 out of a possible 100 points.The distribution of all test scores is mostly likely to be
A)symmetric
B)negatively skewed
C)positively skewed
D)diagonally skewed
A)symmetric
B)negatively skewed
C)positively skewed
D)diagonally skewed
Unlock Deck
Unlock for access to all 81 flashcards in this deck.
Unlock Deck
k this deck
9
The z value that corresponds to the percentile is z = 1.72.
percentile is z = 1.72. Unlock Deck
Unlock for access to all 81 flashcards in this deck.
Unlock Deck
k this deck
10
The total area under the normal distribution curve is approximately 0.99 but can never be equal to 1.0.
Unlock Deck
Unlock for access to all 81 flashcards in this deck.
Unlock Deck
k this deck
11
In applied statistics, the area under the normal distribution curve is more important than the
frequencies.
frequencies.
Unlock Deck
Unlock for access to all 81 flashcards in this deck.
Unlock Deck
k this deck
12
The standard deviation of sample means will be larger than the standard deviation of the population, and
it will be equal to the population standard deviation multiplied by the square root of the sample size.
it will be equal to the population standard deviation multiplied by the square root of the sample size.
Unlock Deck
Unlock for access to all 81 flashcards in this deck.
Unlock Deck
k this deck
13
The is 0.4878.
is 0.4878. Unlock Deck
Unlock for access to all 81 flashcards in this deck.
Unlock Deck
k this deck
14
Give the type of distribution pattern that occurs when the majority of the data values fall to the left of the mean?
A)symmetrical
B)positively skewed
C)negatively skewed
D)left skewed
A)symmetrical
B)positively skewed
C)negatively skewed
D)left skewed
Unlock Deck
Unlock for access to all 81 flashcards in this deck.
Unlock Deck
k this deck
15
If one wishes to compute the probability that the mean of sample selected from a normal population is
less than a particular value, one should correct for continuity if the sample size is less than 30.
less than a particular value, one should correct for continuity if the sample size is less than 30.
Unlock Deck
Unlock for access to all 81 flashcards in this deck.
Unlock Deck
k this deck
16
The normal distribution curve can be used as a probability distribution curve for normally distributed
variables.
variables.
Unlock Deck
Unlock for access to all 81 flashcards in this deck.
Unlock Deck
k this deck
17
The area under the normal distribution curve that lies within three standard deviations of the mean is
approximately 95%.
approximately 95%.
Unlock Deck
Unlock for access to all 81 flashcards in this deck.
Unlock Deck
k this deck
18
When the majority of the data values fall to the right of the mean, the distribution is said to be left
skewed.
skewed.
Unlock Deck
Unlock for access to all 81 flashcards in this deck.
Unlock Deck
k this deck
19
The area to the right z = 1.83 of is 0.4256.
Unlock Deck
Unlock for access to all 81 flashcards in this deck.
Unlock Deck
k this deck
20
When finding the area under the curve between two z values, the procedure is to subtract the two z values
and look up the corresponding area in Table E of Appendix
and look up the corresponding area in Table E of Appendix
Unlock Deck
Unlock for access to all 81 flashcards in this deck.
Unlock Deck
k this deck
21
For a normal curve with mean 5 and standard deviation 7, which of the following parts of the normal curve will have an area of approximately 68%?
A)from 1.5 to 8.5
B)from -2 to 12
C)from 5 to 19
D)from -9 to 19
A)from 1.5 to 8.5
B)from -2 to 12
C)from 5 to 19
D)from -9 to 19
Unlock Deck
Unlock for access to all 81 flashcards in this deck.
Unlock Deck
k this deck
22
Find the probability P(z > -0.74) using the standard normal distribution.
A)0.2296
B)0.7704
C)0.7296
D)0.2600
A)0.2296
B)0.7704
C)0.7296
D)0.2600
Unlock Deck
Unlock for access to all 81 flashcards in this deck.
Unlock Deck
k this deck
23
What is the special property of the standard normal distribution?
A)The mean is 0 and the standard deviation is 1.
B)The total area under the normal distribution curve is equal to 1.00.
C)The curve is continuous.
D)The mean is located at the center of the distribution.
A)The mean is 0 and the standard deviation is 1.
B)The total area under the normal distribution curve is equal to 1.00.
C)The curve is continuous.
D)The mean is located at the center of the distribution.
Unlock Deck
Unlock for access to all 81 flashcards in this deck.
Unlock Deck
k this deck
24
For a normal curve with mean 6 and standard deviation 3, which of the following parts of the normal curve will have an area of approximately 34%?
A)from 4.5 to 7.5
B)from 3 to 9
C)from 6 to 9
D)from 0 to 12
A)from 4.5 to 7.5
B)from 3 to 9
C)from 6 to 9
D)from 0 to 12
Unlock Deck
Unlock for access to all 81 flashcards in this deck.
Unlock Deck
k this deck
25
For a normal distribution with mean 4 and standard deviation 4, the value 8 has a z value of
A)-1
B)1
C)2
D)3
A)-1
B)1
C)2
D)3
Unlock Deck
Unlock for access to all 81 flashcards in this deck.
Unlock Deck
k this deck
26
Find the probability P(z < -0.31) using the standard normal distribution.
A)0.6217
B)0.3783
C)0.8783
D)0.6900
A)0.6217
B)0.3783
C)0.8783
D)0.6900
Unlock Deck
Unlock for access to all 81 flashcards in this deck.
Unlock Deck
k this deck
27
Find the probability P(z > 0.78) using the standard normal distribution.
A)0.2200
B)0.7823
C)0.7177
D)0.2177
A)0.2200
B)0.7823
C)0.7177
D)0.2177
Unlock Deck
Unlock for access to all 81 flashcards in this deck.
Unlock Deck
k this deck
28
Find the probability P(Z < 0.22) using the standard normal distribution.
A)0.7800
B)0.4129
C)0.5871
A)0.7800
B)0.4129
C)0.5871
Unlock Deck
Unlock for access to all 81 flashcards in this deck.
Unlock Deck
k this deck
29
If a normal distribution has mean 16 and standard deviation 6, then
A)the median is 16 and the mode is 16
B)the median is 10 and the mode is 22
C)the median is 22 and the mode is 10
D)the median is 16 and the mode is 22
A)the median is 16 and the mode is 16
B)the median is 10 and the mode is 22
C)the median is 22 and the mode is 10
D)the median is 16 and the mode is 22
Unlock Deck
Unlock for access to all 81 flashcards in this deck.
Unlock Deck
k this deck
30
One normal curve has mean 22 and standard deviation 4, a second normal curve has mean 4 and standard deviation 8.The curve that is more dispersed, or spread out, is
A)The first normal curve
B)The second normal curve
C)They are equally spread out
D)There is insufficient information to answer the question
A)The first normal curve
B)The second normal curve
C)They are equally spread out
D)There is insufficient information to answer the question
Unlock Deck
Unlock for access to all 81 flashcards in this deck.
Unlock Deck
k this deck
31
If the scores for a test have a mean of 70 and a standard deviation of 12, find the percentage of scores that will fall below 50.
A)4.75%
B)45.54%
C)42.07%
D)35.54%
A)4.75%
B)45.54%
C)42.07%
D)35.54%
Unlock Deck
Unlock for access to all 81 flashcards in this deck.
Unlock Deck
k this deck
32
Find the probability P(0.21 < z < 1.28) using the standard normal distribution.
A)0.3166
B)0.6834
C)0.8166
D)0.4100
A)0.3166
B)0.6834
C)0.8166
D)0.4100
Unlock Deck
Unlock for access to all 81 flashcards in this deck.
Unlock Deck
k this deck
33
For a normal distribution with mean -12 and standard deviation 4, the value -16 has a z value of
A)1
B)-3
C)-2
D)-1
A)1
B)-3
C)-2
D)-1
Unlock Deck
Unlock for access to all 81 flashcards in this deck.
Unlock Deck
k this deck
34
Find the area under the curve to the left of z = 1.69.A)0.4545
B)0.4452
C)0.9545
D)0.9452
Unlock Deck
Unlock for access to all 81 flashcards in this deck.
Unlock Deck
k this deck
35
Give the term for the number of standard deviations that a particular X value is away from the mean.
A)z value
B)discrete value
C)continuous value
D)y value
A)z value
B)discrete value
C)continuous value
D)y value
Unlock Deck
Unlock for access to all 81 flashcards in this deck.
Unlock Deck
k this deck
36
In the figure below, what is the area under the curve between z = 1.50 and z = 2.50?
A)0.0802
B)0.0606
C)0.0764
D)1.00
A)0.0802
B)0.0606
C)0.0764
D)1.00
Unlock Deck
Unlock for access to all 81 flashcards in this deck.
Unlock Deck
k this deck
37
Find the area under the curve between z = -2.05 and z = 2.05.A)0.4938
B)0.4798
C)0.9596
D)0.9876
Unlock Deck
Unlock for access to all 81 flashcards in this deck.
Unlock Deck
k this deck
38
Using the normal distribution curve shown in the figure below, find the area under the curve between z = 0 and z = -2.16?
A)-0.4821
B)0.4821
C)-0.4846
D)0.4846
A)-0.4821
B)0.4821
C)-0.4846
D)0.4846
Unlock Deck
Unlock for access to all 81 flashcards in this deck.
Unlock Deck
k this deck
39
Find the probability P(-0.77 < z < -0.16) using the standard normal distribution.
A)0.0400
B)0.7842
C)0.3458
D)0.2158
A)0.0400
B)0.7842
C)0.3458
D)0.2158
Unlock Deck
Unlock for access to all 81 flashcards in this deck.
Unlock Deck
k this deck
40
Find the probability P(-1.09 < z < 1.06) using the standard normal distribution.
A)0.8410
B)0.2824
C)0.7175
D)0.6744
A)0.8410
B)0.2824
C)0.7175
D)0.6744
Unlock Deck
Unlock for access to all 81 flashcards in this deck.
Unlock Deck
k this deck
41
What z value corresponds to 17% of the data between the mean and the z value?
A)1.25
B)0.44
C)0.52
D)2.10
A)1.25
B)0.44
C)0.52
D)2.10
Unlock Deck
Unlock for access to all 81 flashcards in this deck.
Unlock Deck
k this deck
42
The average hourly wage of workers at a fast food restaurant is $6.50/hr with a standard deviation of $0.45.Assume that the distribution is normally distributed.If a worker at this fast food restaurant is
Selected at random, what is the probability that the worker earns more than $6.75?
A)28.77%
B)27.64%
C)42.07%
D)5.17%
Selected at random, what is the probability that the worker earns more than $6.75?
A)28.77%
B)27.64%
C)42.07%
D)5.17%
Unlock Deck
Unlock for access to all 81 flashcards in this deck.
Unlock Deck
k this deck
43
If X is a normal random variable with mean 5, and if the probability that X is more than 4.08 is .5910 (as shown below), then what is the standard deviation of X? (Note: the diagram is not necessarily to scale.)
A)4.00
B)2.67
C)2.00
D)1.00
A)4.00
B)2.67
C)2.00
D)1.00
Unlock Deck
Unlock for access to all 81 flashcards in this deck.
Unlock Deck
k this deck
44
If X is a normal random variable with mean 4, and if the probability that X is less than 5.54 is .67 (as shown below), then what is the standard deviation of X? (Note: the diagram is not necessarily to scale.)
A)1.75
B)3.50
C)4.20
D)12.25
A)1.75
B)3.50
C)4.20
D)12.25
Unlock Deck
Unlock for access to all 81 flashcards in this deck.
Unlock Deck
k this deck
45
A recent study found that the average life expectancy of a person living in Africa is 53 years with a standard deviation of 7.5 years.If a person in Africa is selected at random, what is the probability that the
Person will die before the age of 65?
A)94.52%
B)82.89%
C)94.95%
D)88.49%
Person will die before the age of 65?
A)94.52%
B)82.89%
C)94.95%
D)88.49%
Unlock Deck
Unlock for access to all 81 flashcards in this deck.
Unlock Deck
k this deck
46
The average age of a vehicle registered in Canada is about 100 months.If a random sample of 36 vehicles is selected, find the probability that the mean of their age is between 102 and 104 months? Assume the
Standard deviation for the population is 15.
A)66.67%
B)15.71%
C)63.47%
D)75.82%
Standard deviation for the population is 15.
A)66.67%
B)15.71%
C)63.47%
D)75.82%
Unlock Deck
Unlock for access to all 81 flashcards in this deck.
Unlock Deck
k this deck
47
The mean weight of loads of rock is 46.0 tons with a standard deviation of 10.0 tons.If 9 loads are chosen at random for a weight check, find the probability that the mean weight of those loads is less than 42.00
Tons.Assume that the variable is normally distributed.
A)0.1151
B)0.3151
C)0.1551
D)0.4008
Tons.Assume that the variable is normally distributed.
A)0.1151
B)0.3151
C)0.1551
D)0.4008
Unlock Deck
Unlock for access to all 81 flashcards in this deck.
Unlock Deck
k this deck
48
The average gas consumption of a certain model car is 8.1 litres/100 km.If the gas consumption is normally distributed with a standard deviation of 0.2, find the probability that a car has a gas consumption
Between 8.08 and 8.13 litres/100 km.
A)0.10
B)0.16
C)0.20
D)0.22
Between 8.08 and 8.13 litres/100 km.
A)0.10
B)0.16
C)0.20
D)0.22
Unlock Deck
Unlock for access to all 81 flashcards in this deck.
Unlock Deck
k this deck
49
If X is a normal random variable with standard deviation 2.50, and if the probability that X is more than 5.95 is .1271 (as shown below), then what is the mean of X? (Note: the diagram is not necessarily to scale.)
A)5.8
B)5.0
C)4.7
D)3.1
A)5.8
B)5.0
C)4.7
D)3.1
Unlock Deck
Unlock for access to all 81 flashcards in this deck.
Unlock Deck
k this deck
50
In order to be accepted into a top university, applicants must score within the top 5% on the SAT exam. Given that the test has a mean of 1000 and a standard deviation of 200, what is the lowest possible score a
Student needs to qualify for acceptance into the university?
A)1330
B)1400
C)1250
D)1100
Student needs to qualify for acceptance into the university?
A)1330
B)1400
C)1250
D)1100
Unlock Deck
Unlock for access to all 81 flashcards in this deck.
Unlock Deck
k this deck
51
At a large department store, the average number of years of employment for a cashier is 5.7 with a standard deviation of 1.8 years.If an employee is picked at random, what is the probability that the
Employee has worked at the store for over 10 years?
A)49.16%
B)99.16%
C)0.84%
D)0.54%
Employee has worked at the store for over 10 years?
A)49.16%
B)99.16%
C)0.84%
D)0.54%
Unlock Deck
Unlock for access to all 81 flashcards in this deck.
Unlock Deck
k this deck
52
The average height of flowering cherry trees in a nursery is 9.5 feet.If the heights are normally distributed with a standard deviation of 1.3, find the probability that a tree is less than 11.5 feet tall.
A)0.82
B)0.94
C)0.97
D)0.88
A)0.82
B)0.94
C)0.97
D)0.88
Unlock Deck
Unlock for access to all 81 flashcards in this deck.
Unlock Deck
k this deck
53
The average number of mosquitoes in a stagnant pond is 60 per square meter with a standard deviation of 12.If 16 square meters are chosen at random for a mosquito count, find the probability that the average of those counts is more than 63.0 mosquitoes per square meter.Assume that the variable is normally
Distributed.
A)0.4587
B)0.1587
C)0.1107
D)-0.0013
Distributed.
A)0.4587
B)0.1587
C)0.1107
D)-0.0013
Unlock Deck
Unlock for access to all 81 flashcards in this deck.
Unlock Deck
k this deck
54
If the standard deviation of a population is 70 and we want the standard error (the standard deviation of the sample mean) to be 14, then we need to take
A)5 samples
B)25 samples
C)125 samples
D)625 samples
A)5 samples
B)25 samples
C)125 samples
D)625 samples
Unlock Deck
Unlock for access to all 81 flashcards in this deck.
Unlock Deck
k this deck
55
If X is a normal random variable with mean 6 and standard deviation 3.0, then find the value x such that P(Z < x) is equal to .86, as shown below.(Note: the diagram is not necessarily to scale.)
A)9.24
B)7.32
C)6.66
D)6.00
A)9.24
B)7.32
C)6.66
D)6.00
Unlock Deck
Unlock for access to all 81 flashcards in this deck.
Unlock Deck
k this deck
56
If the standard deviation of a population is 50 and we take a sample of size 25, then the standard error (the standard deviation of the sample mean) is
A)10.00
B)5.00
C)250.00
D)2.00
A)10.00
B)5.00
C)250.00
D)2.00
Unlock Deck
Unlock for access to all 81 flashcards in this deck.
Unlock Deck
k this deck
57
If X is a normal random variable with mean 9 and standard deviation 2.5, then find the value x such that P(Z > x) is equal to .7054, as shown below.(Note: the diagram is not necessarily to scale.)
A)8.10
B)8.33
C)7.65
D)11.10
A)8.10
B)8.33
C)7.65
D)11.10
Unlock Deck
Unlock for access to all 81 flashcards in this deck.
Unlock Deck
k this deck
58
The average length of crocodiles in a swamp is 12.5 feet.If the lengths are normally distributed with a standard deviation of 2.1, find the probability that a crocodile is more than 12 feet long.
A)0.51
B)0.53
C)0.57
D)0.59
A)0.51
B)0.53
C)0.57
D)0.59
Unlock Deck
Unlock for access to all 81 flashcards in this deck.
Unlock Deck
k this deck
59
The average age of doctors in a certain hospital is 48.0 years old with a standard deviation of 6.0 years.If 25 doctors are chosen at random for a committee, find the probability that the mean age of those doctors
Is less than 48.60 years.Assume that the variable is normally distributed.
A)0.3085
B)0.5715
C)0.6675
D)0.6915
Is less than 48.60 years.Assume that the variable is normally distributed.
A)0.3085
B)0.5715
C)0.6675
D)0.6915
Unlock Deck
Unlock for access to all 81 flashcards in this deck.
Unlock Deck
k this deck
60
If X is a normal random variable with standard deviation 3.00, and if the probability that X is less than 7.64 is .648 (as shown below), then what is the mean of X? (Note: the diagram is not necessarily to scale.)
A)5.6
B)6.0
C)6.2
D)6.5
A)5.6
B)6.0
C)6.2
D)6.5
Unlock Deck
Unlock for access to all 81 flashcards in this deck.
Unlock Deck
k this deck
61
Which of the following statements is correct?
A)The distribution of the values in a sample is called a sampling distribution.
B)The variability of sample means is never smaller than that of the population being sampled.
C)The larger the sample size is, the larger is the standard error of the mean.
D)The distribution of the values of a statistic over all possible samples of fixed size is called a sampling distribution.
Unlock Deck
Unlock for access to all 81 flashcards in this deck.
Unlock Deck
k this deck
62
What is the z value such that 50% of the total area lies to the right of the curve in any normal distribution?
Unlock Deck
Unlock for access to all 81 flashcards in this deck.
Unlock Deck
k this deck
63
The __________ is the difference between the sample measure and the corresponding population measure
due to the fact that the sample is not a perfect representation of the population.
________________________________________
due to the fact that the sample is not a perfect representation of the population.
________________________________________
Unlock Deck
Unlock for access to all 81 flashcards in this deck.
Unlock Deck
k this deck
64
A biologist estimates that 60% of deer in the region carry a certain type of tick.For a sample of 300 deer selected at random, what is the chance that 186 or fewer deer have this tick?
A)0.8135
B)0.7782
C)0.7344
D)0.7290
A)0.8135
B)0.7782
C)0.7344
D)0.7290
Unlock Deck
Unlock for access to all 81 flashcards in this deck.
Unlock Deck
k this deck
65
A(n) __________ is another term which can be used to describe an approximately bell shaped curve.
________________________________________
________________________________________
Unlock Deck
Unlock for access to all 81 flashcards in this deck.
Unlock Deck
k this deck
66
The __________ correction factor is necessary if relatively large samples are taken from a small
population, because the sample mean will then more accurately estimate the population mean and there
will be less error in the estimation.
________________________________________
population, because the sample mean will then more accurately estimate the population mean and there
will be less error in the estimation.
________________________________________
Unlock Deck
Unlock for access to all 81 flashcards in this deck.
Unlock Deck
k this deck
67
Mrs.Smith's reading class can read a mean of 175 words per minute with a standard deviation of 20
words per minute.The top 3% of the class is to receive a special award.What is the minimum number of
words per minute a student would have to read in order to get the award?
words per minute.The top 3% of the class is to receive a special award.What is the minimum number of
words per minute a student would have to read in order to get the award?
Unlock Deck
Unlock for access to all 81 flashcards in this deck.
Unlock Deck
k this deck
68
Of the members of a Boy Scout troop, 15% have received their first aid badge.If 40 boy scouts are selected at random, find the probability that four or more will have the first aid badge?
A)86.65%
B)85.35%
C)36.65%
D)35.35%
A)86.65%
B)85.35%
C)36.65%
D)35.35%
Unlock Deck
Unlock for access to all 81 flashcards in this deck.
Unlock Deck
k this deck
69
When the data values are evenly distributed about the mean, the distribution is said to be
__________.
________________________________________
__________.
________________________________________
Unlock Deck
Unlock for access to all 81 flashcards in this deck.
Unlock Deck
k this deck
70
If a baseball player's batting average is 0.340 or 34%, find the probability that the player will have a bad season and only score at most 60 hits in 200 times at bat?
A)12.64%
B)11.72%
C)50.34%
D)13.14%
A)12.64%
B)11.72%
C)50.34%
D)13.14%
Unlock Deck
Unlock for access to all 81 flashcards in this deck.
Unlock Deck
k this deck
71
A(n) __________ is employed when a continuous distribution is used to approximate a discrete
distribution.
________________________________________
distribution.
________________________________________
Unlock Deck
Unlock for access to all 81 flashcards in this deck.
Unlock Deck
k this deck
72
The average diameter of sand dollars on a certain island is 4.00 centimeters with a standard deviation of 0.80 centimeters.If 25 sand dollars are chosen at random for a collection, find the probability that
The average diameter of those sand dollars is more than 3.824 centimeters.Assume that the variable is
Normally distributed.
A)0.8414
B)0.8483
C)0.8643
D)0.8611
The average diameter of those sand dollars is more than 3.824 centimeters.Assume that the variable is
Normally distributed.
A)0.8414
B)0.8483
C)0.8643
D)0.8611
Unlock Deck
Unlock for access to all 81 flashcards in this deck.
Unlock Deck
k this deck
73
A television station estimates that 50% of college students watch the Super Bowl.For a sample of 200 students selected at random, what is the mean and variance of the number of students who watch this
Game?
A)Mean = 100.0, Variance = 7.07
B)Mean = 50.0, Variance = 7.07
C)Mean = 50.0, Variance = 50.00
D)Mean = 100.0, Variance = 50.00
Game?
A)Mean = 100.0, Variance = 7.07
B)Mean = 50.0, Variance = 7.07
C)Mean = 50.0, Variance = 50.00
D)Mean = 100.0, Variance = 50.00
Unlock Deck
Unlock for access to all 81 flashcards in this deck.
Unlock Deck
k this deck
74
If one assumes that the gestational age is normally distributed with mean 270 days and standard deviation 16.5, what proportion of births would be considered pre-term (less than 37 weeks)?
A)0.18
B)0.25
C)0.33
D)0.75
A)0.18
B)0.25
C)0.33
D)0.75
Unlock Deck
Unlock for access to all 81 flashcards in this deck.
Unlock Deck
k this deck
75
The standard deviation of a distribution is 20.If a sample of 225 is selected, what is the standard error of
the mean?
the mean?
Unlock Deck
Unlock for access to all 81 flashcards in this deck.
Unlock Deck
k this deck
76
The Canada Safety Council reported that 8% of Canadian drivers read while driving.If 500 drivers are selected at random, find the probability that exactly 40 will admit to reading while driving.
A)1.96%
B)2.04%
C)6.56%
D)0.56%
A)1.96%
B)2.04%
C)6.56%
D)0.56%
Unlock Deck
Unlock for access to all 81 flashcards in this deck.
Unlock Deck
k this deck
77
A(n) __________ is a distribution obtained by using the means computed from random samples of a
specific size taken from a population.
________________________________________
specific size taken from a population.
________________________________________
Unlock Deck
Unlock for access to all 81 flashcards in this deck.
Unlock Deck
k this deck
78
If the length of country and western songs has mean 170 seconds and standard deviation 30 seconds, then the probability that a random selection of 16 songs will have mean length of 160.48 seconds or less is
A)0.8980
B)0.3980
C)0.1020
D)0.6020
A)0.8980
B)0.3980
C)0.1020
D)0.6020
Unlock Deck
Unlock for access to all 81 flashcards in this deck.
Unlock Deck
k this deck
79
As the sample size n increases, the shape of the distribution of the sample means taken with replacement
from a population with mean and standard deviation of will
approach a normal distribution.This distribution will have a mean of and a
standard deviation of . This statement summarizes the __________.
________________________________________
from a population with mean and standard deviation of will
approach a normal distribution.This distribution will have a mean of and a
standard deviation of .
This statement summarizes the __________.________________________________________
Unlock Deck
Unlock for access to all 81 flashcards in this deck.
Unlock Deck
k this deck
80
What is the z value to the right of the mean such that 85% of the total area lies to the left of it as shown in
the figure below?
the figure below?
Unlock Deck
Unlock for access to all 81 flashcards in this deck.
Unlock Deck
k this deck
Unlock Deck
Unlock for access to all 81 flashcards in this deck.


