Deck 16: Budgeting and Business Statistics
Full screen (f)
Question
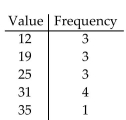
Use the data to complete the table.
The following is the number of hours students studied per week on average.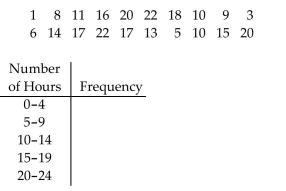
A)Frequency: 2, 4, 4, 6, 4
B)Frequency: 2, 3, 6, 5, 4
C)Frequency: 2, 4, 5, 5, 4
D)Frequency: 2, 4, 5, 4, 5
The following is the number of hours students studied per week on average.
A)Frequency: 2, 4, 4, 6, 4
B)Frequency: 2, 3, 6, 5, 4
C)Frequency: 2, 4, 5, 5, 4
D)Frequency: 2, 4, 5, 4, 5
Question
The bar graph shows the percent of income spent on leisure activities in various countries of the world. Use the graph to answer the question.
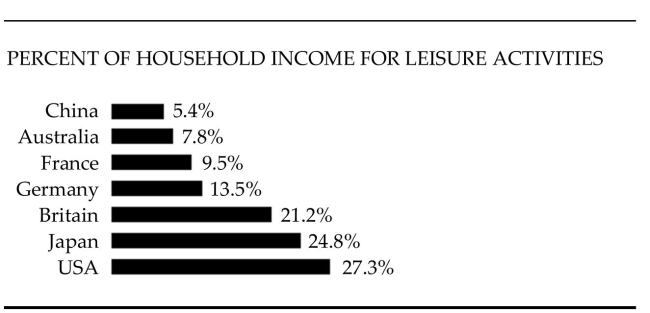 List all countries in the graph in which less than 12% of household income is spent, on average, for leisure activities.
A)Germany, Britain, Japan, USA
B)China, Australia
C)China, Australia, France
D)China, Australia, France, Germany
List all countries in the graph in which less than 12% of household income is spent, on average, for leisure activities.A)Germany, Britain, Japan, USA
B)China, Australia
C)China, Australia, France
D)China, Australia, France, Germany
Question
Question
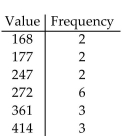
Find the weighted mean. Round to the nearest tenth.
A)253.2
B)54.2
C)230.1
D)307.7
A)253.2
B)54.2
C)230.1
D)307.7
Question
The bar graph shows the percent of income spent on leisure activities in various countries of the world. Use the graph to answer the question.
 In which country is the lowest percent of income spent on leisure activities? What percent is this?
A)China; 94.4%
B)Australia; 8.3%
C)USA; 70.6%
D)China; 5.6%
In which country is the lowest percent of income spent on leisure activities? What percent is this?A)China; 94.4%
B)Australia; 8.3%
C)USA; 70.6%
D)China; 5.6%
Question
Describe the distributions with a pie chart.
The following figures give the distribution of land (in acres)of a county containing 67,000 acres.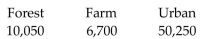
A)
B)
The following figures give the distribution of land (in acres)of a county containing 67,000 acres.
A)
B)
Question
This frequency table gives the distribution of ages of 100 people in a small town.  How many people are:
Less than 30 years of age
A)22
B)18
C)29
D)36
How many people are:Less than 30 years of age
A)22
B)18
C)29
D)36
Question
Answer the following. Round all numbers to the nearest dollar.
Helena is a college student. She works part-time as a barista and earns about $325 a week after taxes, including tips. She has a scholarship that pays $1500 per semester and she attends two semesters a year. She hopes to work full-time in the summer and should make $2800 a month after taxes for 3 months, not including the $325 she will also earn as a barista through the summer. She uses her dad's car at no cost other than gasoline and her own car insurance. She lives at home for free and quickly jots down these ongoing expenses. To make it easy, assume the income she receives in the summer as well as the scholarship funds are spread out over 12 months in equal amounts. Find her average monthly after-tax income, average monthly expense based on the numbers above, and the difference between the two. What expenses has she not considered that she should have? Based on the numbers above, how much does she need to borrow per month on average? Assuming all numbers stay the same and ignoring anything she might have failed to list, find the debt she will accumulate in an interest-free Stafford loan if she goes to school for 4 years (assume 48 months.)
Helena is a college student. She works part-time as a barista and earns about $325 a week after taxes, including tips. She has a scholarship that pays $1500 per semester and she attends two semesters a year. She hopes to work full-time in the summer and should make $2800 a month after taxes for 3 months, not including the $325 she will also earn as a barista through the summer. She uses her dad's car at no cost other than gasoline and her own car insurance. She lives at home for free and quickly jots down these ongoing expenses.
To make it easy, assume the income she receives in the summer as well as the scholarship funds are spread out over 12 months in equal amounts. Find her average monthly after-tax income, average monthly expense based on the numbers above, and the difference between the two. What expenses has she not considered that she should have? Based on the numbers above, how much does she need to borrow per month on average? Assuming all numbers stay the same and ignoring anything she might have failed to list, find the debt she will accumulate in an interest-free Stafford loan if she goes to school for 4 years (assume 48 months.) Question
Question
Question
Use the data to complete the table.
On a 25-point math test student scores were as follows.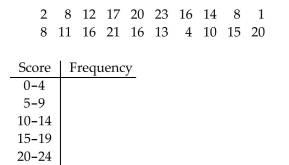
A)Frequency: 3, 3, 5, 4, 5
B)Frequency: 3, 3, 4, 6, 4
C)Frequency: 3, 3, 5, 5, 4
D)Frequency: 3, 2, 6, 5, 4
On a 25-point math test student scores were as follows.
A)Frequency: 3, 3, 5, 4, 5
B)Frequency: 3, 3, 4, 6, 4
C)Frequency: 3, 3, 5, 5, 4
D)Frequency: 3, 2, 6, 5, 4
Question
This frequency table gives the distribution of ages of 100 people in a small town. 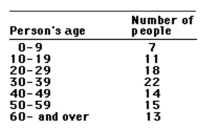 How many people are:
10 years of age or older but less than 40 years of age
A)65
B)11
C)51
D)24
How many people are:10 years of age or older but less than 40 years of age
A)65
B)11
C)51
D)24
Question
Question
Question
Answer the following. Round all numbers to the nearest dollar.
Jackson has just divorced and must pay child care to his ex. He earns $52,800 a year after income taxes from his job. He has some stock that pays a dividend of $429 per quarter. He lists "Other expenses" at $900 per month as he isn't quite sure yet what they will be, given that his car is getting old and may need replacement.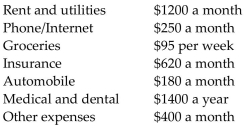 Find his average monthly-after tax income, average monthly expense based on the numbers above, and the difference between the two. Based on your experience, is his budget reasonable? Does he have enough income?
Jackson has just divorced and must pay child care to his ex. He earns $52,800 a year after income taxes from his job. He has some stock that pays a dividend of $429 per quarter. He lists "Other expenses" at $900 per month as he isn't quite sure yet what they will be, given that his car is getting old and may need replacement.
Find his average monthly-after tax income, average monthly expense based on the numbers above, and the difference between the two. Based on your experience, is his budget reasonable? Does he have enough income? Question
Question
Question
Question
Question
Question
Question
Use this graph to answer the question. 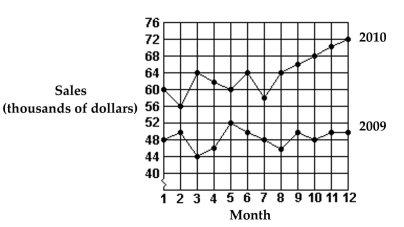
What was the total increase in sales for the first 6 months from 2009 to 2010?
A)$18,000
B)$76,000
C)$12,000
D)$652,000
What was the total increase in sales for the first 6 months from 2009 to 2010?
A)$18,000
B)$76,000
C)$12,000
D)$652,000
Question
Use this graph to answer the question. 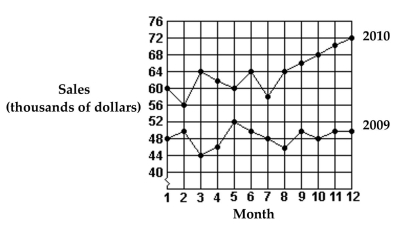
What were the total sales for 2010?
A)$60,000
B)$72,000
C)$578,000
D)$764,000
What were the total sales for 2010?
A)$60,000
B)$72,000
C)$578,000
D)$764,000
Question
Describe the distributions with a pie chart.
The following figures give the economic distribution for 5,000 people who live in a certain county.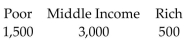
A)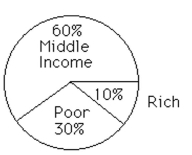
B)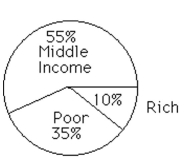
The following figures give the economic distribution for 5,000 people who live in a certain county.
A)
B)
Question
Question
Find the weighted mean. Round to the nearest tenth.
A)321.3
B)247.3
C)91.1
D)285.6
A)321.3
B)247.3
C)91.1
D)285.6
Question
This frequency table gives the distribution of ages of 100 people in a small town. 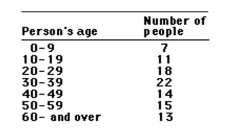 How many people are:
10 years of age or older
A)7
B)11
C)93
D)82
How many people are:10 years of age or older
A)7
B)11
C)93
D)82
Question
This frequency table gives the distribution of ages of 100 people in a small town.  How many people are:
30 years of age or older
A)58
B)42
C)64
D)22
How many people are:30 years of age or older
A)58
B)42
C)64
D)22
Question
Make a line graph using the given frequencies.
A)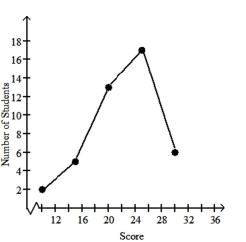
B)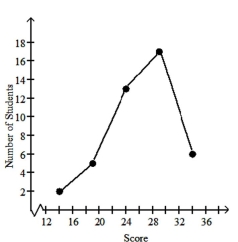
C)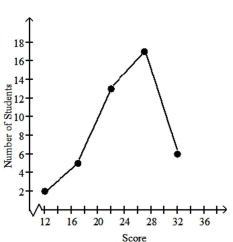
D)None of the above
A)
B)
C)
D)None of the above
Question
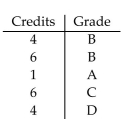
Find the grade point average for the following student. Assume A = 4, B = 3, C = 2, D = 1, and F = 0. Round answer to the nearest tenth.
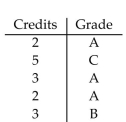
A)2.1
B)4.1
C)3.1
D)9.4
A)2.1
B)4.1
C)3.1
D)9.4
Question
Question
Question
This frequency table gives the distribution of ages of 100 people in a small town. 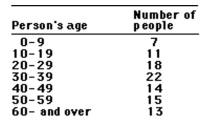 How many people are:
Less than 40 years of age
A)58
B)72
C)22
D)14
How many people are:Less than 40 years of age
A)58
B)72
C)22
D)14
Question
Question
Find the weighted mean. Round to the nearest tenth.
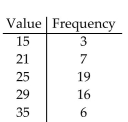
A)27.4
B)2.5
C)26.3
D)28.3
A)27.4
B)2.5
C)26.3
D)28.3
Question
Find the grade point average for the following student. Assume A = 4, B = 3, C = 2, D = 1, and F = 0. Round answer to the nearest tenth.
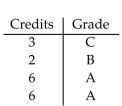
A)4.0
B)2.4
C)11.0
D)3.5
A)4.0
B)2.4
C)11.0
D)3.5
Question
Use this graph to answer the question.
What were the sales in month 8 of 2010?
A)$50,000
B)$62,000
C)$64,000
D)$66,000
What were the sales in month 8 of 2010?
A)$50,000
B)$62,000
C)$64,000
D)$66,000
Question
Use this graph to answer the question. 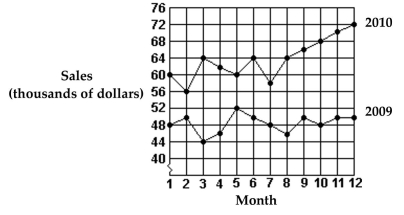
What was the total increase in sales from 2009 to 2010?
A)$12,000
B)$1,342,000
C)$22,000
D)$182,000
What was the total increase in sales from 2009 to 2010?
A)$12,000
B)$1,342,000
C)$22,000
D)$182,000
Question
Make a bar graph using the given frequencies.
The frequency distribution indicates the height in feet of persons in a group of 135 people.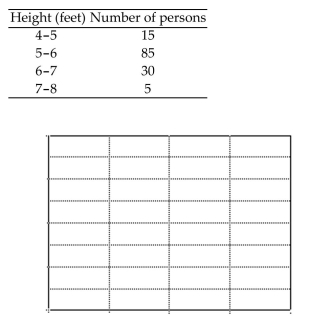
A)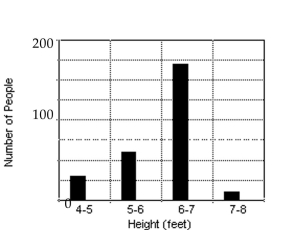
B)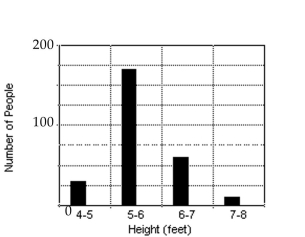
C)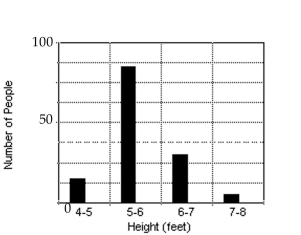
D)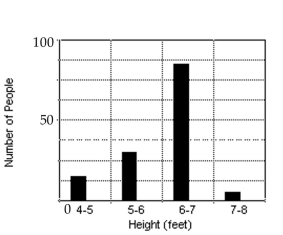
The frequency distribution indicates the height in feet of persons in a group of 135 people.
A)
B)
C)
D)
Question
This frequency table gives the distribution of ages of 100 people in a small town.  How many people are:
30 years of age or older but less than 40 years of age
A)36
B)18
C)22
D)64
How many people are:30 years of age or older but less than 40 years of age
A)36
B)18
C)22
D)64
Question
Question
Use this graph to answer the question. 
What were the total sales for the first 6 months of 2010?
A)$64,000
B)$286,000
C)$366,000
D)$302,000
What were the total sales for the first 6 months of 2010?
A)$64,000
B)$286,000
C)$366,000
D)$302,000
Question
Question
Question
Question
Use this graph to answer the question. 
What were the total sales for 2009?
A)$50,000
B)$582,000
C)$764,000
D)$48,000
What were the total sales for 2009?
A)$50,000
B)$582,000
C)$764,000
D)$48,000
Question
Question
Describe the distributions with a pie chart.
The following data give the color distribution of 1,000 carnations ordered by a local florist.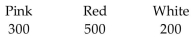
A)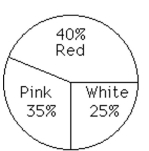
B)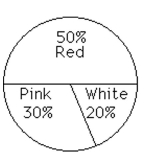
The following data give the color distribution of 1,000 carnations ordered by a local florist.
A)
B)
Question
Question
This frequency table gives the distribution of ages of 100 people in a small town. 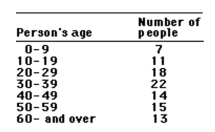 How many people are:
More than 40 years of age
A)No answer possible
B)28
C)14
D)42
How many people are:More than 40 years of age
A)No answer possible
B)28
C)14
D)42
Question
This frequency table gives the distribution of ages of 100 people in a small town. 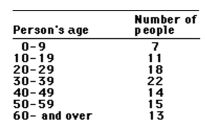 How many people are:
Less than 20 years of age
A)18
B)29
C)9
D)36
How many people are:Less than 20 years of age
A)18
B)29
C)9
D)36
Question
Question
Make a line graph using the given frequencies.
The ages of employees of a company are summarized in the frequency table.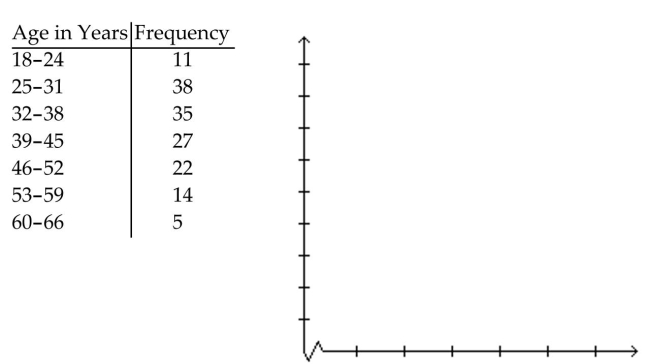
A)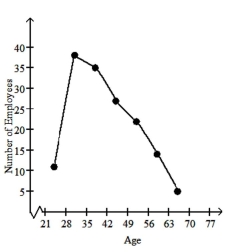
B)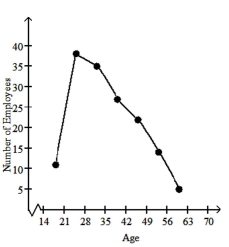
C)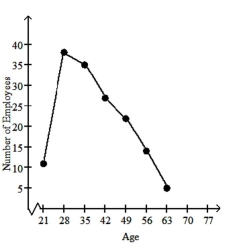
D)None of the above
The ages of employees of a company are summarized in the frequency table.
A)
B)
C)
D)None of the above
Question
Make a bar graph using the given frequencies.
The frequency distribution indicates the test averages of a group of 336 students.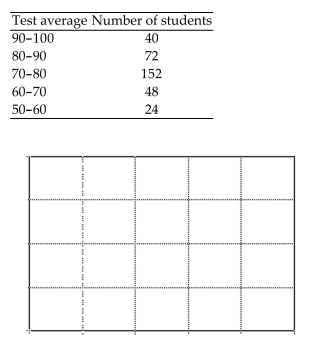
A)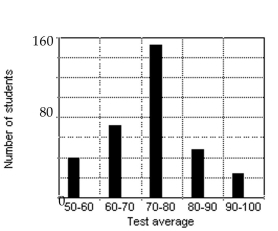
B)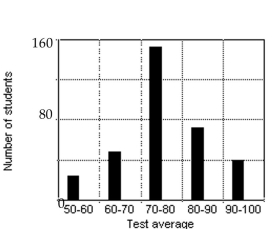
C)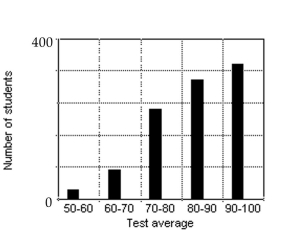
D)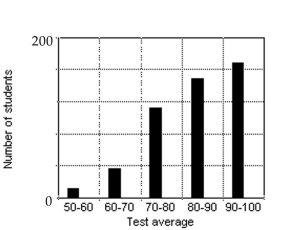
The frequency distribution indicates the test averages of a group of 336 students.
A)
B)
C)
D)
Question
Use the data to complete the table.
The following is the number of hours students worked per week at after-school jobs.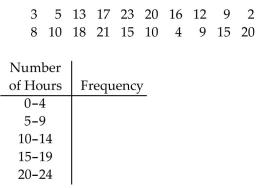
A)Frequency: 3, 3, 5, 5, 4
B)Frequency: 3, 4, 4, 5, 4
C)Frequency: 3, 4, 4, 4, 5
D)Frequency: 3, 4, 3, 6, 4
The following is the number of hours students worked per week at after-school jobs.
A)Frequency: 3, 3, 5, 5, 4
B)Frequency: 3, 4, 4, 5, 4
C)Frequency: 3, 4, 4, 4, 5
D)Frequency: 3, 4, 3, 6, 4
Question
The bar graph shows the percent of income spent on leisure activities in various countries of the world. Use the graph to answer the question.
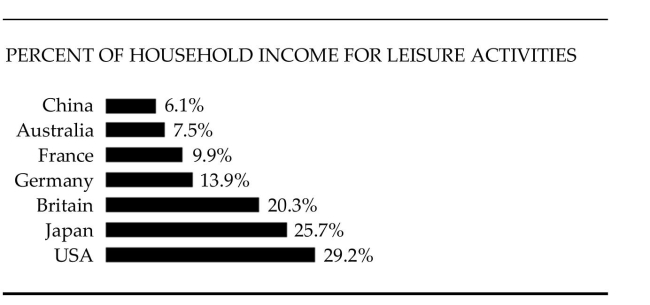 In which country is the highest percent of income spent on leisure activities? What percent is this?
A)China; 93.9%
B)Japan; 25.7%
C)USA; 29.2%
D)USA; 70.8%
In which country is the highest percent of income spent on leisure activities? What percent is this?A)China; 93.9%
B)Japan; 25.7%
C)USA; 29.2%
D)USA; 70.8%
Question
Question
The bar graph shows the percent of income spent on leisure activities in various countries of the world. Use the graph to answer the question.
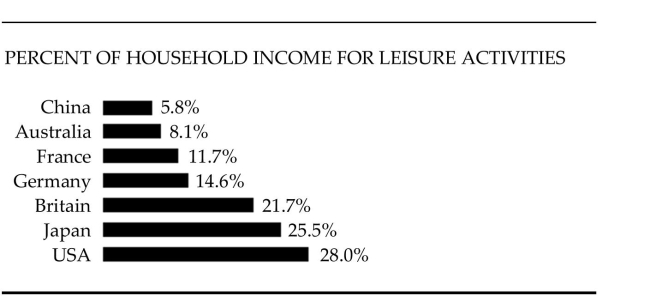 List all countries in the graph in which more than 15% of household income is spent, on average, for leisure activities.
A)Japan, USA
B)Germany, Britain, Japan, USA
C)China, Australia, France, Germany
D)Britain, Japan, USA
List all countries in the graph in which more than 15% of household income is spent, on average, for leisure activities.A)Japan, USA
B)Germany, Britain, Japan, USA
C)China, Australia, France, Germany
D)Britain, Japan, USA
Question
Describe the distributions with a pie chart.
The following data give the distribution of the types of houses in a town containing 15,000 houses.
A)
B)
The following data give the distribution of the types of houses in a town containing 15,000 houses.
A)
B)
Question
Question
Describe the distributions with a pie chart.
After reviewing a movie, 300 people rated the movie as excellent, good, or fair. The following data give the rating distribution.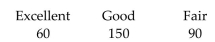
A)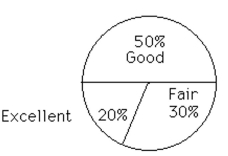
B)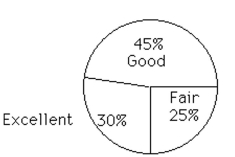
After reviewing a movie, 300 people rated the movie as excellent, good, or fair. The following data give the rating distribution.
A)
B)
Question
Question
Question
Make a line graph using the given frequencies.
A medical research team studied the ages of patients who had strokes caused by stress. The results of 34 patients are as follows: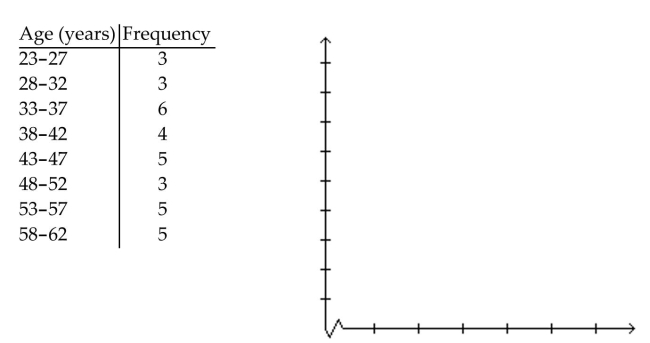
A)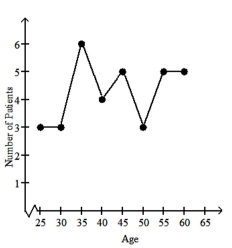
B)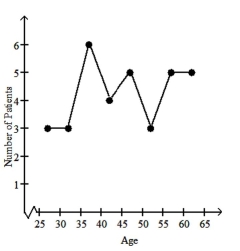
C)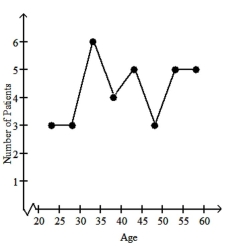
D)None of the above
A medical research team studied the ages of patients who had strokes caused by stress. The results of 34 patients are as follows:
A)
B)
C)
D)None of the above
Question
Use this graph to answer the question. 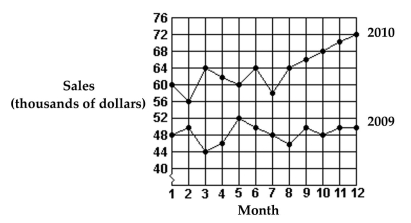
Which month in 2010 had the lowest sales?
A)Month 2
B)Month 12
C)Month 3
D)Month 7
Which month in 2010 had the lowest sales?
A)Month 2
B)Month 12
C)Month 3
D)Month 7
Question
Use the data to complete the table.
The following is the number of bonus points that 24 students have received for extra work.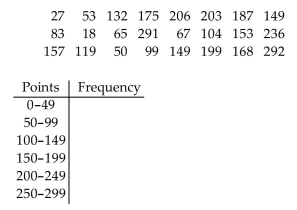
A)Frequency: 2, 6, 4, 7, 3, 2
B)Frequency: 2, 6, 5, 6, 3, 2
C)Frequency: 2, 6, 5, 5, 4, 2
D)Frequency: 2, 5, 6, 6, 3, 2
The following is the number of bonus points that 24 students have received for extra work.
A)Frequency: 2, 6, 4, 7, 3, 2
B)Frequency: 2, 6, 5, 6, 3, 2
C)Frequency: 2, 6, 5, 5, 4, 2
D)Frequency: 2, 5, 6, 6, 3, 2
Question
Question
Question
Question
Question
Find the grade point average for the following student. Assume A = 4, B = 3, C = 2, D = 1, and F = 0. Round answer to the nearest tenth.
A)3.8
B)1.4
C)10.0
D)2.4
A)3.8
B)1.4
C)10.0
D)2.4
Question
Question
Question
This frequency table gives the distribution of ages of 100 people in a small town.  How many people are:
More than 50 years of age
A)15
B)42
C)No answer possible
D)28
How many people are:More than 50 years of age
A)15
B)42
C)No answer possible
D)28
Question
Find the weighted mean. Round to the nearest tenth.
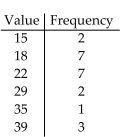
A)23.6
B)22.3
C)26.0
D)7.2
A)23.6
B)22.3
C)26.0
D)7.2
Question
Find the weighted mean. Round to the nearest tenth.
A)27.3
B)25.3
C)8.7
D)23.4
A)27.3
B)25.3
C)8.7
D)23.4
Question
Use this graph to answer the question. 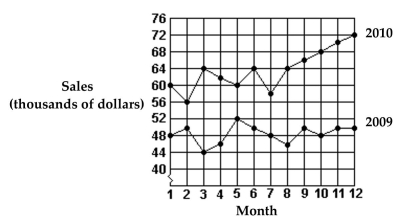
Which month in 2009 had the highest sales?
A)Month 12
B)Month 5
C)Month 2
D)Month 9
Which month in 2009 had the highest sales?
A)Month 12
B)Month 5
C)Month 2
D)Month 9
Question
Question
Question

Unlock Deck
Sign up to unlock the cards in this deck!
Unlock Deck
Unlock Deck
1/87
Play
Full screen (f)
Deck 16: Budgeting and Business Statistics
1
Use the data to complete the table.
The following is the number of hours students studied per week on average.
A)Frequency: 2, 4, 4, 6, 4
B)Frequency: 2, 3, 6, 5, 4
C)Frequency: 2, 4, 5, 5, 4
D)Frequency: 2, 4, 5, 4, 5
The following is the number of hours students studied per week on average.
A)Frequency: 2, 4, 4, 6, 4
B)Frequency: 2, 3, 6, 5, 4
C)Frequency: 2, 4, 5, 5, 4
D)Frequency: 2, 4, 5, 4, 5
Frequency: 2, 4, 5, 5, 4
2
The bar graph shows the percent of income spent on leisure activities in various countries of the world. Use the graph to answer the question.
List all countries in the graph in which less than 12% of household income is spent, on average, for leisure activities.
A)Germany, Britain, Japan, USA
B)China, Australia
C)China, Australia, France
D)China, Australia, France, Germany
List all countries in the graph in which less than 12% of household income is spent, on average, for leisure activities.A)Germany, Britain, Japan, USA
B)China, Australia
C)China, Australia, France
D)China, Australia, France, Germany
China, Australia, France
3
Provide an appropriate response.
List the advantages and disadvantages of using a bar graph to present data.
List the advantages and disadvantages of using a bar graph to present data.
Answers will vary.
4
Find the weighted mean. Round to the nearest tenth.
A)253.2
B)54.2
C)230.1
D)307.7
A)253.2
B)54.2
C)230.1
D)307.7
Unlock Deck
Unlock for access to all 87 flashcards in this deck.
Unlock Deck
k this deck
5
The bar graph shows the percent of income spent on leisure activities in various countries of the world. Use the graph to answer the question.
In which country is the lowest percent of income spent on leisure activities? What percent is this?
A)China; 94.4%
B)Australia; 8.3%
C)USA; 70.6%
D)China; 5.6%
In which country is the lowest percent of income spent on leisure activities? What percent is this?A)China; 94.4%
B)Australia; 8.3%
C)USA; 70.6%
D)China; 5.6%
Unlock Deck
Unlock for access to all 87 flashcards in this deck.
Unlock Deck
k this deck
6
Describe the distributions with a pie chart.
The following figures give the distribution of land (in acres)of a county containing 67,000 acres.
A)
B)
The following figures give the distribution of land (in acres)of a county containing 67,000 acres.
A)
B)
Unlock Deck
Unlock for access to all 87 flashcards in this deck.
Unlock Deck
k this deck
7
This frequency table gives the distribution of ages of 100 people in a small town. How many people are:
Less than 30 years of age
A)22
B)18
C)29
D)36
How many people are:Less than 30 years of age
A)22
B)18
C)29
D)36
Unlock Deck
Unlock for access to all 87 flashcards in this deck.
Unlock Deck
k this deck
8
Answer the following. Round all numbers to the nearest dollar.
Helena is a college student. She works part-time as a barista and earns about $325 a week after taxes, including tips. She has a scholarship that pays $1500 per semester and she attends two semesters a year. She hopes to work full-time in the summer and should make $2800 a month after taxes for 3 months, not including the $325 she will also earn as a barista through the summer. She uses her dad's car at no cost other than gasoline and her own car insurance. She lives at home for free and quickly jots down these ongoing expenses. To make it easy, assume the income she receives in the summer as well as the scholarship funds are spread out over 12 months in equal amounts. Find her average monthly after-tax income, average monthly expense based on the numbers above, and the difference between the two. What expenses has she not considered that she should have? Based on the numbers above, how much does she need to borrow per month on average? Assuming all numbers stay the same and ignoring anything she might have failed to list, find the debt she will accumulate in an interest-free Stafford loan if she goes to school for 4 years (assume 48 months.)
Helena is a college student. She works part-time as a barista and earns about $325 a week after taxes, including tips. She has a scholarship that pays $1500 per semester and she attends two semesters a year. She hopes to work full-time in the summer and should make $2800 a month after taxes for 3 months, not including the $325 she will also earn as a barista through the summer. She uses her dad's car at no cost other than gasoline and her own car insurance. She lives at home for free and quickly jots down these ongoing expenses.
To make it easy, assume the income she receives in the summer as well as the scholarship funds are spread out over 12 months in equal amounts. Find her average monthly after-tax income, average monthly expense based on the numbers above, and the difference between the two. What expenses has she not considered that she should have? Based on the numbers above, how much does she need to borrow per month on average? Assuming all numbers stay the same and ignoring anything she might have failed to list, find the debt she will accumulate in an interest-free Stafford loan if she goes to school for 4 years (assume 48 months.) Unlock Deck
Unlock for access to all 87 flashcards in this deck.
Unlock Deck
k this deck
9
Find the mode or modes.
20, 28, 46, 28, 49, 28, 49
A)35.4
B)49
C)28
D)46
20, 28, 46, 28, 49, 28, 49
A)35.4
B)49
C)28
D)46
Unlock Deck
Unlock for access to all 87 flashcards in this deck.
Unlock Deck
k this deck
10
Provide an appropriate response.
Explain the purpose of a comparative line graph.
Explain the purpose of a comparative line graph.
Unlock Deck
Unlock for access to all 87 flashcards in this deck.
Unlock Deck
k this deck
11
Use the data to complete the table.
On a 25-point math test student scores were as follows.
A)Frequency: 3, 3, 5, 4, 5
B)Frequency: 3, 3, 4, 6, 4
C)Frequency: 3, 3, 5, 5, 4
D)Frequency: 3, 2, 6, 5, 4
On a 25-point math test student scores were as follows.
A)Frequency: 3, 3, 5, 4, 5
B)Frequency: 3, 3, 4, 6, 4
C)Frequency: 3, 3, 5, 5, 4
D)Frequency: 3, 2, 6, 5, 4
Unlock Deck
Unlock for access to all 87 flashcards in this deck.
Unlock Deck
k this deck
12
This frequency table gives the distribution of ages of 100 people in a small town. How many people are:
10 years of age or older but less than 40 years of age
A)65
B)11
C)51
D)24
How many people are:10 years of age or older but less than 40 years of age
A)65
B)11
C)51
D)24
Unlock Deck
Unlock for access to all 87 flashcards in this deck.
Unlock Deck
k this deck
13
Find the median.
Number of calls in queue: 41, 25, 8, 3, 24, 23, 29, 32, 40, 38
A)24
B)29
C)26
D)26.5
Number of calls in queue: 41, 25, 8, 3, 24, 23, 29, 32, 40, 38
A)24
B)29
C)26
D)26.5
Unlock Deck
Unlock for access to all 87 flashcards in this deck.
Unlock Deck
k this deck
14
Provide an appropriate response.
Explain why or when the median is a better average to use than the mean.
Explain why or when the median is a better average to use than the mean.
Unlock Deck
Unlock for access to all 87 flashcards in this deck.
Unlock Deck
k this deck
15
Answer the following. Round all numbers to the nearest dollar.
Jackson has just divorced and must pay child care to his ex. He earns $52,800 a year after income taxes from his job. He has some stock that pays a dividend of $429 per quarter. He lists "Other expenses" at $900 per month as he isn't quite sure yet what they will be, given that his car is getting old and may need replacement. Find his average monthly-after tax income, average monthly expense based on the numbers above, and the difference between the two. Based on your experience, is his budget reasonable? Does he have enough income?
Jackson has just divorced and must pay child care to his ex. He earns $52,800 a year after income taxes from his job. He has some stock that pays a dividend of $429 per quarter. He lists "Other expenses" at $900 per month as he isn't quite sure yet what they will be, given that his car is getting old and may need replacement.
Find his average monthly-after tax income, average monthly expense based on the numbers above, and the difference between the two. Based on your experience, is his budget reasonable? Does he have enough income? Unlock Deck
Unlock for access to all 87 flashcards in this deck.
Unlock Deck
k this deck
16
Solve the following circle graph problems.
If savings are represented by 45° on a circle graph showing all expenses, and the total expenses are $1,392, how much go into savings?
A)$174
B)$290
C)$232
D)$116
If savings are represented by 45° on a circle graph showing all expenses, and the total expenses are $1,392, how much go into savings?
A)$174
B)$290
C)$232
D)$116
Unlock Deck
Unlock for access to all 87 flashcards in this deck.
Unlock Deck
k this deck
17
Solve the problem.
A company that manufactures computer chips wants to determine how many defective chips are in ten batches to be shipped. A quality control team samples 250 chips from each batch of 1000 and
Finds the following defective chips per batch: 38, 14, 6, 4, 27, 12, 22, 35, 36, 31. Find the median
Number of defective chips.
A)24.5 chips
B)22 chips
C)27 chips
D)23 chips
Unlock Deck
Unlock for access to all 87 flashcards in this deck.
Unlock Deck
k this deck
18
Find the median.
Number of orders: 6, 4, 25, 10, 28, 40, 36, 36
A)28
B)26.5
C)23.5
D)25
Number of orders: 6, 4, 25, 10, 28, 40, 36, 36
A)28
B)26.5
C)23.5
D)25
Unlock Deck
Unlock for access to all 87 flashcards in this deck.
Unlock Deck
k this deck
19
Find the median.
Cost of cellular phones: $100, $33, $224, $118, $286, $236, $230
A)$224
B)$230
C)$175
D)$118
Cost of cellular phones: $100, $33, $224, $118, $286, $236, $230
A)$224
B)$230
C)$175
D)$118
Unlock Deck
Unlock for access to all 87 flashcards in this deck.
Unlock Deck
k this deck
20
Provide an appropriate response.
Describe some situations where the mode is the best average to use to describe data.
Describe some situations where the mode is the best average to use to describe data.
Unlock Deck
Unlock for access to all 87 flashcards in this deck.
Unlock Deck
k this deck
21
Solve the following circle graph problems.
If total expenses are $1,100 and miscellaneous expenses account for $55, how many degrees in a circle graph would miscellaneous expenses represent?
A)60°
B)72°
C)54°
D)18°
If total expenses are $1,100 and miscellaneous expenses account for $55, how many degrees in a circle graph would miscellaneous expenses represent?
A)60°
B)72°
C)54°
D)18°
Unlock Deck
Unlock for access to all 87 flashcards in this deck.
Unlock Deck
k this deck
22
Use this graph to answer the question.
What was the total increase in sales for the first 6 months from 2009 to 2010?
A)$18,000
B)$76,000
C)$12,000
D)$652,000
What was the total increase in sales for the first 6 months from 2009 to 2010?
A)$18,000
B)$76,000
C)$12,000
D)$652,000
Unlock Deck
Unlock for access to all 87 flashcards in this deck.
Unlock Deck
k this deck
23
Use this graph to answer the question.
What were the total sales for 2010?
A)$60,000
B)$72,000
C)$578,000
D)$764,000
What were the total sales for 2010?
A)$60,000
B)$72,000
C)$578,000
D)$764,000
Unlock Deck
Unlock for access to all 87 flashcards in this deck.
Unlock Deck
k this deck
24
Describe the distributions with a pie chart.
The following figures give the economic distribution for 5,000 people who live in a certain county.
A)
B)
The following figures give the economic distribution for 5,000 people who live in a certain county.
A)
B)
Unlock Deck
Unlock for access to all 87 flashcards in this deck.
Unlock Deck
k this deck
25
Find the mode or modes.
81, 35, 32, 35, 29, 81
A)35
B)48.8
C)81, 35
D)81
81, 35, 32, 35, 29, 81
A)35
B)48.8
C)81, 35
D)81
Unlock Deck
Unlock for access to all 87 flashcards in this deck.
Unlock Deck
k this deck
26
Find the weighted mean. Round to the nearest tenth.
A)321.3
B)247.3
C)91.1
D)285.6
A)321.3
B)247.3
C)91.1
D)285.6
Unlock Deck
Unlock for access to all 87 flashcards in this deck.
Unlock Deck
k this deck
27
This frequency table gives the distribution of ages of 100 people in a small town. How many people are:
10 years of age or older
A)7
B)11
C)93
D)82
How many people are:10 years of age or older
A)7
B)11
C)93
D)82
Unlock Deck
Unlock for access to all 87 flashcards in this deck.
Unlock Deck
k this deck
28
This frequency table gives the distribution of ages of 100 people in a small town. How many people are:
30 years of age or older
A)58
B)42
C)64
D)22
How many people are:30 years of age or older
A)58
B)42
C)64
D)22
Unlock Deck
Unlock for access to all 87 flashcards in this deck.
Unlock Deck
k this deck
29
Make a line graph using the given frequencies.
A)
B)
C)
D)None of the above
A)
B)
C)
D)None of the above
Unlock Deck
Unlock for access to all 87 flashcards in this deck.
Unlock Deck
k this deck
30
Find the grade point average for the following student. Assume A = 4, B = 3, C = 2, D = 1, and F = 0. Round answer to the nearest tenth.
A)2.1
B)4.1
C)3.1
D)9.4
A)2.1
B)4.1
C)3.1
D)9.4
Unlock Deck
Unlock for access to all 87 flashcards in this deck.
Unlock Deck
k this deck
31
Find the median.
Salaries of doctors: $115,000, $123,000, $181,000, $202,000, $238,000, $128,000, $124,000, $ 899,000, $206,000, $158,000
A)$169,500
B)$237,000
C)$181,000
D)$263,000
Salaries of doctors: $115,000, $123,000, $181,000, $202,000, $238,000, $128,000, $124,000, $ 899,000, $206,000, $158,000
A)$169,500
B)$237,000
C)$181,000
D)$263,000
Unlock Deck
Unlock for access to all 87 flashcards in this deck.
Unlock Deck
k this deck
32
Find the mean. Round to the nearest tenth unless otherwise stated.
Number of days spent working out in a month: 14, 11, 6, 19, 18, 4, 13, 3
A)10
B)17
C)11
D)12.6
Number of days spent working out in a month: 14, 11, 6, 19, 18, 4, 13, 3
A)10
B)17
C)11
D)12.6
Unlock Deck
Unlock for access to all 87 flashcards in this deck.
Unlock Deck
k this deck
33
This frequency table gives the distribution of ages of 100 people in a small town. How many people are:
Less than 40 years of age
A)58
B)72
C)22
D)14
How many people are:Less than 40 years of age
A)58
B)72
C)22
D)14
Unlock Deck
Unlock for access to all 87 flashcards in this deck.
Unlock Deck
k this deck
34
Find the median.
Monthly net gains: $8,768, $1,824, $1,462, $6,358, $8,523, $3,644, $2,049, $8,372, $5,460, $4,492
A)$5,661.33
B)$5,095.20
C)$4,976.00
D)$5,460.00
Monthly net gains: $8,768, $1,824, $1,462, $6,358, $8,523, $3,644, $2,049, $8,372, $5,460, $4,492
A)$5,661.33
B)$5,095.20
C)$4,976.00
D)$5,460.00
Unlock Deck
Unlock for access to all 87 flashcards in this deck.
Unlock Deck
k this deck
35
Find the weighted mean. Round to the nearest tenth.
A)27.4
B)2.5
C)26.3
D)28.3
A)27.4
B)2.5
C)26.3
D)28.3
Unlock Deck
Unlock for access to all 87 flashcards in this deck.
Unlock Deck
k this deck
36
Find the grade point average for the following student. Assume A = 4, B = 3, C = 2, D = 1, and F = 0. Round answer to the nearest tenth.
A)4.0
B)2.4
C)11.0
D)3.5
A)4.0
B)2.4
C)11.0
D)3.5
Unlock Deck
Unlock for access to all 87 flashcards in this deck.
Unlock Deck
k this deck
37
Use this graph to answer the question.
What were the sales in month 8 of 2010?
A)$50,000
B)$62,000
C)$64,000
D)$66,000
What were the sales in month 8 of 2010?
A)$50,000
B)$62,000
C)$64,000
D)$66,000
Unlock Deck
Unlock for access to all 87 flashcards in this deck.
Unlock Deck
k this deck
38
Use this graph to answer the question.
What was the total increase in sales from 2009 to 2010?
A)$12,000
B)$1,342,000
C)$22,000
D)$182,000
What was the total increase in sales from 2009 to 2010?
A)$12,000
B)$1,342,000
C)$22,000
D)$182,000
Unlock Deck
Unlock for access to all 87 flashcards in this deck.
Unlock Deck
k this deck
39
Make a bar graph using the given frequencies.
The frequency distribution indicates the height in feet of persons in a group of 135 people.
A)
B)
C)
D)
The frequency distribution indicates the height in feet of persons in a group of 135 people.
A)
B)
C)
D)
Unlock Deck
Unlock for access to all 87 flashcards in this deck.
Unlock Deck
k this deck
40
This frequency table gives the distribution of ages of 100 people in a small town. How many people are:
30 years of age or older but less than 40 years of age
A)36
B)18
C)22
D)64
How many people are:30 years of age or older but less than 40 years of age
A)36
B)18
C)22
D)64
Unlock Deck
Unlock for access to all 87 flashcards in this deck.
Unlock Deck
k this deck
41
Solve the following circle graph problems.
If total expenses are $1,025 and the cost of food is $205, how many degrees in a circle graph would food represent?
A)60°
B)72°
C)54°
D)90°
If total expenses are $1,025 and the cost of food is $205, how many degrees in a circle graph would food represent?
A)60°
B)72°
C)54°
D)90°
Unlock Deck
Unlock for access to all 87 flashcards in this deck.
Unlock Deck
k this deck
42
Use this graph to answer the question.
What were the total sales for the first 6 months of 2010?
A)$64,000
B)$286,000
C)$366,000
D)$302,000
What were the total sales for the first 6 months of 2010?
A)$64,000
B)$286,000
C)$366,000
D)$302,000
Unlock Deck
Unlock for access to all 87 flashcards in this deck.
Unlock Deck
k this deck
43
Solve the problem.
The batting percentages of some of the players on the company softball team are .221, .332, .206, .292, .240, .308, and .275. What is the mean batting percentage of these players? Round to the
Nearest thousandth.
A).268
B).281
C).312
D).244
The batting percentages of some of the players on the company softball team are .221, .332, .206, .292, .240, .308, and .275. What is the mean batting percentage of these players? Round to the
Nearest thousandth.
A).268
B).281
C).312
D).244
Unlock Deck
Unlock for access to all 87 flashcards in this deck.
Unlock Deck
k this deck
44
Solve the following circle graph problems.
If total expenses are $960 and the cost of books is $48, how many degrees in a circle graph would books represent?
A)22.5°
B)20°
C)18°
D)15°
If total expenses are $960 and the cost of books is $48, how many degrees in a circle graph would books represent?
A)22.5°
B)20°
C)18°
D)15°
Unlock Deck
Unlock for access to all 87 flashcards in this deck.
Unlock Deck
k this deck
45
Find the mean. Round to the nearest tenth unless otherwise stated.
Grocery expenses for the past six months: $49.36, $60.82, $42.76, $85.20, $41.14, $83.74. Round to the nearest cent.
A)$60.60
B)$90.76
C)$72.60
D)$60.50
Grocery expenses for the past six months: $49.36, $60.82, $42.76, $85.20, $41.14, $83.74. Round to the nearest cent.
A)$60.60
B)$90.76
C)$72.60
D)$60.50
Unlock Deck
Unlock for access to all 87 flashcards in this deck.
Unlock Deck
k this deck
46
Use this graph to answer the question.
What were the total sales for 2009?
A)$50,000
B)$582,000
C)$764,000
D)$48,000
What were the total sales for 2009?
A)$50,000
B)$582,000
C)$764,000
D)$48,000
Unlock Deck
Unlock for access to all 87 flashcards in this deck.
Unlock Deck
k this deck
47
Find the mean. Round to the nearest tenth unless otherwise stated.
Retirement ages of teachers: 51, 63, 64, 56, 67, 58, 68, 53, 57
A)59
B)58.4
C)59.7
D)58
Retirement ages of teachers: 51, 63, 64, 56, 67, 58, 68, 53, 57
A)59
B)58.4
C)59.7
D)58
Unlock Deck
Unlock for access to all 87 flashcards in this deck.
Unlock Deck
k this deck
48
Describe the distributions with a pie chart.
The following data give the color distribution of 1,000 carnations ordered by a local florist.
A)
B)
The following data give the color distribution of 1,000 carnations ordered by a local florist.
A)
B)
Unlock Deck
Unlock for access to all 87 flashcards in this deck.
Unlock Deck
k this deck
49
Find the mean. Round to the nearest tenth unless otherwise stated.
Annual salaries: $21,096, $18,265, $30,962, $24,944 Round to the nearest whole number.
A)$23,817
B)$21,096
C)$23,816
D)$18,265
Annual salaries: $21,096, $18,265, $30,962, $24,944 Round to the nearest whole number.
A)$23,817
B)$21,096
C)$23,816
D)$18,265
Unlock Deck
Unlock for access to all 87 flashcards in this deck.
Unlock Deck
k this deck
50
This frequency table gives the distribution of ages of 100 people in a small town. How many people are:
More than 40 years of age
A)No answer possible
B)28
C)14
D)42
How many people are:More than 40 years of age
A)No answer possible
B)28
C)14
D)42
Unlock Deck
Unlock for access to all 87 flashcards in this deck.
Unlock Deck
k this deck
51
This frequency table gives the distribution of ages of 100 people in a small town. How many people are:
Less than 20 years of age
A)18
B)29
C)9
D)36
How many people are:Less than 20 years of age
A)18
B)29
C)9
D)36
Unlock Deck
Unlock for access to all 87 flashcards in this deck.
Unlock Deck
k this deck
52
Solve the problem.
Customer relations specialists need to respond to email messages in addition to taking calls. The department is thinking of creating a new position that will solely handle email. The supervisor
Records the number of email messages received for eight consecutive days: 5, 4, 25, 11, 27, 42, 39, 34.
Find the median number of email messages received.
A)27 email messages
B)26 email messages
C)25 email messages
D)23.5 email messages
Unlock Deck
Unlock for access to all 87 flashcards in this deck.
Unlock Deck
k this deck
53
Make a line graph using the given frequencies.
The ages of employees of a company are summarized in the frequency table.
A)
B)
C)
D)None of the above
The ages of employees of a company are summarized in the frequency table.
A)
B)
C)
D)None of the above
Unlock Deck
Unlock for access to all 87 flashcards in this deck.
Unlock Deck
k this deck
54
Make a bar graph using the given frequencies.
The frequency distribution indicates the test averages of a group of 336 students.
A)
B)
C)
D)
The frequency distribution indicates the test averages of a group of 336 students.
A)
B)
C)
D)
Unlock Deck
Unlock for access to all 87 flashcards in this deck.
Unlock Deck
k this deck
55
Use the data to complete the table.
The following is the number of hours students worked per week at after-school jobs.
A)Frequency: 3, 3, 5, 5, 4
B)Frequency: 3, 4, 4, 5, 4
C)Frequency: 3, 4, 4, 4, 5
D)Frequency: 3, 4, 3, 6, 4
The following is the number of hours students worked per week at after-school jobs.
A)Frequency: 3, 3, 5, 5, 4
B)Frequency: 3, 4, 4, 5, 4
C)Frequency: 3, 4, 4, 4, 5
D)Frequency: 3, 4, 3, 6, 4
Unlock Deck
Unlock for access to all 87 flashcards in this deck.
Unlock Deck
k this deck
56
The bar graph shows the percent of income spent on leisure activities in various countries of the world. Use the graph to answer the question.
In which country is the highest percent of income spent on leisure activities? What percent is this?
A)China; 93.9%
B)Japan; 25.7%
C)USA; 29.2%
D)USA; 70.8%
In which country is the highest percent of income spent on leisure activities? What percent is this?A)China; 93.9%
B)Japan; 25.7%
C)USA; 29.2%
D)USA; 70.8%
Unlock Deck
Unlock for access to all 87 flashcards in this deck.
Unlock Deck
k this deck
57
Find the median.
Number of miles driven: 21, 21, 34, 53, 61, 69, 84
A)61
B)34
C)49
D)53
Number of miles driven: 21, 21, 34, 53, 61, 69, 84
A)61
B)34
C)49
D)53
Unlock Deck
Unlock for access to all 87 flashcards in this deck.
Unlock Deck
k this deck
58
The bar graph shows the percent of income spent on leisure activities in various countries of the world. Use the graph to answer the question.
List all countries in the graph in which more than 15% of household income is spent, on average, for leisure activities.
A)Japan, USA
B)Germany, Britain, Japan, USA
C)China, Australia, France, Germany
D)Britain, Japan, USA
List all countries in the graph in which more than 15% of household income is spent, on average, for leisure activities.A)Japan, USA
B)Germany, Britain, Japan, USA
C)China, Australia, France, Germany
D)Britain, Japan, USA
Unlock Deck
Unlock for access to all 87 flashcards in this deck.
Unlock Deck
k this deck
59
Describe the distributions with a pie chart.
The following data give the distribution of the types of houses in a town containing 15,000 houses.
A)
B)
The following data give the distribution of the types of houses in a town containing 15,000 houses.
A)
B)
Unlock Deck
Unlock for access to all 87 flashcards in this deck.
Unlock Deck
k this deck
60
Find the median.
Number of customers: 277, 399, 146, 451, 149, 226
A)277
B)226
C)251.5
D)235.5
Number of customers: 277, 399, 146, 451, 149, 226
A)277
B)226
C)251.5
D)235.5
Unlock Deck
Unlock for access to all 87 flashcards in this deck.
Unlock Deck
k this deck
61
Describe the distributions with a pie chart.
After reviewing a movie, 300 people rated the movie as excellent, good, or fair. The following data give the rating distribution.
A)
B)
After reviewing a movie, 300 people rated the movie as excellent, good, or fair. The following data give the rating distribution.
A)
B)
Unlock Deck
Unlock for access to all 87 flashcards in this deck.
Unlock Deck
k this deck
62
Find the mean. Round to the nearest tenth unless otherwise stated.
Scores on an aptitude test: 576, 561, 346, 356, 547, 341, 358, 553, 470, 482
A)450
B)476
C)459
D)468.4
Scores on an aptitude test: 576, 561, 346, 356, 547, 341, 358, 553, 470, 482
A)450
B)476
C)459
D)468.4
Unlock Deck
Unlock for access to all 87 flashcards in this deck.
Unlock Deck
k this deck
63
Find the mean. Round to the nearest tenth unless otherwise stated.
Number enrolled in a night class: 13, 16, 14, 13, 11
A)13
B)12
C)13.4
D)16.8
Number enrolled in a night class: 13, 16, 14, 13, 11
A)13
B)12
C)13.4
D)16.8
Unlock Deck
Unlock for access to all 87 flashcards in this deck.
Unlock Deck
k this deck
64
Make a line graph using the given frequencies.
A medical research team studied the ages of patients who had strokes caused by stress. The results of 34 patients are as follows:
A)
B)
C)
D)None of the above
A medical research team studied the ages of patients who had strokes caused by stress. The results of 34 patients are as follows:
A)
B)
C)
D)None of the above
Unlock Deck
Unlock for access to all 87 flashcards in this deck.
Unlock Deck
k this deck
65
Use this graph to answer the question.
Which month in 2010 had the lowest sales?
A)Month 2
B)Month 12
C)Month 3
D)Month 7
Which month in 2010 had the lowest sales?
A)Month 2
B)Month 12
C)Month 3
D)Month 7
Unlock Deck
Unlock for access to all 87 flashcards in this deck.
Unlock Deck
k this deck
66
Use the data to complete the table.
The following is the number of bonus points that 24 students have received for extra work.
A)Frequency: 2, 6, 4, 7, 3, 2
B)Frequency: 2, 6, 5, 6, 3, 2
C)Frequency: 2, 6, 5, 5, 4, 2
D)Frequency: 2, 5, 6, 6, 3, 2
The following is the number of bonus points that 24 students have received for extra work.
A)Frequency: 2, 6, 4, 7, 3, 2
B)Frequency: 2, 6, 5, 6, 3, 2
C)Frequency: 2, 6, 5, 5, 4, 2
D)Frequency: 2, 5, 6, 6, 3, 2
Unlock Deck
Unlock for access to all 87 flashcards in this deck.
Unlock Deck
k this deck
67
Solve the following circle graph problems.
If rent is represented by 54° on a circle graph showing all expenses, and the cost of rent is $765, how much are the total expenses?
A)$4,590
B)$5,100
C)$6,375
D)$6,120
If rent is represented by 54° on a circle graph showing all expenses, and the cost of rent is $765, how much are the total expenses?
A)$4,590
B)$5,100
C)$6,375
D)$6,120
Unlock Deck
Unlock for access to all 87 flashcards in this deck.
Unlock Deck
k this deck
68
Solve the following circle graph problems.
If entertainment is represented by 72° on a circle graph showing all expenses, and the cost of entertainment is $200, how much are the total expenses?
A)$1,000
B)$880
C)$1,200
D)$800
If entertainment is represented by 72° on a circle graph showing all expenses, and the cost of entertainment is $200, how much are the total expenses?
A)$1,000
B)$880
C)$1,200
D)$800
Unlock Deck
Unlock for access to all 87 flashcards in this deck.
Unlock Deck
k this deck
69
Solve the problem.
The five sales people at Southwest Appliances earned commissions last year of $15,000, $29,000, $46,000, $20,000, and $34,000. Find the mean commission.
A)$27,360
B)$31,680
C)$30,240
D)$28,800
The five sales people at Southwest Appliances earned commissions last year of $15,000, $29,000, $46,000, $20,000, and $34,000. Find the mean commission.
A)$27,360
B)$31,680
C)$30,240
D)$28,800
Unlock Deck
Unlock for access to all 87 flashcards in this deck.
Unlock Deck
k this deck
70
Find the mode or modes.
7.14, 7.41, 7.56, 7.14, 7.88, 7.99, 7.62
A)7.56
B)7.534
C)7.41
D)7.14
7.14, 7.41, 7.56, 7.14, 7.88, 7.99, 7.62
A)7.56
B)7.534
C)7.41
D)7.14
Unlock Deck
Unlock for access to all 87 flashcards in this deck.
Unlock Deck
k this deck
71
Find the grade point average for the following student. Assume A = 4, B = 3, C = 2, D = 1, and F = 0. Round answer to the nearest tenth.
A)3.8
B)1.4
C)10.0
D)2.4
A)3.8
B)1.4
C)10.0
D)2.4
Unlock Deck
Unlock for access to all 87 flashcards in this deck.
Unlock Deck
k this deck
72
Find the mode or modes.
5, 9, 85, 3, 2, 8, 46, 1, 4, 16
A)9
B)8
C)No mode
D)17.3
5, 9, 85, 3, 2, 8, 46, 1, 4, 16
A)9
B)8
C)No mode
D)17.3
Unlock Deck
Unlock for access to all 87 flashcards in this deck.
Unlock Deck
k this deck
73
Find the median.
Number of phone calls: 4, 5, 17, 28, 30, 37, 49
A)30
B)17
C)24
D)28
Number of phone calls: 4, 5, 17, 28, 30, 37, 49
A)30
B)17
C)24
D)28
Unlock Deck
Unlock for access to all 87 flashcards in this deck.
Unlock Deck
k this deck
74
This frequency table gives the distribution of ages of 100 people in a small town. How many people are:
More than 50 years of age
A)15
B)42
C)No answer possible
D)28
How many people are:More than 50 years of age
A)15
B)42
C)No answer possible
D)28
Unlock Deck
Unlock for access to all 87 flashcards in this deck.
Unlock Deck
k this deck
75
Find the weighted mean. Round to the nearest tenth.
A)23.6
B)22.3
C)26.0
D)7.2
A)23.6
B)22.3
C)26.0
D)7.2
Unlock Deck
Unlock for access to all 87 flashcards in this deck.
Unlock Deck
k this deck
76
Find the weighted mean. Round to the nearest tenth.
A)27.3
B)25.3
C)8.7
D)23.4
A)27.3
B)25.3
C)8.7
D)23.4
Unlock Deck
Unlock for access to all 87 flashcards in this deck.
Unlock Deck
k this deck
77
Use this graph to answer the question.
Which month in 2009 had the highest sales?
A)Month 12
B)Month 5
C)Month 2
D)Month 9
Which month in 2009 had the highest sales?
A)Month 12
B)Month 5
C)Month 2
D)Month 9
Unlock Deck
Unlock for access to all 87 flashcards in this deck.
Unlock Deck
k this deck
78
Find the mean. Round to the nearest tenth unless otherwise stated.
Average number of defects: 7.4, 8.3, 8.1, 7.8, 8.2, 7.4, 7.9, 8.1, 8.9, 7.4, 7.8, 6.5, 8.6, 8.3, 8.3, 7.9, 8.2, 7.9
A)8.4
B)7.5
C)7.9
D)8.2
Average number of defects: 7.4, 8.3, 8.1, 7.8, 8.2, 7.4, 7.9, 8.1, 8.9, 7.4, 7.8, 6.5, 8.6, 8.3, 8.3, 7.9, 8.2, 7.9
A)8.4
B)7.5
C)7.9
D)8.2
Unlock Deck
Unlock for access to all 87 flashcards in this deck.
Unlock Deck
k this deck
79
Find the mean. Round to the nearest tenth unless otherwise stated.
Snow accumulation: 9, 9.4, 7.2, 9.4, 7
A)7
B)9.4
C)9
D)8.4
Snow accumulation: 9, 9.4, 7.2, 9.4, 7
A)7
B)9.4
C)9
D)8.4
Unlock Deck
Unlock for access to all 87 flashcards in this deck.
Unlock Deck
k this deck
80
Solve the following circle graph problems.
If clothing is represented by 60° on a circle graph showing all expenses and the total expenses are $1,368, how much are the clothing expenses?
A)$342
B)$228
C)$285
D)$171
If clothing is represented by 60° on a circle graph showing all expenses and the total expenses are $1,368, how much are the clothing expenses?
A)$342
B)$228
C)$285
D)$171
Unlock Deck
Unlock for access to all 87 flashcards in this deck.
Unlock Deck
k this deck
Unlock Deck
Unlock for access to all 87 flashcards in this deck.


