Deck 15: Financial Statements and Ratios
Full screen (f)
Question
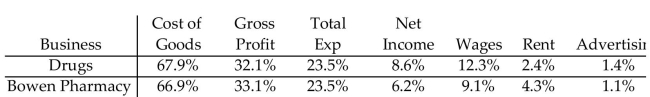
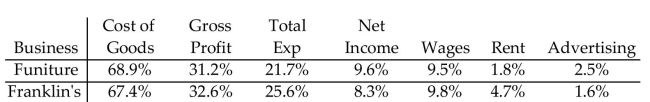
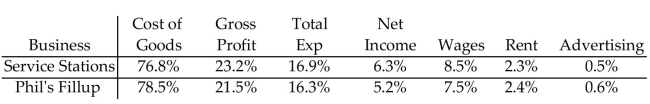
The table compares the national averages for an industry to the results for a given company in the industry. Identify any areas that might require attention by management and offer suggestions.
Question
Question
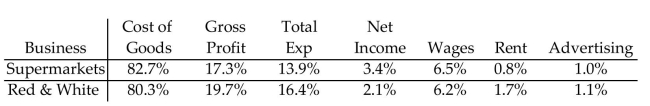
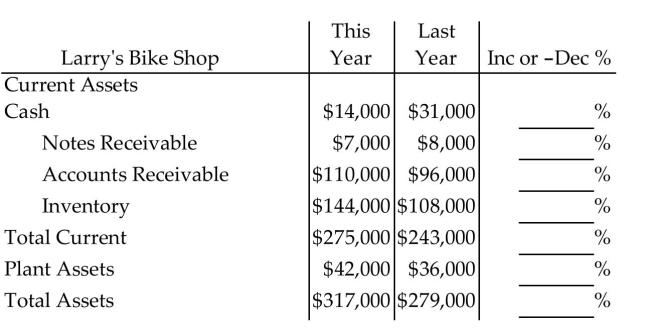
The table compares the national averages for an industry to the results for a given company in the industry. Identify any areas that might require attention by management and offer suggestions.
Question
Question
Question
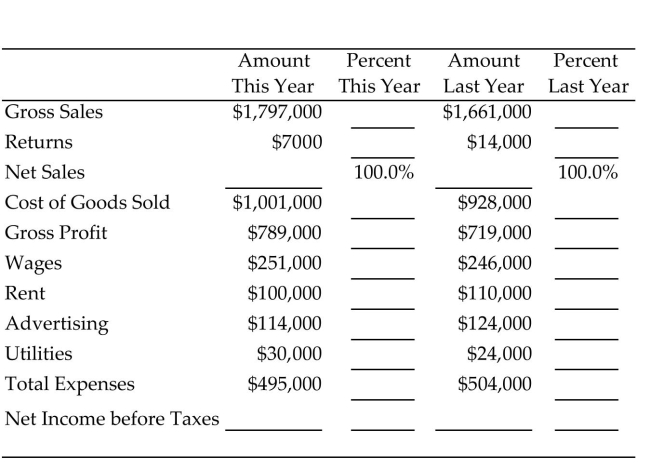
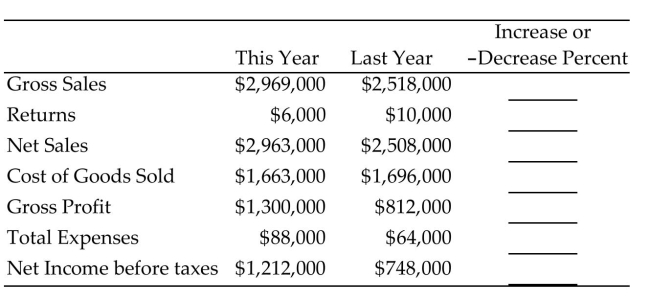
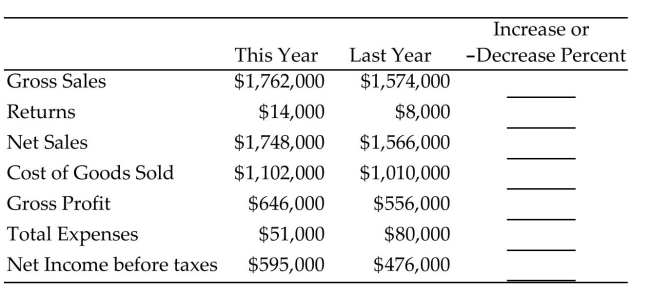
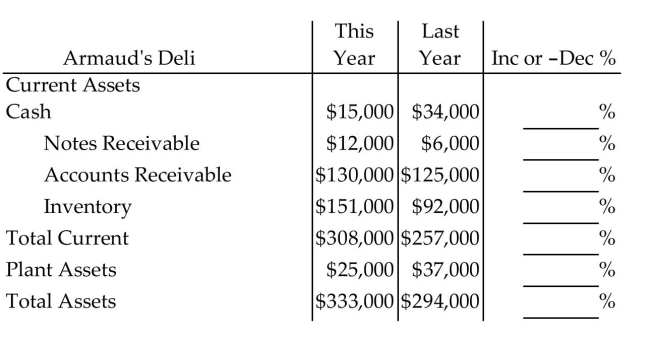
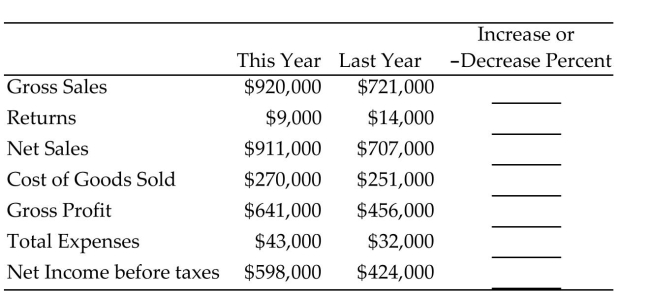
Complete the comparative income statement. Round percents to the nearest tenth of a percent.
Question
Question
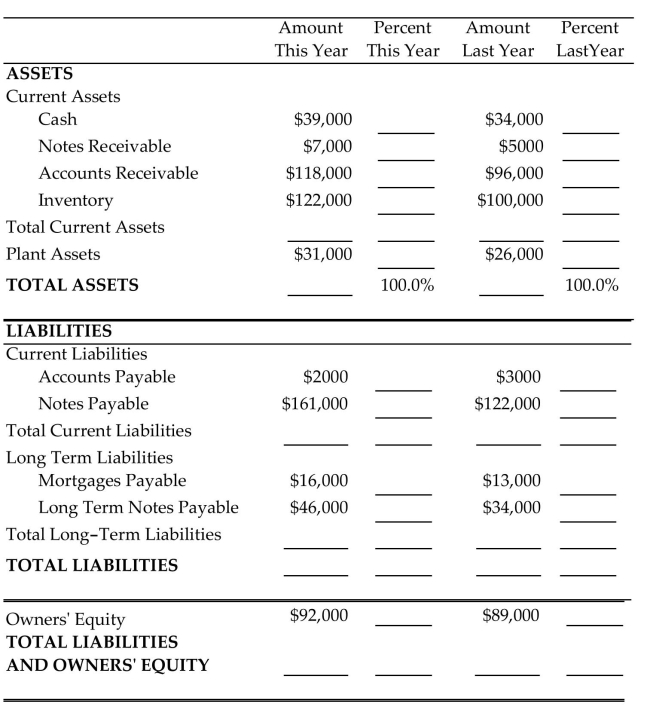
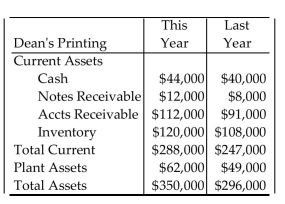
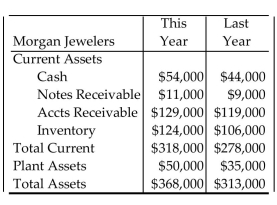
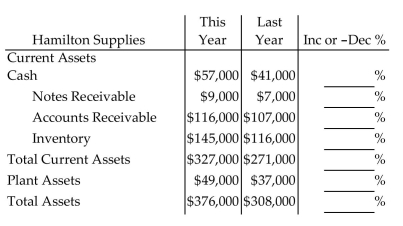
Complete the balance sheet using vertical analysis. Round to the nearest tenth of a percent.
Question
Question
Question
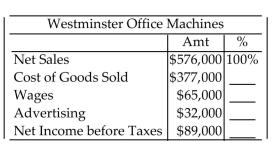
The following chart shows some figures from an income statement. Prepare a vertical analysis by expressing each item as a percent of net sales. Round percents to the nearest tenth of a percent.
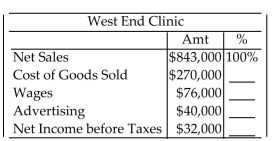
A)32.0%, 9.0%, 52.6%, 3.8%
B)32.0%, 9.1%, 14.8%, 11.9%
C)32.0%, 28.1%, 14.8%, 11.9%
D)32.0%, 9.0%, 4.7%, 3.8%
A)32.0%, 9.0%, 52.6%, 3.8%
B)32.0%, 9.1%, 14.8%, 11.9%
C)32.0%, 28.1%, 14.8%, 11.9%
D)32.0%, 9.0%, 4.7%, 3.8%
Question
Question
Complete the income statement.
Central Data Inc. had gross sales of $212,000 with returns of $5,100. The inventory on January 1 was $56,000. During the year $101,000 worth of goods was purchased with freight of $1,700. The inventory on December 31 was $53,000. Wages and salaries were $54,400, rent was $13,600, advertising was $2,200, utilities were $2,700, business taxes totaled $5,600, and miscellaneous expenses were $3,800.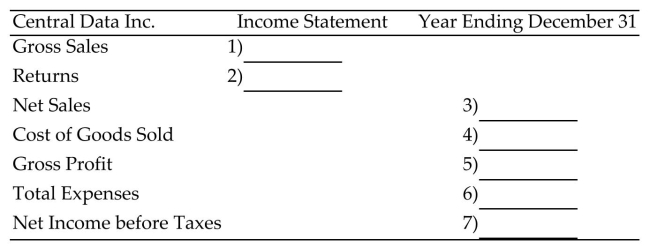
A)1)$212,000, 2)$5,100, 3)$206,900, 4)$105,700, 5)$101,200, 6)$82,300, 7)$18,900
B)1)$212,000, 2)$5,100, 3)$206,900, 4)$105,700, 5)$101,200, 6)$82,300, 7)$29,100
C)1)$212,000, 2)$5,100, 3)$217,100, 4)$105,700, 5)$111,400, 6)$82,300, 7)$29,100
D)1)$212,000, 2)$5,100, 3)$206,900, 4)$102,300, 5)$104,600, 6)$82,300, 7)$18,900
Question
The table compares the national averages for an industry to the results for a given company in the industry. Identify any areas that might require attention by management and offer suggestions.
Question
Complete the income statement.
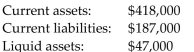
Cindy's Sweet Shop had gross sales of $370,000 with returns of $6,900. The inventory on January 1 was $50,000. During the year $181,000 worth of goods was purchased with freight of $1,900. The
Inventory on December 31 was $50,000. Wages and salaries were $23,100, rent was $8,700,
Advertising was $5,100, utilities were $2,300, business taxes totaled $5,400, and miscellaneous
Expenses were $3,500.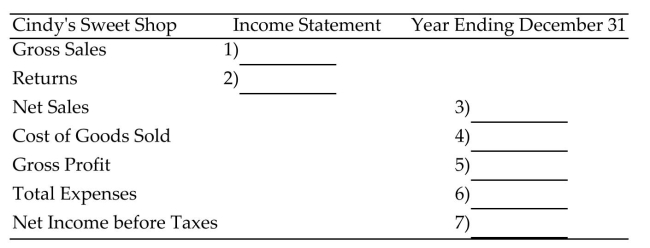
A)1)$370,000, 2)$6,900, 3)$363,100, 4)$182,900, 5)$180,200, 6)$48,100, 7)$132,100
B)1)$370,000, 2)$6,900, 3)$363,100, 4)$182,900, 5)$180,200, 6)$48,100, 7)$145,900
C)1)$370,000, 2)$6,900, 3)$363,100, 4)$179,100, 5)$184,000, 6)$48,100, 7)$132,100
D)1)$370,000, 2)$6,900, 3)$376,900, 4)$182,900, 5)$194,000, 6)$48,100, 7)$145,900
Question
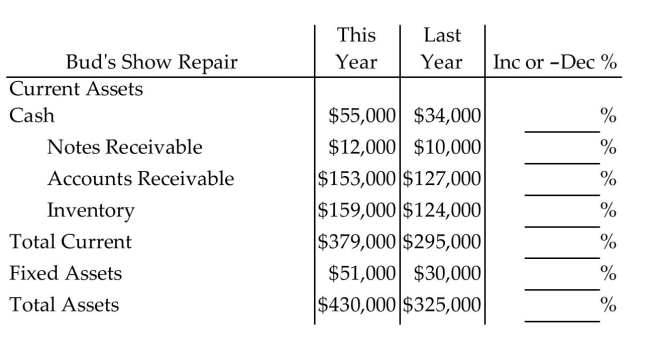
The table compares the national averages for an industry to the results for a given company in the industry. Identify any areas that might require attention by management and offer suggestions.
Question
Question
Complete the balance sheet.
Clara's Secretarial Services: net worth $71,000; cash $39,000; accounts receivable $24,000; inventory $41,000; fixed assets $40,000; long-term notes $26,000; mortgages $10,000; accounts payable
$14,000; notes payable $23,000
A)Assets: 39,000; 0; 24,000; 41,000; 104,000; 40,000; 144,000
Liabilities: 26,000; 14,000; 40,000; 10,000; 23,000; 33,000; 73,000
Owner's Equity: 71,000; 144,000
B)Assets: 39,000; 0; 24,000; 41,000; 104,000; 40,000; 144,000
Liabilities: 23,000; 14,000; 37,000; 10,000; 26,000; 36,000; 73,000
Owner's Equity: 71,000; 144,000
C)Assets: 39,000; 0; 24,000; 104,000; 41,000; 40,000; 144,000
Liabilities: 26,000; 14,000; 40,000; 10,000; 23,000; 33,000; 73,000
Owner's Equity: 71,000; 144,000
D)Assets: 39,000; 0; 24,000; 41,000; 104,000; 40,000; 144,000
Liabilities: 26,000; 14,000; 40,000; 10,000; 23,000; 33,000; 71,000
Owner's Equity: 73,000; 144,000
Question
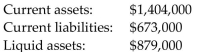
Calculate the current ratio and the acid-test ratio. Is the company healthy based on the guidelines given in the text?
A)Current ratio = 2.24 which is fine
Acid-test ratio = 0.25 which is very low
B)Current ratio = 2.24 which is fine
Acid-test ratio = 8.89 which is fine
C)Current ratio = 0.25 which is very low
Acid-test ratio = 2.24 which is fine
D)Current ratio = 8.89 which is fine
Acid-test ratio = 0.25 which is very low
Question
Question
Complete the balance sheet.
Mullen's Hardware: mortgage $36,000; notes payable $20,000; accounts payable $18,000; long-term notes $27,000; fixed assets $92,000; inventory $65,000; accounts receivable $42,000; notes receivable
$17,000; cash $9,000; owner's equity $124,000
A)Assets: 9,000; 17,000; 42,000; 65,000; 133,000; 92,000; 225,000
Liabilities: 20,000; 18,000; 38,000; 36,000; 27,000; 63,000; 101,000
Owner's Equity: 124,000; 225,000
B)Assets: 9,000; 17,000; 42,000; 65,000; 133,000; 92,000; 225,000
Liabilities: 27,000; 18,000; 45,000; 36,000; 20,000; 56,000; 124,000
Owner's Equity: 101,000; 225,000
C)Assets: 9,000; 17,000; 42,000; 65,000; 133,000; 92,000; 225,000
Liabilities: 27,000; 18,000; 45,000; 36,000; 20,000; 56,000; 101,000
Owner's Equity: 124,000; 225,000
D)Assets: 9,000; 17,000; 42,000; 133,000; 65,000; 92,000; 225,000
Liabilities: 27,000; 18,000; 45,000; 36,000; 20,000; 56,000; 101,000
Owner's Equity: 124,000; 225,000
Question
Question
Complete the horizontal analysis for the comparative income statement. Round to the nearest tenth of a percent.
A)13.9%, -140.0%, 14.2%, -7.8%, 47.8%, -118.7%, 48.7%
B)17.9%, -40.0%, 18.1%, -1.9%, 60.1%, 37.5%, 62.0%
C)-17.9%, 40.0%, -18.1%, 1.9%, -60.1%, -37.5%, -62.0%
D)15.2%, -66.7%, 15.4%, -2.0%, 37.5%, 27.3%, 38.3%
A)13.9%, -140.0%, 14.2%, -7.8%, 47.8%, -118.7%, 48.7%
B)17.9%, -40.0%, 18.1%, -1.9%, 60.1%, 37.5%, 62.0%
C)-17.9%, 40.0%, -18.1%, 1.9%, -60.1%, -37.5%, -62.0%
D)15.2%, -66.7%, 15.4%, -2.0%, 37.5%, 27.3%, 38.3%
Question
Question
Complete the horizontal analysis for the comparative income statement. Round to the nearest tenth of a percent.
A)11.9%, 75.0%, 11.6%, 9.1%, 16.2%, -36.2%, 25.0%
B)5.6%, -50.0%, 5.2%, -0.8%, -1.8%, -161.2%, 4.0%
C)10.7%, 42.9%, 10.4%, 8.3%, 13.9%, -56.9%, 20.0%
D)-11.9%, -75.0%, -11.6%, -9.1%, -16.2%, 36.2%, -25.0%
A)11.9%, 75.0%, 11.6%, 9.1%, 16.2%, -36.2%, 25.0%
B)5.6%, -50.0%, 5.2%, -0.8%, -1.8%, -161.2%, 4.0%
C)10.7%, 42.9%, 10.4%, 8.3%, 13.9%, -56.9%, 20.0%
D)-11.9%, -75.0%, -11.6%, -9.1%, -16.2%, 36.2%, -25.0%
Question
Question
Complete the income statement.
Frank's Nursery had gross sales of $2,273,000 with returns of $57,800. The inventory on January 1 was $567,000. During the year $1,130,000 worth of goods was purchased with freight of $5,600. The
Inventory on December 31 was $525,000. Wages and salaries were $81,600, rent was $10,200,
Advertising was $17,700, utilities were $5,200, business taxes totaled $8,500, and miscellaneous
Expenses were $6,100.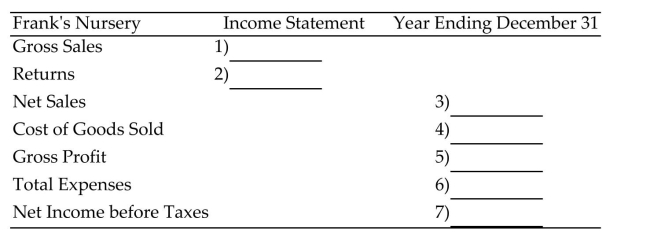
A)1)$2,273,000, 2)$57,800, 3)$2,215,200, 4)$1,177,600, 5)$1,037,600, 6)$129,300, 7)$908,300
B)1)$2,273,000, 2)$57,800, 3)$2,215,200, 4)$1,166,400, 5)$1,048,800, 6)$129,300, 7)$908,300
C)1)$2,273,000, 2)$57,800, 3)$2,330,800, 4)$1,177,600, 5)$1,153,200, 6)$129,300, 7)$1,023,900
D)1)$2,273,000, 2)$57,800, 3)$2,215,200, 4)$1,177,600, 5)$1,037,600, 6)$129,300, 7)$1,023,900
Question
Find the current ratio and the acid-test ratio for the indicated year. Round each ratio to the nearest hundredth of a percent.
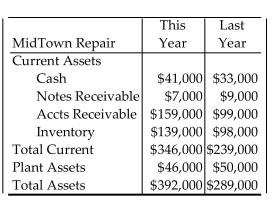 This year current liabilities are $234,000.
A)1.24; 0.60
B)1.48; 0.88
C)1.48; 0.56
D)1.24; 0.88
This year current liabilities are $234,000.A)1.24; 0.60
B)1.48; 0.88
C)1.48; 0.56
D)1.24; 0.88
Question
Complete the income statement.
Bay Side Videos had gross sales of $530,000 with returns of $6,300. The inventory on January 1 was $56,000. During the year $237,000 worth of goods was purchased with freight of $1,900. The
Inventory on December 31 was $56,000. Wages and salaries were $57,500, rent was $11,100,
Advertising was $4,000, utilities were $2,500, business taxes totaled $5,700, and miscellaneous
Expenses were $3,200.
A)1)$530,000, 2)$6,300, 3)$523,700, 4)$235,100, 5)$288,600, 6)$84,000, 7)$200,800
B)1)$530,000, 2)$6,300, 3)$523,700, 4)$238,900, 5)$284,800, 6)$84,000, 7)$213,400
C)1)$530,000, 2)$6,300, 3)$523,700, 4)$238,900, 5)$284,800, 6)$84,000, 7)$200,800
D)1)$530,000, 2)$6,300, 3)$536,300, 4)$238,900, 5)$297,400, 6)$84,000, 7)$213,400
Question
The following chart shows some figures from an income statement. Prepare a vertical analysis by expressing each item as a percent of net sales. Round percents to the nearest tenth of a percent.
A)40.7%, 8.2%, 5.0%, 4.7%
B)40.7%, 8.3%, 12.2%, 11.6%
C)40.7%, 8.2%, 60.6%, 4.7%
D)40.7%, 20.2%, 12.2%, 11.6%
A)40.7%, 8.2%, 5.0%, 4.7%
B)40.7%, 8.3%, 12.2%, 11.6%
C)40.7%, 8.2%, 60.6%, 4.7%
D)40.7%, 20.2%, 12.2%, 11.6%
Question
Complete the horizontal analysis for the comparative income statement. Round to the nearest tenth of a percent.
A)0.2%, -140.0%, 0.5%, -1.6%, -12.3%, -141.4%, -16.8%
B)5.8%, -66.7%, 6.1%, 7.3%, 3.9%, 23.7%, 1.2%
C)-6.2%, 40.0%, -6.5%, -7.9%, -4.1%, -31.0%, -1.3%
D)6.2%, -40.0%, 6.5%, 7.9%, 4.1%, 31.0%, 1.3%
A)0.2%, -140.0%, 0.5%, -1.6%, -12.3%, -141.4%, -16.8%
B)5.8%, -66.7%, 6.1%, 7.3%, 3.9%, 23.7%, 1.2%
C)-6.2%, 40.0%, -6.5%, -7.9%, -4.1%, -31.0%, -1.3%
D)6.2%, -40.0%, 6.5%, 7.9%, 4.1%, 31.0%, 1.3%
Question
Find the current ratio and the acid-test ratio for the indicated year. Round each ratio to the nearest hundredth of a percent.
 This year current liabilities are $227,000.
A)1.27; 0.95
B)1.57; 0.67
C)1.57; 0.95
D)1.27; 0.70
This year current liabilities are $227,000.A)1.27; 0.95
B)1.57; 0.67
C)1.57; 0.95
D)1.27; 0.70
Question
Find the current ratio and the acid-test ratio for the indicated year. Round each ratio to the nearest hundredth of a percent.
 Last year current liabilities were $197,000.
A)1.46; 0.85
B)1.46; 0.66
C)1.25; 0.71
D)1.25; 0.85
Last year current liabilities were $197,000.A)1.46; 0.85
B)1.46; 0.66
C)1.25; 0.71
D)1.25; 0.85
Question
Calculate the current ratio and the acid-test ratio. Is the company healthy based on the guidelines given in the text?
A)Current ratio = 1.37 which is too low
Acid-test ratio = 2.88 which is fine
B)Current ratio = 2.11 which is fine
Acid-test ratio = 1.37 which is too low
C)Current ratio = 2.88 which is fine
Acid-test ratio = 2.11 which is fine
D)Current ratio = 2.88 which is fine
Acid-test ratio = 1.37 which is fine
Question
Find the current ratio and the acid-test ratio for the indicated year. Round each ratio to the nearest hundredth of a percent.
 Last year current liabilities were $234,000.
A)1.19; 0.74
B)1.36; 0.70
C)1.36; 0.83
D)1.19; 0.83
Last year current liabilities were $234,000.A)1.19; 0.74
B)1.36; 0.70
C)1.36; 0.83
D)1.19; 0.83
Question
Complete the horizontal analysis for the balance sheet. Round to the nearest tenth of a percent.
A)-55.8%, 99.8%, 4.0%, 64.1%, 19.8%, -32.4%, 13.2%
B)-126.7%, 50.0%, 3.8%, 39.1%, 16.6%, -48.0%, 11.7%
C)226.7%, 50.0%, 96.2%, 60.9%, 83.4%, 148.0%, 88.3%
D)-55.9%, 100.0%, 4.0%, 64.1%, 19.8%, -32.4%, 13.3%
A)-55.8%, 99.8%, 4.0%, 64.1%, 19.8%, -32.4%, 13.2%
B)-126.7%, 50.0%, 3.8%, 39.1%, 16.6%, -48.0%, 11.7%
C)226.7%, 50.0%, 96.2%, 60.9%, 83.4%, 148.0%, 88.3%
D)-55.9%, 100.0%, 4.0%, 64.1%, 19.8%, -32.4%, 13.3%
Question
Complete the horizontal analysis for the comparative income statement. Round to the nearest tenth of a percent.
A)-27.6%, 35.7%, -28.9%, -7.6%, -40.6%, -34.4%, -41.0%
B)27.6%, -35.7%, 28.9%, 7.6%, 40.6%, 34.4%, 41.0%
C)21.6%, -55.6%, 22.4%, 7.0%, 28.9%, 25.6%, 29.1%
D)13.7%, -107.1%, 14.7%, -32.3%, 18.6%, -278.1%, 17.5%
A)-27.6%, 35.7%, -28.9%, -7.6%, -40.6%, -34.4%, -41.0%
B)27.6%, -35.7%, 28.9%, 7.6%, 40.6%, 34.4%, 41.0%
C)21.6%, -55.6%, 22.4%, 7.0%, 28.9%, 25.6%, 29.1%
D)13.7%, -107.1%, 14.7%, -32.3%, 18.6%, -278.1%, 17.5%
Question
Complete the horizontal analysis for the balance sheet. Round to the nearest tenth of a percent.
A)71.9%, 77.8%, 92.2%, 80.0%, 82.9%, 75.5%, 81.9%
B)39.1%, 28.4%, 8.4%, 25.0%, 20.7%, 32.4%, 22.0%
C)28.1%, 22.2%, 7.8%, 20.0%, 17.1%, 24.5%, 18.1%
D)39.0%, 28.6%, 8.4%, 25.0%, 20.7%, 32.4%, 22.1%
A)71.9%, 77.8%, 92.2%, 80.0%, 82.9%, 75.5%, 81.9%
B)39.1%, 28.4%, 8.4%, 25.0%, 20.7%, 32.4%, 22.0%
C)28.1%, 22.2%, 7.8%, 20.0%, 17.1%, 24.5%, 18.1%
D)39.0%, 28.6%, 8.4%, 25.0%, 20.7%, 32.4%, 22.1%
Question
Calculate the current ratio and the acid-test ratio. Is the company healthy based on the guidelines given in the text?
A)Current ratio = 1.31 which is too low
Acid-test ratio = 2.09 which is fine
B)Current ratio = 2.09 which is fine
Acid-test ratio = 1.60 which is fine
C)Current ratio = 2.09 which is fine
Acid-test ratio = 1.31 which is fine
D)Current ratio = 1.60 which is low
Acid-test ratio = 1.31 which is fine
A)Current ratio = 1.31 which is too low
Acid-test ratio = 2.09 which is fine
B)Current ratio = 2.09 which is fine
Acid-test ratio = 1.60 which is fine
C)Current ratio = 2.09 which is fine
Acid-test ratio = 1.31 which is fine
D)Current ratio = 1.60 which is low
Acid-test ratio = 1.31 which is fine
Question
The following chart shows some figures from an income statement. Prepare a vertical analysis by expressing each item as a percent of net sales. Round percents to the nearest tenth of a percent.
A)65.5%, 11.3%, 5.6%, 15.5%
B)65.5%, 17.2%, 8.5%, 23.6%
C)65.5%, 11.5%, 8.5%, 23.6%
D)65.5%, 11.3%, 49.2%, 15.5%
A)65.5%, 11.3%, 5.6%, 15.5%
B)65.5%, 17.2%, 8.5%, 23.6%
C)65.5%, 11.5%, 8.5%, 23.6%
D)65.5%, 11.3%, 49.2%, 15.5%
Question
Calculate the current ratio and the acid-test ratio. Is the company healthy based on the guidelines given in the text?
A)Current ratio = 1.31 which is too low
Acid-test ratio = 1.67 which is fine
B)Current ratio = 0.78 which is too low
Acid-test ratio = 1.31 which is too low
C)Current ratio = 1.67 which is too low
Acid-test ratio = 0.78 which is too low
D)Current ratio = 1.31 which is too low
Acid-test ratio = 0.78 which is too low
Question
The following chart shows some figures from an income statement. Prepare a vertical analysis by expressing each item as a percent of net sales. Round percents to the nearest tenth of a percent.
A)34.3%, 6.1%, 4.7%, 11.2%
B)34.3%, 6.1%, 76.5%, 11.2%
C)34.3%, 6.2%, 13.6%, 32.5%
D)34.3%, 17.8%, 13.6%, 32.5%
A)34.3%, 6.1%, 4.7%, 11.2%
B)34.3%, 6.1%, 76.5%, 11.2%
C)34.3%, 6.2%, 13.6%, 32.5%
D)34.3%, 17.8%, 13.6%, 32.5%
Question
Question
Complete the balance sheet.
Data-Serve Computer Services: fixed assets $59,000; mortgages $36,000; accounts payable $19,000; notes payable $15,000; long-term notes $26,000; equity $60,000; cash $17,000; inventory $18,000;
Notes receivable $9,000; accounts receivable $53,000
A)Assets: 17,000; 9,000; 53,000; 18,000; 97,000; 59,000; 156,000
Liabilities: 26,000; 19,000; 45,000; 36,000; 15,000; 51,000; 96,000
Owner's Equity: 60,000; 156,000
B)Assets: 17,000; 9,000; 53,000; 18,000; 97,000; 59,000; 156,000
Liabilities: 15,000; 19,000; 34,000; 36,000; 26,000; 62,000; 96,000
Owner's Equity: 60,000; 156,000
C)Assets: 17,000; 9,000; 53,000; 97,000; 18,000; 59,000; 156,000
Liabilities: 26,000; 19,000; 45,000; 36,000; 15,000; 51,000; 96,000
Owner's Equity: 60,000; 156,000
D)Assets: 17,000; 9,000; 53,000; 18,000; 97,000; 59,000; 156,000
Liabilities: 26,000; 19,000; 45,000; 36,000; 15,000; 51,000; 60,000
Owner's Equity: 96,000; 156,000
Question
Question
Complete the horizontal analysis for the comparative income statement. Round to the nearest tenth of a percent.
A)12.1%, 37.5%, 12.0%, 10.1%, 15.8%, 14.1%, 16.1%
B)-13.8%, -60.0%, -13.7%, -11.3%, -18.8%, -16.4%, -19.1%
C)7.2%, -140.0%, 7.0%, 1.5%, -2.1%, -132.8%, -5.1%
D)13.8%, 60.0%, 13.7%, 11.3%, 18.8%, 16.4%, 19.1%
A)12.1%, 37.5%, 12.0%, 10.1%, 15.8%, 14.1%, 16.1%
B)-13.8%, -60.0%, -13.7%, -11.3%, -18.8%, -16.4%, -19.1%
C)7.2%, -140.0%, 7.0%, 1.5%, -2.1%, -132.8%, -5.1%
D)13.8%, 60.0%, 13.7%, 11.3%, 18.8%, 16.4%, 19.1%
Question
Complete the horizontal analysis for the balance sheet. Round to the nearest tenth of a percent.
A)-121.4%, -14.3%, 12.7%, 25.0%, 11.6%, 14.3%, 12.0%
B)221.4%, 114.3%, 87.3%, 75.0%, 88.4%, 85.7%, 88.0%
C)-54.9%, -12.7%, 14.6%, 33.3%, 13.2%, 16.7%, 13.5%
D)-54.8%, -12.5%, 14.6%, 33.3%, 13.2%, 16.7%, 13.6%
A)-121.4%, -14.3%, 12.7%, 25.0%, 11.6%, 14.3%, 12.0%
B)221.4%, 114.3%, 87.3%, 75.0%, 88.4%, 85.7%, 88.0%
C)-54.9%, -12.7%, 14.6%, 33.3%, 13.2%, 16.7%, 13.5%
D)-54.8%, -12.5%, 14.6%, 33.3%, 13.2%, 16.7%, 13.6%
Question
Question
Question
Question
Complete the horizontal analysis for the balance sheet. Round to the nearest tenth of a percent.
A)61.8%, 20.0%, 20.5%, 28.2%, 28.5%, 70.0%, 32.3%
B)61.8%, 83.3%, 83.0%, 78.0%, 77.8%, 58.8%, 75.6%
C)61.9%, 19.8%, 20.5%, 28.2%, 28.5%, 70.0%, 32.2%
D)38.2%, 16.7%, 17.0%, 22.0%, 22.2%, 41.2%, 24.4%
A)61.8%, 20.0%, 20.5%, 28.2%, 28.5%, 70.0%, 32.3%
B)61.8%, 83.3%, 83.0%, 78.0%, 77.8%, 58.8%, 75.6%
C)61.9%, 19.8%, 20.5%, 28.2%, 28.5%, 70.0%, 32.2%
D)38.2%, 16.7%, 17.0%, 22.0%, 22.2%, 41.2%, 24.4%
Question
Complete the balance sheet.
Jake's Janitorial Service: fixed assets $80,000; long-term notes $58,000; equity $110,000; accounts payable $25,000; notes payable $10,000; inventory $55,000; accounts receivable $49,000; cash
$19,000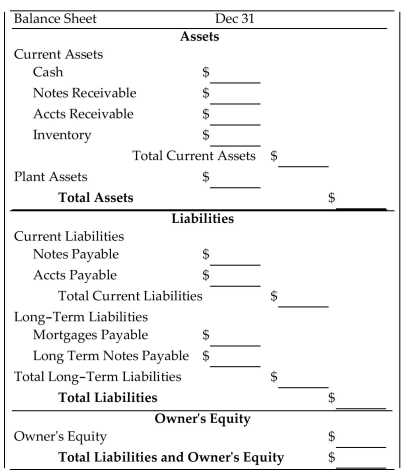
A)Assets: 19,000; 0; 49,000; 55,000; 123,000; 80,000; 203,000
Liabilities: 58,000; 25,000; 83,000; 0; 10,000; 10,000; 93,000
Owner's Equity: 110,000; 203,000
B)Assets: 19,000; 0; 49,000; 123,000; 55,000; 80,000; 203,000
Liabilities: 58,000; 25,000; 83,000; 0; 10,000; 10,000; 93,000
Owner's Equity: 110,000; 203,000
C)Assets: 19,000; 0; 49,000; 55,000; 123,000; 80,000; 203,000
Liabilities: 58,000; 25,000; 83,000; 0; 10,000; 10,000; 110,000
Owner's Equity: 93,000; 203,000
D)Assets: 19,000; 0; 49,000; 55,000; 123,000; 80,000; 203,000
Liabilities: 10,000; 25,000; 35,000; 0; 58,000; 58,000; 93,000
Owner's Equity: 110,000; 203,000
Question
Question
Complete the income statement.
Camelot Sales Inc. had gross sales of $2,659,000 with returns of $59,700. The inventory on January 1 was $570,000. During the year $1,062,000 worth of goods was purchased with freight of $5,600. The
Inventory on December 31 was $519,000. Wages and salaries were $82,600, rent was $14,500,
Advertising was $17,400, utilities were $5,200, business taxes totaled $9,000, and miscellaneous
Expenses were $6,200.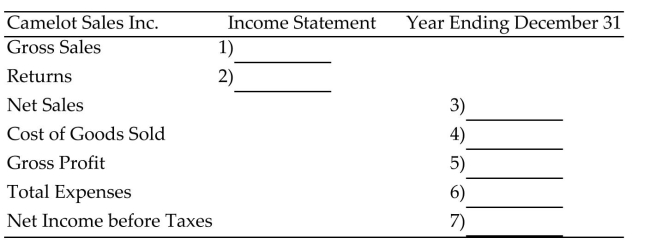
A)1)$2,659,000, 2)$59,700, 3)$2,599,300, 4)$1,118,600, 5)$1,480,700, 6)$134,900, 7)$1,465,200
B)1)$2,659,000, 2)$59,700, 3)$2,718,700, 4)$1,118,600, 5)$1,600,100, 6)$134,900, 7)$1,465,200
C)1)$2,659,000, 2)$59,700, 3)$2,599,300, 4)$1,118,600, 5)$1,480,700, 6)$134,900, 7)$1,345,800
D)1)$2,659,000, 2)$59,700, 3)$2,599,300, 4)$1,107,400, 5)$1,491,900, 6)$134,900, 7)$1,345,800

Unlock Deck
Sign up to unlock the cards in this deck!
Unlock Deck
Unlock Deck
1/54
Play
Full screen (f)
Deck 15: Financial Statements and Ratios
1
The table compares the national averages for an industry to the results for a given company in the industry. Identify any areas that might require attention by management and offer suggestions.
Net income is lower while wages are lower and rent is higher than average. (Suggestions will vary.)
2
Provide an appropriate response.
Explain the purpose of a balance sheet.
Explain the purpose of a balance sheet.
Answers will vary.
3
The table compares the national averages for an industry to the results for a given company in the industry. Identify any areas that might require attention by management and offer suggestions.
Net income is lower while total expenses and rent are higher than average. (Suggestions will vary.)
4
Provide an appropriate response.
Explain the purpose of the ratio of net income after taxes to average owner's equity.
Explain the purpose of the ratio of net income after taxes to average owner's equity.
Unlock Deck
Unlock for access to all 54 flashcards in this deck.
Unlock Deck
k this deck
5
Provide an appropriate response.
Explain why the acid-test ratio is a better measure of financial health than the current ratio.
Explain why the acid-test ratio is a better measure of financial health than the current ratio.
Unlock Deck
Unlock for access to all 54 flashcards in this deck.
Unlock Deck
k this deck
6
Complete the comparative income statement. Round percents to the nearest tenth of a percent.
Unlock Deck
Unlock for access to all 54 flashcards in this deck.
Unlock Deck
k this deck
7
Provide an appropriate response.
Explain how to determine the cost of goods sold.
Explain how to determine the cost of goods sold.
Unlock Deck
Unlock for access to all 54 flashcards in this deck.
Unlock Deck
k this deck
8
Complete the balance sheet using vertical analysis. Round to the nearest tenth of a percent.
Unlock Deck
Unlock for access to all 54 flashcards in this deck.
Unlock Deck
k this deck
9
Find (a) the gross profit, (b) the net income before taxes, and (c) the net income after taxes.
MidState Machinery has a cost of goods sold of $90,000, operating expenses of $66,000, taxes of $9,000, and net sales of $288,000.
A)(a)$24,000 (b)$132,000 (c)$123,000
B)(a)$222,000 (b)$132,000 (c)$123,000
C)(a)$24,000 (b)$198,000 (c)$189,000
D)(a)$198,000 (b)$132,000 (c)$123,000
MidState Machinery has a cost of goods sold of $90,000, operating expenses of $66,000, taxes of $9,000, and net sales of $288,000.
A)(a)$24,000 (b)$132,000 (c)$123,000
B)(a)$222,000 (b)$132,000 (c)$123,000
C)(a)$24,000 (b)$198,000 (c)$189,000
D)(a)$198,000 (b)$132,000 (c)$123,000
Unlock Deck
Unlock for access to all 54 flashcards in this deck.
Unlock Deck
k this deck
10
Provide an appropriate response.
Explain the purpose of a horizontal analysis of an income statement.
Explain the purpose of a horizontal analysis of an income statement.
Unlock Deck
Unlock for access to all 54 flashcards in this deck.
Unlock Deck
k this deck
11
The following chart shows some figures from an income statement. Prepare a vertical analysis by expressing each item as a percent of net sales. Round percents to the nearest tenth of a percent.
A)32.0%, 9.0%, 52.6%, 3.8%
B)32.0%, 9.1%, 14.8%, 11.9%
C)32.0%, 28.1%, 14.8%, 11.9%
D)32.0%, 9.0%, 4.7%, 3.8%
A)32.0%, 9.0%, 52.6%, 3.8%
B)32.0%, 9.1%, 14.8%, 11.9%
C)32.0%, 28.1%, 14.8%, 11.9%
D)32.0%, 9.0%, 4.7%, 3.8%
Unlock Deck
Unlock for access to all 54 flashcards in this deck.
Unlock Deck
k this deck
12
Provide an appropriate response.
Explain the purpose of an income statement.
Explain the purpose of an income statement.
Unlock Deck
Unlock for access to all 54 flashcards in this deck.
Unlock Deck
k this deck
13
Complete the income statement.
Central Data Inc. had gross sales of $212,000 with returns of $5,100. The inventory on January 1 was $56,000. During the year $101,000 worth of goods was purchased with freight of $1,700. The inventory on December 31 was $53,000. Wages and salaries were $54,400, rent was $13,600, advertising was $2,200, utilities were $2,700, business taxes totaled $5,600, and miscellaneous expenses were $3,800.
A)1)$212,000, 2)$5,100, 3)$206,900, 4)$105,700, 5)$101,200, 6)$82,300, 7)$18,900
B)1)$212,000, 2)$5,100, 3)$206,900, 4)$105,700, 5)$101,200, 6)$82,300, 7)$29,100
C)1)$212,000, 2)$5,100, 3)$217,100, 4)$105,700, 5)$111,400, 6)$82,300, 7)$29,100
D)1)$212,000, 2)$5,100, 3)$206,900, 4)$102,300, 5)$104,600, 6)$82,300, 7)$18,900
Unlock Deck
Unlock for access to all 54 flashcards in this deck.
Unlock Deck
k this deck
14
The table compares the national averages for an industry to the results for a given company in the industry. Identify any areas that might require attention by management and offer suggestions.
Unlock Deck
Unlock for access to all 54 flashcards in this deck.
Unlock Deck
k this deck
15
Complete the income statement.
Cindy's Sweet Shop had gross sales of $370,000 with returns of $6,900. The inventory on January 1 was $50,000. During the year $181,000 worth of goods was purchased with freight of $1,900. The
Inventory on December 31 was $50,000. Wages and salaries were $23,100, rent was $8,700,
Advertising was $5,100, utilities were $2,300, business taxes totaled $5,400, and miscellaneous
Expenses were $3,500.
A)1)$370,000, 2)$6,900, 3)$363,100, 4)$182,900, 5)$180,200, 6)$48,100, 7)$132,100
B)1)$370,000, 2)$6,900, 3)$363,100, 4)$182,900, 5)$180,200, 6)$48,100, 7)$145,900
C)1)$370,000, 2)$6,900, 3)$363,100, 4)$179,100, 5)$184,000, 6)$48,100, 7)$132,100
D)1)$370,000, 2)$6,900, 3)$376,900, 4)$182,900, 5)$194,000, 6)$48,100, 7)$145,900
Unlock Deck
Unlock for access to all 54 flashcards in this deck.
Unlock Deck
k this deck
16
The table compares the national averages for an industry to the results for a given company in the industry. Identify any areas that might require attention by management and offer suggestions.
Unlock Deck
Unlock for access to all 54 flashcards in this deck.
Unlock Deck
k this deck
17
Find the ratio of net income after taxes to average owner's equity. Round to the nearest tenth of a percent.
Owner's equity at beginning of year: $1,748,000. Owner's equity at end of year: $2,122,000. Net income after taxes: $447,500.
A)23.1%
B)21.1%
C)25.7%
D)25.6%
Owner's equity at beginning of year: $1,748,000. Owner's equity at end of year: $2,122,000. Net income after taxes: $447,500.
A)23.1%
B)21.1%
C)25.7%
D)25.6%
Unlock Deck
Unlock for access to all 54 flashcards in this deck.
Unlock Deck
k this deck
18
Complete the balance sheet.
Clara's Secretarial Services: net worth $71,000; cash $39,000; accounts receivable $24,000; inventory $41,000; fixed assets $40,000; long-term notes $26,000; mortgages $10,000; accounts payable
$14,000; notes payable $23,000
A)Assets: 39,000; 0; 24,000; 41,000; 104,000; 40,000; 144,000
Liabilities: 26,000; 14,000; 40,000; 10,000; 23,000; 33,000; 73,000
Owner's Equity: 71,000; 144,000
B)Assets: 39,000; 0; 24,000; 41,000; 104,000; 40,000; 144,000
Liabilities: 23,000; 14,000; 37,000; 10,000; 26,000; 36,000; 73,000
Owner's Equity: 71,000; 144,000
C)Assets: 39,000; 0; 24,000; 104,000; 41,000; 40,000; 144,000
Liabilities: 26,000; 14,000; 40,000; 10,000; 23,000; 33,000; 73,000
Owner's Equity: 71,000; 144,000
D)Assets: 39,000; 0; 24,000; 41,000; 104,000; 40,000; 144,000
Liabilities: 26,000; 14,000; 40,000; 10,000; 23,000; 33,000; 71,000
Owner's Equity: 73,000; 144,000
Unlock Deck
Unlock for access to all 54 flashcards in this deck.
Unlock Deck
k this deck
19
Calculate the current ratio and the acid-test ratio. Is the company healthy based on the guidelines given in the text?
A)Current ratio = 2.24 which is fine
Acid-test ratio = 0.25 which is very low
B)Current ratio = 2.24 which is fine
Acid-test ratio = 8.89 which is fine
C)Current ratio = 0.25 which is very low
Acid-test ratio = 2.24 which is fine
D)Current ratio = 8.89 which is fine
Acid-test ratio = 0.25 which is very low
Unlock Deck
Unlock for access to all 54 flashcards in this deck.
Unlock Deck
k this deck
20
Provide an appropriate response.
Explain the purpose of a vertical analysis of an income statement.
Explain the purpose of a vertical analysis of an income statement.
Unlock Deck
Unlock for access to all 54 flashcards in this deck.
Unlock Deck
k this deck
21
Complete the balance sheet.
Mullen's Hardware: mortgage $36,000; notes payable $20,000; accounts payable $18,000; long-term notes $27,000; fixed assets $92,000; inventory $65,000; accounts receivable $42,000; notes receivable
$17,000; cash $9,000; owner's equity $124,000
A)Assets: 9,000; 17,000; 42,000; 65,000; 133,000; 92,000; 225,000
Liabilities: 20,000; 18,000; 38,000; 36,000; 27,000; 63,000; 101,000
Owner's Equity: 124,000; 225,000
B)Assets: 9,000; 17,000; 42,000; 65,000; 133,000; 92,000; 225,000
Liabilities: 27,000; 18,000; 45,000; 36,000; 20,000; 56,000; 124,000
Owner's Equity: 101,000; 225,000
C)Assets: 9,000; 17,000; 42,000; 65,000; 133,000; 92,000; 225,000
Liabilities: 27,000; 18,000; 45,000; 36,000; 20,000; 56,000; 101,000
Owner's Equity: 124,000; 225,000
D)Assets: 9,000; 17,000; 42,000; 133,000; 65,000; 92,000; 225,000
Liabilities: 27,000; 18,000; 45,000; 36,000; 20,000; 56,000; 101,000
Owner's Equity: 124,000; 225,000
Unlock Deck
Unlock for access to all 54 flashcards in this deck.
Unlock Deck
k this deck
22
Find the ratio of net income after taxes to average owner's equity. Round to the nearest tenth of a percent.
Owner's equity at beginning of year: $614,000. Owner's equity at end of year: $2,058,000. Net income after taxes: $316,500.
A)51.6%
B)51.5%
C)23.7%
D)15.4%
Owner's equity at beginning of year: $614,000. Owner's equity at end of year: $2,058,000. Net income after taxes: $316,500.
A)51.6%
B)51.5%
C)23.7%
D)15.4%
Unlock Deck
Unlock for access to all 54 flashcards in this deck.
Unlock Deck
k this deck
23
Complete the horizontal analysis for the comparative income statement. Round to the nearest tenth of a percent.
A)13.9%, -140.0%, 14.2%, -7.8%, 47.8%, -118.7%, 48.7%
B)17.9%, -40.0%, 18.1%, -1.9%, 60.1%, 37.5%, 62.0%
C)-17.9%, 40.0%, -18.1%, 1.9%, -60.1%, -37.5%, -62.0%
D)15.2%, -66.7%, 15.4%, -2.0%, 37.5%, 27.3%, 38.3%
A)13.9%, -140.0%, 14.2%, -7.8%, 47.8%, -118.7%, 48.7%
B)17.9%, -40.0%, 18.1%, -1.9%, 60.1%, 37.5%, 62.0%
C)-17.9%, 40.0%, -18.1%, 1.9%, -60.1%, -37.5%, -62.0%
D)15.2%, -66.7%, 15.4%, -2.0%, 37.5%, 27.3%, 38.3%
Unlock Deck
Unlock for access to all 54 flashcards in this deck.
Unlock Deck
k this deck
24
Find the ratio of net income after taxes to average owner's equity. Round to the nearest tenth of a percent.
Owner's equity at beginning of year: $531,000. Owner's equity at end of year: $852,000. Net income after taxes: $10,500
A)2.1%
B)1.5%
C)2.0%
D)1.2%
Owner's equity at beginning of year: $531,000. Owner's equity at end of year: $852,000. Net income after taxes: $10,500
A)2.1%
B)1.5%
C)2.0%
D)1.2%
Unlock Deck
Unlock for access to all 54 flashcards in this deck.
Unlock Deck
k this deck
25
Complete the horizontal analysis for the comparative income statement. Round to the nearest tenth of a percent.
A)11.9%, 75.0%, 11.6%, 9.1%, 16.2%, -36.2%, 25.0%
B)5.6%, -50.0%, 5.2%, -0.8%, -1.8%, -161.2%, 4.0%
C)10.7%, 42.9%, 10.4%, 8.3%, 13.9%, -56.9%, 20.0%
D)-11.9%, -75.0%, -11.6%, -9.1%, -16.2%, 36.2%, -25.0%
A)11.9%, 75.0%, 11.6%, 9.1%, 16.2%, -36.2%, 25.0%
B)5.6%, -50.0%, 5.2%, -0.8%, -1.8%, -161.2%, 4.0%
C)10.7%, 42.9%, 10.4%, 8.3%, 13.9%, -56.9%, 20.0%
D)-11.9%, -75.0%, -11.6%, -9.1%, -16.2%, 36.2%, -25.0%
Unlock Deck
Unlock for access to all 54 flashcards in this deck.
Unlock Deck
k this deck
26
Find (a) the gross profit, (b) the net income before taxes, and (c) the net income after taxes.
Eddie's TV and Appliance had gross sales of $619,000, returns of $27,000, operating expenses of $153,000, taxes of $30,950, and a cost of goods sold of $241,000.
A)(a)$351,000 (b)$198,000 (c)$167,050
B)(a)$466,000 (b)$198,000 (c)$167,050
C)(a)$378,000 (b)$198,000 (c)$167,050
D)(a)$439,000 (b)$198,000 (c)$167,050
Unlock Deck
Unlock for access to all 54 flashcards in this deck.
Unlock Deck
k this deck
27
Complete the income statement.
Frank's Nursery had gross sales of $2,273,000 with returns of $57,800. The inventory on January 1 was $567,000. During the year $1,130,000 worth of goods was purchased with freight of $5,600. The
Inventory on December 31 was $525,000. Wages and salaries were $81,600, rent was $10,200,
Advertising was $17,700, utilities were $5,200, business taxes totaled $8,500, and miscellaneous
Expenses were $6,100.
A)1)$2,273,000, 2)$57,800, 3)$2,215,200, 4)$1,177,600, 5)$1,037,600, 6)$129,300, 7)$908,300
B)1)$2,273,000, 2)$57,800, 3)$2,215,200, 4)$1,166,400, 5)$1,048,800, 6)$129,300, 7)$908,300
C)1)$2,273,000, 2)$57,800, 3)$2,330,800, 4)$1,177,600, 5)$1,153,200, 6)$129,300, 7)$1,023,900
D)1)$2,273,000, 2)$57,800, 3)$2,215,200, 4)$1,177,600, 5)$1,037,600, 6)$129,300, 7)$1,023,900
Unlock Deck
Unlock for access to all 54 flashcards in this deck.
Unlock Deck
k this deck
28
Find the current ratio and the acid-test ratio for the indicated year. Round each ratio to the nearest hundredth of a percent.
This year current liabilities are $234,000.
A)1.24; 0.60
B)1.48; 0.88
C)1.48; 0.56
D)1.24; 0.88
This year current liabilities are $234,000.A)1.24; 0.60
B)1.48; 0.88
C)1.48; 0.56
D)1.24; 0.88
Unlock Deck
Unlock for access to all 54 flashcards in this deck.
Unlock Deck
k this deck
29
Complete the income statement.
Bay Side Videos had gross sales of $530,000 with returns of $6,300. The inventory on January 1 was $56,000. During the year $237,000 worth of goods was purchased with freight of $1,900. The
Inventory on December 31 was $56,000. Wages and salaries were $57,500, rent was $11,100,
Advertising was $4,000, utilities were $2,500, business taxes totaled $5,700, and miscellaneous
Expenses were $3,200.
A)1)$530,000, 2)$6,300, 3)$523,700, 4)$235,100, 5)$288,600, 6)$84,000, 7)$200,800
B)1)$530,000, 2)$6,300, 3)$523,700, 4)$238,900, 5)$284,800, 6)$84,000, 7)$213,400
C)1)$530,000, 2)$6,300, 3)$523,700, 4)$238,900, 5)$284,800, 6)$84,000, 7)$200,800
D)1)$530,000, 2)$6,300, 3)$536,300, 4)$238,900, 5)$297,400, 6)$84,000, 7)$213,400
Unlock Deck
Unlock for access to all 54 flashcards in this deck.
Unlock Deck
k this deck
30
The following chart shows some figures from an income statement. Prepare a vertical analysis by expressing each item as a percent of net sales. Round percents to the nearest tenth of a percent.
A)40.7%, 8.2%, 5.0%, 4.7%
B)40.7%, 8.3%, 12.2%, 11.6%
C)40.7%, 8.2%, 60.6%, 4.7%
D)40.7%, 20.2%, 12.2%, 11.6%
A)40.7%, 8.2%, 5.0%, 4.7%
B)40.7%, 8.3%, 12.2%, 11.6%
C)40.7%, 8.2%, 60.6%, 4.7%
D)40.7%, 20.2%, 12.2%, 11.6%
Unlock Deck
Unlock for access to all 54 flashcards in this deck.
Unlock Deck
k this deck
31
Complete the horizontal analysis for the comparative income statement. Round to the nearest tenth of a percent.
A)0.2%, -140.0%, 0.5%, -1.6%, -12.3%, -141.4%, -16.8%
B)5.8%, -66.7%, 6.1%, 7.3%, 3.9%, 23.7%, 1.2%
C)-6.2%, 40.0%, -6.5%, -7.9%, -4.1%, -31.0%, -1.3%
D)6.2%, -40.0%, 6.5%, 7.9%, 4.1%, 31.0%, 1.3%
A)0.2%, -140.0%, 0.5%, -1.6%, -12.3%, -141.4%, -16.8%
B)5.8%, -66.7%, 6.1%, 7.3%, 3.9%, 23.7%, 1.2%
C)-6.2%, 40.0%, -6.5%, -7.9%, -4.1%, -31.0%, -1.3%
D)6.2%, -40.0%, 6.5%, 7.9%, 4.1%, 31.0%, 1.3%
Unlock Deck
Unlock for access to all 54 flashcards in this deck.
Unlock Deck
k this deck
32
Find the current ratio and the acid-test ratio for the indicated year. Round each ratio to the nearest hundredth of a percent.
This year current liabilities are $227,000.
A)1.27; 0.95
B)1.57; 0.67
C)1.57; 0.95
D)1.27; 0.70
This year current liabilities are $227,000.A)1.27; 0.95
B)1.57; 0.67
C)1.57; 0.95
D)1.27; 0.70
Unlock Deck
Unlock for access to all 54 flashcards in this deck.
Unlock Deck
k this deck
33
Find the current ratio and the acid-test ratio for the indicated year. Round each ratio to the nearest hundredth of a percent.
Last year current liabilities were $197,000.
A)1.46; 0.85
B)1.46; 0.66
C)1.25; 0.71
D)1.25; 0.85
Last year current liabilities were $197,000.A)1.46; 0.85
B)1.46; 0.66
C)1.25; 0.71
D)1.25; 0.85
Unlock Deck
Unlock for access to all 54 flashcards in this deck.
Unlock Deck
k this deck
34
Calculate the current ratio and the acid-test ratio. Is the company healthy based on the guidelines given in the text?
A)Current ratio = 1.37 which is too low
Acid-test ratio = 2.88 which is fine
B)Current ratio = 2.11 which is fine
Acid-test ratio = 1.37 which is too low
C)Current ratio = 2.88 which is fine
Acid-test ratio = 2.11 which is fine
D)Current ratio = 2.88 which is fine
Acid-test ratio = 1.37 which is fine
Unlock Deck
Unlock for access to all 54 flashcards in this deck.
Unlock Deck
k this deck
35
Find the current ratio and the acid-test ratio for the indicated year. Round each ratio to the nearest hundredth of a percent.
Last year current liabilities were $234,000.
A)1.19; 0.74
B)1.36; 0.70
C)1.36; 0.83
D)1.19; 0.83
Last year current liabilities were $234,000.A)1.19; 0.74
B)1.36; 0.70
C)1.36; 0.83
D)1.19; 0.83
Unlock Deck
Unlock for access to all 54 flashcards in this deck.
Unlock Deck
k this deck
36
Complete the horizontal analysis for the balance sheet. Round to the nearest tenth of a percent.
A)-55.8%, 99.8%, 4.0%, 64.1%, 19.8%, -32.4%, 13.2%
B)-126.7%, 50.0%, 3.8%, 39.1%, 16.6%, -48.0%, 11.7%
C)226.7%, 50.0%, 96.2%, 60.9%, 83.4%, 148.0%, 88.3%
D)-55.9%, 100.0%, 4.0%, 64.1%, 19.8%, -32.4%, 13.3%
A)-55.8%, 99.8%, 4.0%, 64.1%, 19.8%, -32.4%, 13.2%
B)-126.7%, 50.0%, 3.8%, 39.1%, 16.6%, -48.0%, 11.7%
C)226.7%, 50.0%, 96.2%, 60.9%, 83.4%, 148.0%, 88.3%
D)-55.9%, 100.0%, 4.0%, 64.1%, 19.8%, -32.4%, 13.3%
Unlock Deck
Unlock for access to all 54 flashcards in this deck.
Unlock Deck
k this deck
37
Complete the horizontal analysis for the comparative income statement. Round to the nearest tenth of a percent.
A)-27.6%, 35.7%, -28.9%, -7.6%, -40.6%, -34.4%, -41.0%
B)27.6%, -35.7%, 28.9%, 7.6%, 40.6%, 34.4%, 41.0%
C)21.6%, -55.6%, 22.4%, 7.0%, 28.9%, 25.6%, 29.1%
D)13.7%, -107.1%, 14.7%, -32.3%, 18.6%, -278.1%, 17.5%
A)-27.6%, 35.7%, -28.9%, -7.6%, -40.6%, -34.4%, -41.0%
B)27.6%, -35.7%, 28.9%, 7.6%, 40.6%, 34.4%, 41.0%
C)21.6%, -55.6%, 22.4%, 7.0%, 28.9%, 25.6%, 29.1%
D)13.7%, -107.1%, 14.7%, -32.3%, 18.6%, -278.1%, 17.5%
Unlock Deck
Unlock for access to all 54 flashcards in this deck.
Unlock Deck
k this deck
38
Complete the horizontal analysis for the balance sheet. Round to the nearest tenth of a percent.
A)71.9%, 77.8%, 92.2%, 80.0%, 82.9%, 75.5%, 81.9%
B)39.1%, 28.4%, 8.4%, 25.0%, 20.7%, 32.4%, 22.0%
C)28.1%, 22.2%, 7.8%, 20.0%, 17.1%, 24.5%, 18.1%
D)39.0%, 28.6%, 8.4%, 25.0%, 20.7%, 32.4%, 22.1%
A)71.9%, 77.8%, 92.2%, 80.0%, 82.9%, 75.5%, 81.9%
B)39.1%, 28.4%, 8.4%, 25.0%, 20.7%, 32.4%, 22.0%
C)28.1%, 22.2%, 7.8%, 20.0%, 17.1%, 24.5%, 18.1%
D)39.0%, 28.6%, 8.4%, 25.0%, 20.7%, 32.4%, 22.1%
Unlock Deck
Unlock for access to all 54 flashcards in this deck.
Unlock Deck
k this deck
39
Calculate the current ratio and the acid-test ratio. Is the company healthy based on the guidelines given in the text?
A)Current ratio = 1.31 which is too low
Acid-test ratio = 2.09 which is fine
B)Current ratio = 2.09 which is fine
Acid-test ratio = 1.60 which is fine
C)Current ratio = 2.09 which is fine
Acid-test ratio = 1.31 which is fine
D)Current ratio = 1.60 which is low
Acid-test ratio = 1.31 which is fine
A)Current ratio = 1.31 which is too low
Acid-test ratio = 2.09 which is fine
B)Current ratio = 2.09 which is fine
Acid-test ratio = 1.60 which is fine
C)Current ratio = 2.09 which is fine
Acid-test ratio = 1.31 which is fine
D)Current ratio = 1.60 which is low
Acid-test ratio = 1.31 which is fine
Unlock Deck
Unlock for access to all 54 flashcards in this deck.
Unlock Deck
k this deck
40
The following chart shows some figures from an income statement. Prepare a vertical analysis by expressing each item as a percent of net sales. Round percents to the nearest tenth of a percent.
A)65.5%, 11.3%, 5.6%, 15.5%
B)65.5%, 17.2%, 8.5%, 23.6%
C)65.5%, 11.5%, 8.5%, 23.6%
D)65.5%, 11.3%, 49.2%, 15.5%
A)65.5%, 11.3%, 5.6%, 15.5%
B)65.5%, 17.2%, 8.5%, 23.6%
C)65.5%, 11.5%, 8.5%, 23.6%
D)65.5%, 11.3%, 49.2%, 15.5%
Unlock Deck
Unlock for access to all 54 flashcards in this deck.
Unlock Deck
k this deck
41
Calculate the current ratio and the acid-test ratio. Is the company healthy based on the guidelines given in the text?
A)Current ratio = 1.31 which is too low
Acid-test ratio = 1.67 which is fine
B)Current ratio = 0.78 which is too low
Acid-test ratio = 1.31 which is too low
C)Current ratio = 1.67 which is too low
Acid-test ratio = 0.78 which is too low
D)Current ratio = 1.31 which is too low
Acid-test ratio = 0.78 which is too low
Unlock Deck
Unlock for access to all 54 flashcards in this deck.
Unlock Deck
k this deck
42
The following chart shows some figures from an income statement. Prepare a vertical analysis by expressing each item as a percent of net sales. Round percents to the nearest tenth of a percent.
A)34.3%, 6.1%, 4.7%, 11.2%
B)34.3%, 6.1%, 76.5%, 11.2%
C)34.3%, 6.2%, 13.6%, 32.5%
D)34.3%, 17.8%, 13.6%, 32.5%
A)34.3%, 6.1%, 4.7%, 11.2%
B)34.3%, 6.1%, 76.5%, 11.2%
C)34.3%, 6.2%, 13.6%, 32.5%
D)34.3%, 17.8%, 13.6%, 32.5%
Unlock Deck
Unlock for access to all 54 flashcards in this deck.
Unlock Deck
k this deck
43
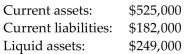
Prepare a vertical analysis. Round percents to the nearest tenth of a percent.
Current assets: $407,000 Current liabilities: $189,000
Liquid assets: $149,000
A)Current ratio = 2.15 which is fine
Acid-test ratio = 0.79 which is too low
B)Current ratio = 2.73 which is fine
Acid-test ratio = 0.79 which is too low
C)Current ratio = 2.15 which is fine
Acid-test ratio = 2.73 which is fine
D)Current ratio = 0.79 which is too low
Acid-test ratio = 2.15 which is fine
Unlock Deck
Unlock for access to all 54 flashcards in this deck.
Unlock Deck
k this deck
44
Complete the balance sheet.
Data-Serve Computer Services: fixed assets $59,000; mortgages $36,000; accounts payable $19,000; notes payable $15,000; long-term notes $26,000; equity $60,000; cash $17,000; inventory $18,000;
Notes receivable $9,000; accounts receivable $53,000
A)Assets: 17,000; 9,000; 53,000; 18,000; 97,000; 59,000; 156,000
Liabilities: 26,000; 19,000; 45,000; 36,000; 15,000; 51,000; 96,000
Owner's Equity: 60,000; 156,000
B)Assets: 17,000; 9,000; 53,000; 18,000; 97,000; 59,000; 156,000
Liabilities: 15,000; 19,000; 34,000; 36,000; 26,000; 62,000; 96,000
Owner's Equity: 60,000; 156,000
C)Assets: 17,000; 9,000; 53,000; 97,000; 18,000; 59,000; 156,000
Liabilities: 26,000; 19,000; 45,000; 36,000; 15,000; 51,000; 96,000
Owner's Equity: 60,000; 156,000
D)Assets: 17,000; 9,000; 53,000; 18,000; 97,000; 59,000; 156,000
Liabilities: 26,000; 19,000; 45,000; 36,000; 15,000; 51,000; 60,000
Owner's Equity: 96,000; 156,000
Unlock Deck
Unlock for access to all 54 flashcards in this deck.
Unlock Deck
k this deck
45
Prepare a vertical analysis. Round percents to the nearest tenth of a percent.
Wandell's Garden Shop had a cost of goods sold of $111,000, operating expenses of $43,000, and net sales of $203,000.
A)Percent cost of goods sold = 21.2%
Percent operating expenses = 54.7%
B)Percent cost of goods sold = 33.5%
Percent operating expenses = 54.7%
C)Percent cost of goods sold = 54.7%
Percent operating expenses = 21.2%
D)Percent cost of goods sold = 54.7%
Percent operating expenses = 33.5%
Unlock Deck
Unlock for access to all 54 flashcards in this deck.
Unlock Deck
k this deck
46
Complete the horizontal analysis for the comparative income statement. Round to the nearest tenth of a percent.
A)12.1%, 37.5%, 12.0%, 10.1%, 15.8%, 14.1%, 16.1%
B)-13.8%, -60.0%, -13.7%, -11.3%, -18.8%, -16.4%, -19.1%
C)7.2%, -140.0%, 7.0%, 1.5%, -2.1%, -132.8%, -5.1%
D)13.8%, 60.0%, 13.7%, 11.3%, 18.8%, 16.4%, 19.1%
A)12.1%, 37.5%, 12.0%, 10.1%, 15.8%, 14.1%, 16.1%
B)-13.8%, -60.0%, -13.7%, -11.3%, -18.8%, -16.4%, -19.1%
C)7.2%, -140.0%, 7.0%, 1.5%, -2.1%, -132.8%, -5.1%
D)13.8%, 60.0%, 13.7%, 11.3%, 18.8%, 16.4%, 19.1%
Unlock Deck
Unlock for access to all 54 flashcards in this deck.
Unlock Deck
k this deck
47
Complete the horizontal analysis for the balance sheet. Round to the nearest tenth of a percent.
A)-121.4%, -14.3%, 12.7%, 25.0%, 11.6%, 14.3%, 12.0%
B)221.4%, 114.3%, 87.3%, 75.0%, 88.4%, 85.7%, 88.0%
C)-54.9%, -12.7%, 14.6%, 33.3%, 13.2%, 16.7%, 13.5%
D)-54.8%, -12.5%, 14.6%, 33.3%, 13.2%, 16.7%, 13.6%
A)-121.4%, -14.3%, 12.7%, 25.0%, 11.6%, 14.3%, 12.0%
B)221.4%, 114.3%, 87.3%, 75.0%, 88.4%, 85.7%, 88.0%
C)-54.9%, -12.7%, 14.6%, 33.3%, 13.2%, 16.7%, 13.5%
D)-54.8%, -12.5%, 14.6%, 33.3%, 13.2%, 16.7%, 13.6%
Unlock Deck
Unlock for access to all 54 flashcards in this deck.
Unlock Deck
k this deck
48
Find (a) the gross profit, (b) the net income before taxes, and (c) the net income after taxes.
Steel Master Sales had a cost of goods sold of $244,000, operating expenses of $157,000, returns of $16,000, taxes of $26,900, and gross sales of $538,000.
A)(a)$381,000 (b)$121,000 (c)$94,100
B)(a)$294,000 (b)$121,000 (c)$94,100
C)(a)$278,000 (b)$121,000 (c)$94,100
D)(a)$365,000 (b)$121,000 (c)$94,100
Unlock Deck
Unlock for access to all 54 flashcards in this deck.
Unlock Deck
k this deck
49
Prepare a vertical analysis. Round percents to the nearest tenth of a percent.
Rosie's Cleaning Service had a cost of goods sold of $48,000, operating expenses of $218,000, and net sales of $365,000.
A)Percent cost of goods sold = 59.7%
Percent operating expenses = 13.2%
B)Percent cost of goods sold = 13.2%
Percent operating expenses = 72.9%
C)Percent cost of goods sold = 72.9%
Percent operating expenses = 13.2%
D)Percent cost of goods sold = 13.2%
Percent operating expenses = 59.7%
Unlock Deck
Unlock for access to all 54 flashcards in this deck.
Unlock Deck
k this deck
50
Find (a) the gross profit, (b) the net income before taxes, and (c) the net income after taxes.
Jill's Cleaning Service had net sales of $415,000, operating expenses of $96,000, taxes of $20,750,and a cost of goods sold of $51,000.
A)(a)$45,000 (b)$268,000 (c)$247,250
B)(a)$364,000 (b)$268,000 (c)$247,250
C)(a)$45,000 (b)$364,000 (c)$343,250
D)(a)$319,000 (b)$268,000 (c)$247,250
Jill's Cleaning Service had net sales of $415,000, operating expenses of $96,000, taxes of $20,750,and a cost of goods sold of $51,000.
A)(a)$45,000 (b)$268,000 (c)$247,250
B)(a)$364,000 (b)$268,000 (c)$247,250
C)(a)$45,000 (b)$364,000 (c)$343,250
D)(a)$319,000 (b)$268,000 (c)$247,250
Unlock Deck
Unlock for access to all 54 flashcards in this deck.
Unlock Deck
k this deck
51
Complete the horizontal analysis for the balance sheet. Round to the nearest tenth of a percent.
A)61.8%, 20.0%, 20.5%, 28.2%, 28.5%, 70.0%, 32.3%
B)61.8%, 83.3%, 83.0%, 78.0%, 77.8%, 58.8%, 75.6%
C)61.9%, 19.8%, 20.5%, 28.2%, 28.5%, 70.0%, 32.2%
D)38.2%, 16.7%, 17.0%, 22.0%, 22.2%, 41.2%, 24.4%
A)61.8%, 20.0%, 20.5%, 28.2%, 28.5%, 70.0%, 32.3%
B)61.8%, 83.3%, 83.0%, 78.0%, 77.8%, 58.8%, 75.6%
C)61.9%, 19.8%, 20.5%, 28.2%, 28.5%, 70.0%, 32.2%
D)38.2%, 16.7%, 17.0%, 22.0%, 22.2%, 41.2%, 24.4%
Unlock Deck
Unlock for access to all 54 flashcards in this deck.
Unlock Deck
k this deck
52
Complete the balance sheet.
Jake's Janitorial Service: fixed assets $80,000; long-term notes $58,000; equity $110,000; accounts payable $25,000; notes payable $10,000; inventory $55,000; accounts receivable $49,000; cash
$19,000
A)Assets: 19,000; 0; 49,000; 55,000; 123,000; 80,000; 203,000
Liabilities: 58,000; 25,000; 83,000; 0; 10,000; 10,000; 93,000
Owner's Equity: 110,000; 203,000
B)Assets: 19,000; 0; 49,000; 123,000; 55,000; 80,000; 203,000
Liabilities: 58,000; 25,000; 83,000; 0; 10,000; 10,000; 93,000
Owner's Equity: 110,000; 203,000
C)Assets: 19,000; 0; 49,000; 55,000; 123,000; 80,000; 203,000
Liabilities: 58,000; 25,000; 83,000; 0; 10,000; 10,000; 110,000
Owner's Equity: 93,000; 203,000
D)Assets: 19,000; 0; 49,000; 55,000; 123,000; 80,000; 203,000
Liabilities: 10,000; 25,000; 35,000; 0; 58,000; 58,000; 93,000
Owner's Equity: 110,000; 203,000
Unlock Deck
Unlock for access to all 54 flashcards in this deck.
Unlock Deck
k this deck
53
Find the ratio of net income after taxes to average owner's equity. Round to the nearest tenth of a percent.
Owner's equity at beginning of year: $602,000. Owner's equity at end of year: $806,000. Net income after taxes: $93,500.
A)15.5%
B)11.6%
C)15.6%
D)13.3%
Owner's equity at beginning of year: $602,000. Owner's equity at end of year: $806,000. Net income after taxes: $93,500.
A)15.5%
B)11.6%
C)15.6%
D)13.3%
Unlock Deck
Unlock for access to all 54 flashcards in this deck.
Unlock Deck
k this deck
54
Complete the income statement.
Camelot Sales Inc. had gross sales of $2,659,000 with returns of $59,700. The inventory on January 1 was $570,000. During the year $1,062,000 worth of goods was purchased with freight of $5,600. The
Inventory on December 31 was $519,000. Wages and salaries were $82,600, rent was $14,500,
Advertising was $17,400, utilities were $5,200, business taxes totaled $9,000, and miscellaneous
Expenses were $6,200.
A)1)$2,659,000, 2)$59,700, 3)$2,599,300, 4)$1,118,600, 5)$1,480,700, 6)$134,900, 7)$1,465,200
B)1)$2,659,000, 2)$59,700, 3)$2,718,700, 4)$1,118,600, 5)$1,600,100, 6)$134,900, 7)$1,465,200
C)1)$2,659,000, 2)$59,700, 3)$2,599,300, 4)$1,118,600, 5)$1,480,700, 6)$134,900, 7)$1,345,800
D)1)$2,659,000, 2)$59,700, 3)$2,599,300, 4)$1,107,400, 5)$1,491,900, 6)$134,900, 7)$1,345,800
Unlock Deck
Unlock for access to all 54 flashcards in this deck.
Unlock Deck
k this deck
Unlock Deck
Unlock for access to all 54 flashcards in this deck.


