Deck 23: Income Inequality, Poverty, and Discrimination
Full screen (f)
Question
Question
Question
Question
Question
Question
Question
Question
Question
Question
Question
Question
Question
Question
Question
Question
Question
Question
Question
Question
Question
Question
Question
Question
Question
Question
Question
Question
Question
Question
Question
Question
Question
Question
Question
Question
Question
Question
Question
Question
Question
Question
Question
Question
Question
Question
Question
Question
Question
Question
Question
 Refer to the table. The decline in percentage of income received from before taxes and transfers to after taxes and transfers is greatest for the
A)second 20 percent of households.
B)third 20 percent of households.
C)fourth 20 percent of households.
D)highest 20 percent of households.
Question
Question
 Refer to the table. The decline in percentage of income received from before taxes and transfers to after taxes and transfers is greatest for the
A)randomly hire African-American and white workers if the actual African-American-white wage differential is more than $4.
B)randomly hire African-American and white workers if the actual African-American-white wage differential is less than $4.
C)hire only African Americans if the actual African-American-white wage differential is less than $4.
D)hire only African Americans if the actual African-American-white wage differential is more than $4.
Question
Question
Question
Question
Question
Question
Question
Question
Question
Question
 Refer to the diagram, where curves (a)through (e)are Lorenz curves for five different countries. Income is equally distributed in
A)0 and 10,000.
B)1 and 10.
C)−1 and +1.
D)0 and 1.
Question
Question
 Refer to the diagram, where curves (a)through (e)are for five different countries. The Gini ratio is lowest in country
A)none of the countries shown.
B)country b.
C)countries a and e.
D)country a.
Question
Question
Question
Question
 Refer to the diagram, where curves (a)through (e)are for five different countries. Of the countries listed below, income is most unequally distributed in country
A)a.
B)b.
C)c.
D)e.
Question
Question
Question
Question
Question
Question
Question
Question
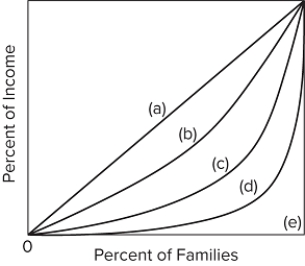 Refer to the diagram, where curves (a)through (e)are for five different countries. The Gini ratio is
A)a.
B)b.
C)c.
D)d.
Question
Question
 Which of the income distributions in the accompanying table is closest to describing the United States (as of 2017)?
A)receives about 3 percent of the total income.
B)comprises 10 percent of all households.
C)receives about 52 percent of the total income.
D)receives about 43 percent of the total income.
Question

Unlock Deck
Sign up to unlock the cards in this deck!
Unlock Deck
Unlock Deck
1/324
Play
Full screen (f)
Deck 23: Income Inequality, Poverty, and Discrimination
1
The U.S. poverty rate for the elderly (65 and over)is higher than for the general population.
False
2
The U.S. poverty rate was, in 2017, a little over 12 percent..
False
3
An employer (biased against African Americans)whose discrimination coefficient is $5 will hire only whites if the actual African-American-white wage gap is $7.
False
4
The crowding model of occupational segregation predicts that domestic output will increase if occupational segregation is ended.
Unlock Deck
Unlock for access to all 324 flashcards in this deck.
Unlock Deck
k this deck
5
The Lorenz curve is a graph that relates income to household spending.
Unlock Deck
Unlock for access to all 324 flashcards in this deck.
Unlock Deck
k this deck
6
About a quarter of all U.S. households had personal incomes of $100,000 or more in 2017.
Unlock Deck
Unlock for access to all 324 flashcards in this deck.
Unlock Deck
k this deck
7
In the United States since 1980, the poor have gotten poorer and the rich have gotten richer in both relative and absolute terms.
Unlock Deck
Unlock for access to all 324 flashcards in this deck.
Unlock Deck
k this deck
8
Currently over 90 percent of all workers in the United States are covered by Social Security.
Unlock Deck
Unlock for access to all 324 flashcards in this deck.
Unlock Deck
k this deck
9
The top 20 percent of U.S. income earners receive nearly 80 percent of total U.S. income.
Unlock Deck
Unlock for access to all 324 flashcards in this deck.
Unlock Deck
k this deck
10
TANF stands for Temporary Assistance for Needy Families.
Unlock Deck
Unlock for access to all 324 flashcards in this deck.
Unlock Deck
k this deck
11
Statistical discrimination is also known as occupational discrimination.
Unlock Deck
Unlock for access to all 324 flashcards in this deck.
Unlock Deck
k this deck
12
In the U.S., the top 20 percent of households received a little more than 50 percent of total pretax income in 2017.
Unlock Deck
Unlock for access to all 324 flashcards in this deck.
Unlock Deck
k this deck
13
Unemployment compensation is financed by taxes levied on employers.
Unlock Deck
Unlock for access to all 324 flashcards in this deck.
Unlock Deck
k this deck
14
The closer the Lorenz curve is to the diagonal, the greater is the degree of income inequality.
Unlock Deck
Unlock for access to all 324 flashcards in this deck.
Unlock Deck
k this deck
15
A curve showing the quintile distribution of a nation's income is called the Gini curve.
Unlock Deck
Unlock for access to all 324 flashcards in this deck.
Unlock Deck
k this deck
16
Since the implementation of TANF in 1996, the U.S. welfare rolls have fallen by roughly one-half and participation remains low in 2017.
Unlock Deck
Unlock for access to all 324 flashcards in this deck.
Unlock Deck
k this deck
17
The standard data on income distribution do not include the value of noncash transfers as income.
Unlock Deck
Unlock for access to all 324 flashcards in this deck.
Unlock Deck
k this deck
18
Labor market discrimination increases the size of the nation's GDP by promoting specialization on the basis of race.
Unlock Deck
Unlock for access to all 324 flashcards in this deck.
Unlock Deck
k this deck
19
A reduction in the collective discrimination coefficients of employers will increase the wage rate of those discriminated against but reduce their employment.
Unlock Deck
Unlock for access to all 324 flashcards in this deck.
Unlock Deck
k this deck
20
After the implementation of TANF, the U.S. welfare rolls fell by roughly one-half between 1996 and 2007.
Unlock Deck
Unlock for access to all 324 flashcards in this deck.
Unlock Deck
k this deck
21
The Supplemental Nutrition Assistance Program (formerly the food-stamp program)mostly pays out cash-vouchers to eligible households.
Unlock Deck
Unlock for access to all 324 flashcards in this deck.
Unlock Deck
k this deck
22
The basic reason why the debate between income equality versus inequality is ongoing is because there is a trade-off between income equality and economic efficiency.
Unlock Deck
Unlock for access to all 324 flashcards in this deck.
Unlock Deck
k this deck
23
Eligibility for social insurance programs is largely on the basis of need and "means tests."
Unlock Deck
Unlock for access to all 324 flashcards in this deck.
Unlock Deck
k this deck
24
All social insurance programs are welfare or public charity programs.
Unlock Deck
Unlock for access to all 324 flashcards in this deck.
Unlock Deck
k this deck
25
U.S. income statistics indicate that approximately one-eighth of the nation lived in poverty in 2017.
Unlock Deck
Unlock for access to all 324 flashcards in this deck.
Unlock Deck
k this deck
26
The Social Security program is financed with funds from general tax revenues of the federal government.
Unlock Deck
Unlock for access to all 324 flashcards in this deck.
Unlock Deck
k this deck
27
The Temporary Assistance for Needy Families (TANF)program that replaced the old Aid for Families with Dependent Children welfare program succeeded in reducing the number of welfare recipients and increasing the employment rate among single mothers until the 2007-2008 recession hit.
Unlock Deck
Unlock for access to all 324 flashcards in this deck.
Unlock Deck
k this deck
28
Differences in skills or ability are one major reason for income differences in the United States.
Unlock Deck
Unlock for access to all 324 flashcards in this deck.
Unlock Deck
k this deck
29
In the taste-for-discrimination model, a prejudiced employer who prefers white workers and who has a discrimination coefficient of $3/hour would still hire African-Americans if the market wage rate were $22/hour for white workers and $20/hour for African Americans.
Unlock Deck
Unlock for access to all 324 flashcards in this deck.
Unlock Deck
k this deck
30
Labor market discrimination occurs when equivalent labor resources are paid or treated differently even though their productive contributions are equal.
Unlock Deck
Unlock for access to all 324 flashcards in this deck.
Unlock Deck
k this deck
31
During the past 35 years or so, the degree of income inequality in the United States has decreased considerably.
Unlock Deck
Unlock for access to all 324 flashcards in this deck.
Unlock Deck
k this deck
32
The unequal distribution of wealth among households in the United States is one of the causes of income inequality.
Unlock Deck
Unlock for access to all 324 flashcards in this deck.
Unlock Deck
k this deck
33
The Temporary Assistance for Needy Families (TANF)program expanded welfare benefits and has no limit on the number of years for receiving welfare benefits.
Unlock Deck
Unlock for access to all 324 flashcards in this deck.
Unlock Deck
k this deck
34
If income inequality is increasing, it means that the income levels of the poor are falling while the income levels of the rich are rising.
Unlock Deck
Unlock for access to all 324 flashcards in this deck.
Unlock Deck
k this deck
35
The incidence of poverty is very high among the elderly (65 years or older).
Unlock Deck
Unlock for access to all 324 flashcards in this deck.
Unlock Deck
k this deck
36
The Gini coefficient or ratio is a summary measure of income inequality derived from the Lorenz curve.
Unlock Deck
Unlock for access to all 324 flashcards in this deck.
Unlock Deck
k this deck
37
The distribution of household income in the United States becomes more unequal after taxes and transfer payments are taken into account.
Unlock Deck
Unlock for access to all 324 flashcards in this deck.
Unlock Deck
k this deck
38
When welfare payments like housing credits are completely cut off when the recipient's income goes above a certain threshold, then this could discourage the recipient from finding more work or a better-paying job.
Unlock Deck
Unlock for access to all 324 flashcards in this deck.
Unlock Deck
k this deck
39
One basic argument for redistributing income to achieve more equality rests on the idea of maximizing the society's total utility when there is diminishing marginal utility from income.
Unlock Deck
Unlock for access to all 324 flashcards in this deck.
Unlock Deck
k this deck
40
A Universal Basic Income program would guarantee that every household receives the same income.
Unlock Deck
Unlock for access to all 324 flashcards in this deck.
Unlock Deck
k this deck
41
Which of the following Gini ratios indicates the highest degree of income inequality?
A)0.67
B)0.56
C)0.33
D)0.15
A)0.67
B)0.56
C)0.33
D)0.15
Unlock Deck
Unlock for access to all 324 flashcards in this deck.
Unlock Deck
k this deck
42
In 2017, a household with an annual income of $80,000 would find itself in the
Unlock Deck
Unlock for access to all 324 flashcards in this deck.
Unlock Deck
k this deck
43
Suppose the market wage rate for whites is $18 an hour and the monetary value a prejudiced employer attaches to the disutility of hiring African Americans is $3. This employer will be indifferent between hiring African Americans and whites only when the African-American wage rate is
A)advocate redistributing income from Joseph to Rita.
B)advocate redistributing income from Rita to Joseph.
C)be content with this distribution of income between Rita and Joseph.
D)argue that any redistribution of income between them would increase total utility.
A)advocate redistributing income from Joseph to Rita.
B)advocate redistributing income from Rita to Joseph.
C)be content with this distribution of income between Rita and Joseph.
D)argue that any redistribution of income between them would increase total utility.
Unlock Deck
Unlock for access to all 324 flashcards in this deck.
Unlock Deck
k this deck
44
Suppose Rita obtains 16 units of utility from the last dollar of income received by her, and Joseph obtains 12 units of utility from the last dollar of his income. Assume both Joseph and Rita have the same capacity to derive utility from income. Those who favor an equal distribution of income would
A)third 20 percent of households.
B)second 20 percent of households.
C)highest 20 percent of households.
D)fourth 20 percent of households.
A)third 20 percent of households.
B)second 20 percent of households.
C)highest 20 percent of households.
D)fourth 20 percent of households.
Unlock Deck
Unlock for access to all 324 flashcards in this deck.
Unlock Deck
k this deck
45
In the quintile distribution of income, the term "quintile" represents
A)$61,372.
B)$42,820.
C)$56,610.
D)$68,426.
A)$61,372.
B)$42,820.
C)$56,610.
D)$68,426.
Unlock Deck
Unlock for access to all 324 flashcards in this deck.
Unlock Deck
k this deck
46
Which of the following Gini ratios indicates the highest degree of income inequality?
A)can say that the income of population B is more equally distributed than that of population A.
B)can say that the income of population B is less equally distributed than that of population A.
C)cannot make a meaningful comparison of the income distributions of populations A and B.
D)can say that the richest quintile of population A receives 40 percent of total income.
Unlock Deck
Unlock for access to all 324 flashcards in this deck.
Unlock Deck
k this deck
47
In 2017, the average income for households in the United States was about
A)$3.
B)$12.
C)$15.
D)$21.
A)$3.
B)$12.
C)$15.
D)$21.
Unlock Deck
Unlock for access to all 324 flashcards in this deck.
Unlock Deck
k this deck
48
Suppose the members of population A, consisting of Al, Bob, Curt, Doris, and Ellie, receive annual incomes of $4,000, $3,200, $2,400, $1,800, and $1,200, respectively. The members of population B, consisting of Fred, George, Holly, Irma, and Joan, receive incomes of $4,000, $3,000, $1,250, $950, and $800, respectively. We
A)87.5
B)60
C)25
D)76.5
A)87.5
B)60
C)25
D)76.5
Unlock Deck
Unlock for access to all 324 flashcards in this deck.
Unlock Deck
k this deck
49
In 2017, a household with an annual income of $50,000 would find itself in the
A)second quintile of the household income distribution.
B)third quintile of the household income distribution.
C)fourth quintile of the household income distribution.
D)fifth (highest)quintile of the household income distribution.
A)second quintile of the household income distribution.
B)third quintile of the household income distribution.
C)fourth quintile of the household income distribution.
D)fifth (highest)quintile of the household income distribution.
Unlock Deck
Unlock for access to all 324 flashcards in this deck.
Unlock Deck
k this deck
50
In the taste-for-discrimination model, an increase in the prejudice of employers will decrease the demand for African-American workers, lower the African-American wage rate, and lower the ratio of African-American to white wages.
Unlock Deck
Unlock for access to all 324 flashcards in this deck.
Unlock Deck
k this deck
51
Refer to the table. The decline in percentage of income received from before taxes and transfers to after taxes and transfers is greatest for theA)second 20 percent of households.
B)third 20 percent of households.
C)fourth 20 percent of households.
D)highest 20 percent of households.
Unlock Deck
Unlock for access to all 324 flashcards in this deck.
Unlock Deck
k this deck
52
An employer whose discrimination coefficient is $7 will
A)more than $2.
B)at most 0.2.
C)less than $2.
D)1 or less.
A)more than $2.
B)at most 0.2.
C)less than $2.
D)1 or less.
Unlock Deck
Unlock for access to all 324 flashcards in this deck.
Unlock Deck
k this deck
53
Refer to the table. The decline in percentage of income received from before taxes and transfers to after taxes and transfers is greatest for theA)randomly hire African-American and white workers if the actual African-American-white wage differential is more than $4.
B)randomly hire African-American and white workers if the actual African-American-white wage differential is less than $4.
C)hire only African Americans if the actual African-American-white wage differential is less than $4.
D)hire only African Americans if the actual African-American-white wage differential is more than $4.
Unlock Deck
Unlock for access to all 324 flashcards in this deck.
Unlock Deck
k this deck
54
Suppose the members of population A, consisting of Al, Bob, Curt, Doris, and Ellie, receive annual incomes of $5,000, $4,000, $3,000, $2,000, and $1,000, respectively. What percentage of total income is received by the fourth quintile?
A)27 percent of total income.
B)35 percent of total income.
C)43 percent of total income.
D)23 percent of total income.
A)27 percent of total income.
B)35 percent of total income.
C)43 percent of total income.
D)23 percent of total income.
Unlock Deck
Unlock for access to all 324 flashcards in this deck.
Unlock Deck
k this deck
55
Suppose the members of population A, consisting of Al, Bob, Curt, Doris, and Ellie, receive annual incomes of $5,000, $2,500, $1,250, $750, and $500, respectively. What percentage of total income is received by the highest 60 percent of the income receivers in population A?
A)26.7
B)20
C)33.3
D)16.7
A)26.7
B)20
C)33.3
D)16.7
Unlock Deck
Unlock for access to all 324 flashcards in this deck.
Unlock Deck
k this deck
56
Assume that all workers are equally productive, but the wage rate for men is $25, compared to $23 for women. An employer who employs only male workers must have a discrimination coefficient of
A)0.71
B)0.55
C)0.45
D)0.31
A)0.71
B)0.55
C)0.45
D)0.31
Unlock Deck
Unlock for access to all 324 flashcards in this deck.
Unlock Deck
k this deck
57
Suppose an employer is biased against African Americans. If his discrimination coefficient is $4, the employer will
A)refuse to hire nonpreferred-race workers at any wage rate.
B)hire only preferred-race workers if the actual nonpreferred-preferred wage differential is $8 an hour.
C)hire only nonpreferred-race workers if the actual nonpreferred-preferred wage differential is $8 an hour.
D)hire only preferred-race workers if the nonpreferred-preferred wage differential is $7.
Unlock Deck
Unlock for access to all 324 flashcards in this deck.
Unlock Deck
k this deck
58
Statistical discrimination occurs when employers base hiring decisions on individual workers' previous employment records and statistics.
Unlock Deck
Unlock for access to all 324 flashcards in this deck.
Unlock Deck
k this deck
59
In 2017, the fourth quintile of households in the U.S. income distribution received about
A)highest quintile of the household income distribution.
B)second quintile of the household income distribution.
C)third quintile of the household income distribution.
D)fourth quintile of the household income distribution.
A)highest quintile of the household income distribution.
B)second quintile of the household income distribution.
C)third quintile of the household income distribution.
D)fourth quintile of the household income distribution.
Unlock Deck
Unlock for access to all 324 flashcards in this deck.
Unlock Deck
k this deck
60
The crowding model of occupational segregation shows how white males earn higher incomes at the expense of women and minorities who are restricted to a limited number of occupations.
Unlock Deck
Unlock for access to all 324 flashcards in this deck.
Unlock Deck
k this deck
61
The greater the area between the Lorenz curve and the diagonal in the Lorenz curve diagram, the
A)can say that the income of population B is less equally distributed than that of population A.
B)can say that the income of population B is more equally distributed than that of population A.
C)cannot make a meaningful comparison of the income distributions of populations A and B.
D)can say that the poorest quintile of population B receives 12 percent of total income.
Unlock Deck
Unlock for access to all 324 flashcards in this deck.
Unlock Deck
k this deck
62
The Lorenz curve
A)seventeen
B)ten
C)eight
D)twenty
A)seventeen
B)ten
C)eight
D)twenty
Unlock Deck
Unlock for access to all 324 flashcards in this deck.
Unlock Deck
k this deck
63
Refer to the diagram, where curves (a)through (e)are Lorenz curves for five different countries. Income is equally distributed inA)0 and 10,000.
B)1 and 10.
C)−1 and +1.
D)0 and 1.
Unlock Deck
Unlock for access to all 324 flashcards in this deck.
Unlock Deck
k this deck
64
The Gini ratio of income inequality ranges between
A)measures the relative extent of poverty in a nation.
B)compares the income of persons, households, or households at the 90th percentile of the income distribution to the income at the 10th percentile.
C)is a numerical measure of the overall dispersion of income in a nation.
D)is found by dividing the entire area below and to the right of the diagonal in the Lorenz diagram by the area between the diagonal and Lorenz curve.
Unlock Deck
Unlock for access to all 324 flashcards in this deck.
Unlock Deck
k this deck
65
Refer to the diagram, where curves (a)through (e)are for five different countries. The Gini ratio is lowest in countryA)none of the countries shown.
B)country b.
C)countries a and e.
D)country a.
Unlock Deck
Unlock for access to all 324 flashcards in this deck.
Unlock Deck
k this deck
66
Suppose the members of population A, consisting of Al, Bob, Curt, Doris, and Ellie, receive annual incomes of $5,000, $2,500, $1,250, $750, and $500, respectively. The members of population B, consisting of Fred, George, Holly, Irma, and Joan, receive incomes of $4,000, $3,000, $1,250, $950, and $800, respectively. We
A)25
B)60
C)50
D)20
A)25
B)60
C)50
D)20
Unlock Deck
Unlock for access to all 324 flashcards in this deck.
Unlock Deck
k this deck
67
Suppose the members of population A, consisting of Al, Bob, Curt, Doris, and Ellie, receive annual incomes of $5,000, $2,500, $1,250, $750, and $500, respectively. What percentage of total income is received by the lowest 60 percent of the income receivers in population A?
A)50
B)5
C)25
D)20
A)50
B)5
C)25
D)20
Unlock Deck
Unlock for access to all 324 flashcards in this deck.
Unlock Deck
k this deck
68
Which of the following Gini ratios indicates the highest degree of income inequality?
A)smaller is the Gini ratio and the greater is the degree of income inequality.
B)larger is the Gini ratio and the greater is the degree of income inequality.
C)smaller is the Gini ratio and the lesser is the degree of income inequality.
D)larger is the Gini ratio and the lesser is the degree of income inequality.
Unlock Deck
Unlock for access to all 324 flashcards in this deck.
Unlock Deck
k this deck
69
Refer to the diagram, where curves (a)through (e)are for five different countries. Of the countries listed below, income is most unequally distributed in countryA)a.
B)b.
C)c.
D)e.
Unlock Deck
Unlock for access to all 324 flashcards in this deck.
Unlock Deck
k this deck
70
The lowest quintile of households in the income distribution (as of 2017)receives about
A)highest quintile of the household income distribution.
B)second quintile of the household income distribution.
C)lowest quintile of the household income distribution.
D)fourth quintile of the household income distribution.
A)highest quintile of the household income distribution.
B)second quintile of the household income distribution.
C)lowest quintile of the household income distribution.
D)fourth quintile of the household income distribution.
Unlock Deck
Unlock for access to all 324 flashcards in this deck.
Unlock Deck
k this deck
71
The Lorenz curve portrays
A)plots graphically the poverty rate over time.
B)is located closer to the diagonal today than it was in 1980.
C)plots graphically the distribution of income.
D)is located farther from the diagonal when income is defined to include the value of noncash transfers.
A)plots graphically the poverty rate over time.
B)is located closer to the diagonal today than it was in 1980.
C)plots graphically the distribution of income.
D)is located farther from the diagonal when income is defined to include the value of noncash transfers.
Unlock Deck
Unlock for access to all 324 flashcards in this deck.
Unlock Deck
k this deck
72
The Gini ratio
A)the functional distribution of income.
B)the ratio of labor to capitalist income.
C)the personal distribution of income.
D)income equality.
A)the functional distribution of income.
B)the ratio of labor to capitalist income.
C)the personal distribution of income.
D)income equality.
Unlock Deck
Unlock for access to all 324 flashcards in this deck.
Unlock Deck
k this deck
73
Census data indicate that, as of 2017, the top fifth of all households receive about ________ times as much income as the bottom fifth.
A)43 percent of total income.
B)30 percent of total income.
C)62 percent of total income.
D)52 percent of total income.
A)43 percent of total income.
B)30 percent of total income.
C)62 percent of total income.
D)52 percent of total income.
Unlock Deck
Unlock for access to all 324 flashcards in this deck.
Unlock Deck
k this deck
74
The highest quintile of households in the income distribution (as of 2017)
A)2.4 percent of the total income.
B)3.1 percent of the total income.
C)8.2 percent of the total income.
D)10 percent of the total income.
A)2.4 percent of the total income.
B)3.1 percent of the total income.
C)8.2 percent of the total income.
D)10 percent of the total income.
Unlock Deck
Unlock for access to all 324 flashcards in this deck.
Unlock Deck
k this deck
75
In 2017, the highest quintile of households in the U.S. income distribution received about
A)A
B)B
C)C
D)D
A)A
B)B
C)C
D)D
Unlock Deck
Unlock for access to all 324 flashcards in this deck.
Unlock Deck
k this deck
76
In 2017, a household with an annual income of $80,000 would find itself in the
A)5 percent of the income receivers.
B)10 percent of the income receivers.
C)20 percent of the income receivers.
D)25 percent of the income receivers.
A)5 percent of the income receivers.
B)10 percent of the income receivers.
C)20 percent of the income receivers.
D)25 percent of the income receivers.
Unlock Deck
Unlock for access to all 324 flashcards in this deck.
Unlock Deck
k this deck
77
Refer to the diagram, where curves (a)through (e)are for five different countries. The Gini ratio isA)a.
B)b.
C)c.
D)d.
Unlock Deck
Unlock for access to all 324 flashcards in this deck.
Unlock Deck
k this deck
78
Suppose the members of population A, consisting of Al, Bob, Curt, Doris, and Ellie, receive annual incomes of $5,000, $2,500, $1,250, $750, and $500, respectively. What percentage of total income is received by the highest quintile?
A)zero in country (e)and 1 in country (a).
B)greater in country (b)than in country (c).
C)zero in country (a)and 1 in country (e).
D)less than 0.5 in country (d).
A)zero in country (e)and 1 in country (a).
B)greater in country (b)than in country (c).
C)zero in country (a)and 1 in country (e).
D)less than 0.5 in country (d).
Unlock Deck
Unlock for access to all 324 flashcards in this deck.
Unlock Deck
k this deck
79
Which of the income distributions in the accompanying table is closest to describing the United States (as of 2017)?A)receives about 3 percent of the total income.
B)comprises 10 percent of all households.
C)receives about 52 percent of the total income.
D)receives about 43 percent of the total income.
Unlock Deck
Unlock for access to all 324 flashcards in this deck.
Unlock Deck
k this deck
80
In 2017, a household with an annual income of $23,000 would find itself in the
A)second quintile of the household income distribution.
B)third quintile of the household income distribution.
C)fourth quintile of the household income distribution.
D)fifth (highest)quintile of the household income distribution.
A)second quintile of the household income distribution.
B)third quintile of the household income distribution.
C)fourth quintile of the household income distribution.
D)fifth (highest)quintile of the household income distribution.
Unlock Deck
Unlock for access to all 324 flashcards in this deck.
Unlock Deck
k this deck
Unlock Deck
Unlock for access to all 324 flashcards in this deck.


