Deck 4: Markets in Action
Full screen (f)
Question
Question
Exhibit 4-1 Supply and demand data
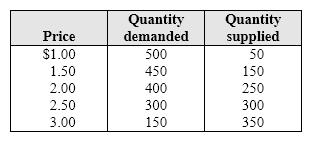
In Exhibit 4-1, suppose that a reduction in the price of an important input used to produce the good causes an increase in quantity supplied of 150 units at every price level. Assuming that demand does not change, the new equilibrium price will be:
A) $1.00.
B) $1.50.
C) $2.00.
D) $2.50.
In Exhibit 4-1, suppose that a reduction in the price of an important input used to produce the good causes an increase in quantity supplied of 150 units at every price level. Assuming that demand does not change, the new equilibrium price will be:
A) $1.00.
B) $1.50.
C) $2.00.
D) $2.50.
Question
Question
Question
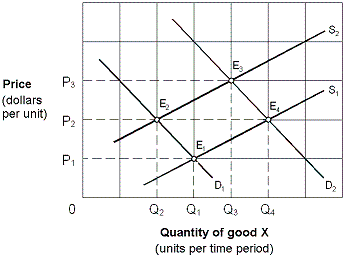
Exhibit 4-2 Supply and demand curves

In Exhibit 4-2, which of the following might cause a shift from S1 to S2?
A) A decrease in input prices.
B) A decrease in consumer prices.
C) An increase in input prices.
D) An increase in consumer income.
In Exhibit 4-2, which of the following might cause a shift from S1 to S2?
A) A decrease in input prices.
B) A decrease in consumer prices.
C) An increase in input prices.
D) An increase in consumer income.
Question
Exhibit 4-2 Supply and demand curves

The market shown in Exhibit 4-2 is initially in equilibrium at E1. Changes in market conditions result in a new equilibrium at E2. This change is stated as a(n):
A) increase in supply and an increase in quantity demanded.
B) increase in supply and a decrease in demand.
C) decrease in supply and a decrease in quantity demanded.
D) increase in demand and an increase in supply.
Question
Question
Question
Question
Question
Question
Question
Question
Exhibit 4-2 Supply and demand curves

In Exhibit 4-2, a decrease in quantity demanded would cause a movement from which equilibrium point to another, other things being equal?
A) E1 to E2.
B) E1 to E3.
C) E4 to E1.
D) E3 to E4.
In Exhibit 4-2, a decrease in quantity demanded would cause a movement from which equilibrium point to another, other things being equal?
A) E1 to E2.
B) E1 to E3.
C) E4 to E1.
D) E3 to E4.
Question
Question
Exhibit 4-2 Supply and demand curves

The market shown in Exhibit 4-2 is initially in equilibrium at point E3. Union negotiations for workers producing good X result in a wage increase. Other things being equal, which of the following is the new equilibrium after this wage increase is in effect?
A) E1.
B) E2.
C) E3.
D) E4.
The market shown in Exhibit 4-2 is initially in equilibrium at point E3. Union negotiations for workers producing good X result in a wage increase. Other things being equal, which of the following is the new equilibrium after this wage increase is in effect?
A) E1.
B) E2.
C) E3.
D) E4.
Question
Question
Question
Exhibit 4-2 Supply and demand curves

In Exhibit 4-2 an increase in supply would cause a movement from which equilibrium point to another, other things being equal?
A) E1 to E2.
B) E1 to E3.
C) E4 to E1.
D) E3 to E4.
In Exhibit 4-2 an increase in supply would cause a movement from which equilibrium point to another, other things being equal?
A) E1 to E2.
B) E1 to E3.
C) E4 to E1.
D) E3 to E4.
Question
Exhibit 4-2 Supply and demand curves

The market shown in Exhibit 4-2 is initially in equilibrium at E3. Changes in market conditions result in a new equilibrium at E4. This change is stated as a(n):
A) increase in demand and an increase in supply.
B) decrease in demand and a decrease in quantity supplied.
C) increase in supply and an increase in quantity demanded.
D) decrease in supply and a decrease in quantity demanded.
Question
Question
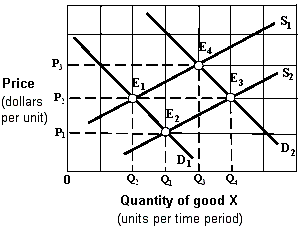
Exhibit 4-3 Supply and demand curves
The market shown in Exhibit 4-3 is initially in equilibrium at E4. Changes in market conditions result in a new equilibrium at E3. This change is stated as a(n):
A) increase in supply and an increase in quantity demanded.
B) increase in supply and a decrease in demand.
C) decrease in supply and a decrease in quantity demanded.
D) increase in demand an increase in supply.
Question
Exhibit 4-3 Supply and demand curves

Beginning from an equilibrium at point E2 in Exhibit 4-3, an increase in demand for good X, other things being equal, would move the equilibrium point to:
A) E1.
B) E2.
C) E3.
D) E4.
Beginning from an equilibrium at point E2 in Exhibit 4-3, an increase in demand for good X, other things being equal, would move the equilibrium point to:
A) E1.
B) E2.
C) E3.
D) E4.
Question
Exhibit 4-6 Demand and supply curves
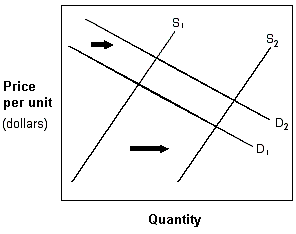
In Exhibit 4-6, the demand curve has shifted from D1 to D2 and, simultaneously, the supply curve has shifted from S1 to S2. Describe these actions in this market.
A) Market supply has decreased, and market demand has increased.
B) Market supply has increased, and market demand has decreased.
C) Market supply has decreased, and market demand has decreased.
D) Market supply has increased, and market demand has increased.
Question
Exhibit 4-3 Supply and demand curves

In Exhibit 4-3, which of the following might cause a shift from S2 to S1?
A) A decrease in input prices.
B) An improvement in technology.
C) An increase in input prices.
D) An increase in consumer income.
In Exhibit 4-3, which of the following might cause a shift from S2 to S1?
A) A decrease in input prices.
B) An improvement in technology.
C) An increase in input prices.
D) An increase in consumer income.
Question
Question
Exhibit 4-3 Supply and demand curves

In Exhibit 4-3, an increase in demand would cause a movement from which equilibrium point to another, other things being equal?
A) E1 to E2.
B) E1 to E3.
C) E4 to E1.
D) E1 to E4.
In Exhibit 4-3, an increase in demand would cause a movement from which equilibrium point to another, other things being equal?
A) E1 to E2.
B) E1 to E3.
C) E4 to E1.
D) E1 to E4.
Question
Exhibit 4-6 Demand and supply curves

If market supply decreases and, simultaneously, market demand increases, the new equilibrium will show:
A) market price will decrease, and market quantity exchanged will increase.
B) market price will increase, and market quantity exchanged will decrease.
C) market price will increase, and the quantity exchanged could increase, decrease, or remain the same.
D) market price could increase, decrease, or remain the same, and quantity exchanged will increase.
Question
Question
Exhibit 4-3 Supply and demand curves

Initially the market shown in Exhibit 4-3 is in equilibrium at P3, Q3 (E3). Changes in market conditions result in a new equilibrium at P2, Q2 (E2). This change is stated as a:
A) decrease in demand and an increase in supply.
B) decrease in demand and a decrease in quantity supplied.
C) decrease in quantity demanded and an increase in quantity supplied.
D) decrease in quantity demanded and an increase in supply.
Question
Exhibit 4-6 Demand and supply curves

If the market demand and supply curves shift as given in Exhibit 4-6, the resulting new equilibrium will show a(n):
A) increase in market price and a decrease in the quantity exchanged.
B) decrease in market price and a decrease in the quantity exchanged.
C) increase in market price and an increase in the quantity exchanged.
D) decrease in market price and an increase in the quantity exchanged.
Question
Question
Question
Exhibit 4-7 Demand and supply schedules for movie tickets
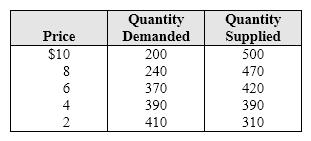
In Exhibit 4-7, a 100 unit decrease in quantity demanded at every price level would cause the new equilibrium price to become:
A) $8.
B) $6.
C) $4.
D) $2.
In Exhibit 4-7, a 100 unit decrease in quantity demanded at every price level would cause the new equilibrium price to become:
A) $8.
B) $6.
C) $4.
D) $2.
Question
Exhibit 4-3 Supply and demand curves

In Exhibit 4-3, an increase in quantity supplied would cause a movement from which equilibrium point to another, other things being equal?
A) E1 to E2.
B) E1 to E4.
C) E4 to E1.
D) E3 to E4.
In Exhibit 4-3, an increase in quantity supplied would cause a movement from which equilibrium point to another, other things being equal?
A) E1 to E2.
B) E1 to E4.
C) E4 to E1.
D) E3 to E4.
Question
Exhibit 4-2 Supply and demand curves
Beginning from an equilibrium at point E1 in Exhibit 4-2, an increase in demand for good X, other things being equal, would move the equilibrium point to:
A) E1, no change.
B) E2.
C) E3.
D) E4.
Beginning from an equilibrium at point E1 in Exhibit 4-2, an increase in demand for good X, other things being equal, would move the equilibrium point to:
A) E1, no change.
B) E2.
C) E3.
D) E4.
Question
Exhibit 4-6 Demand and supply curves

If the market supply increases and, simultaneously, market demand decreases, the new equilibrium will show:
A) market price will decrease, and market quantity exchanged could increase, decrease, or remain unchanged.
B) market price will increase, and market quantity exchanged will decrease.
C) market price will increase, and the quantity exchanged could increase, decrease, or remain the same.
D) market price could increase, decrease, or remain the same, and quantity exchanged will increase.
Question
Question
Exhibit 4-5 Supply and demand curves for computers
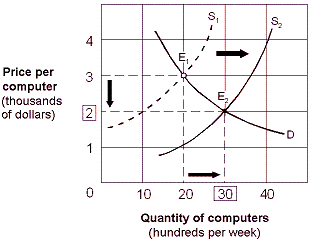
Which of the following changes could cause the computer market to change as shown in Exhibit 4-5?
A) Lower costs for computer chips and motherboards.
B) The failure of several computer manufacturers.
C) Higher prices for computer software.
D) More features and greater ease of use.
Which of the following changes could cause the computer market to change as shown in Exhibit 4-5?
A) Lower costs for computer chips and motherboards.
B) The failure of several computer manufacturers.
C) Higher prices for computer software.
D) More features and greater ease of use.
Question
Exhibit 4-3 Supply and demand curves

Initially the market shown in Exhibit 4-3 is in equilibrium at P2, Q2 (E2). Changes in market conditions result in a new equilibrium at P2, Q4 (E4). This change is stated as a(n):
A) increase in supply and an increase in demand.
B) increase in supply and a decrease in demand.
C) decrease in demand and a decrease in supply.
D) increase in demand with supply held constant at S2.
Question
Exhibit 4-8 Demand and supply curves

In Exhibit 4-8, a movement from A to B is best explained by:
A) an increase in income and in the number of suppliers.
B) an increase in the price of other goods.
C) an increase in the population.
D) a decrease in income if X is a normal good and an improvement in the technology used to produce the good.
Question
Question
Question
Question
Question
Question
Question
Exhibit 4-8 Demand and supply curves

In Exhibit 4-8, a movement from A to C is best described as a(n):
A) increase in the quantity supplied and a decrease in the demand.
B) decrease in the quantity supplied and a decrease in demand.
C) decrease in the quantity supplied and an increase in demand.
D) decrease in the quantity demanded and a decrease in supply.
Question
Question
Question
Question
Question
Question
Exhibit 4-8 Demand and supply curves

In Exhibit 4-8, a movement from A to D is best described as a(n):
A) increase in the quantity demanded and an increase in supply.
B) increase in supply and demand.
C) increase in both the quantity demanded and supplied.
D) increase in the quantity supplied and in the demand.
In Exhibit 4-8, a movement from A to D is best described as a(n):
A) increase in the quantity demanded and an increase in supply.
B) increase in supply and demand.
C) increase in both the quantity demanded and supplied.
D) increase in the quantity supplied and in the demand.
Question
Question
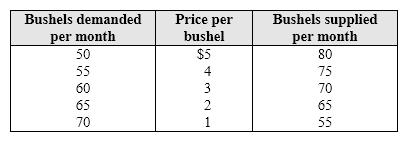
Exhibit 4-11 Data on supply and demand
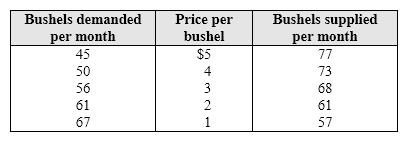
In Exhibit 4-11, the equilibrium price per bushel of wheat is:
A) $1.
B) $2.
C) $3.
D) $4.
In Exhibit 4-11, the equilibrium price per bushel of wheat is:
A) $1.
B) $2.
C) $3.
D) $4.
Question
Question
Question
Exhibit 4-8 Demand and supply curves
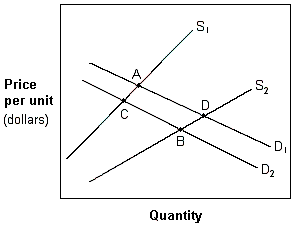
In Exhibit 4-8, a movement from A to B in which price has decreased and quantity has increased is best explained by a(n):
A) increase in supply and demand.
B) decrease in supply and demand.
C) increase in supply that dominates a decrease in demand.
D) increase in demand that dominates a decrease supply.
Question
Question
Question
Exhibit 4-10 Supply and demand data for apricots

Which of the following would occur if the government sets a price floor of $4 in the market shown in Exhibit 4-10?
A) There would be a shortage of apricots.
B) Buyers would not purchase all of the apricots that are grown.
C) Buyers would purchase more apricots than are currently being supplied.
D) Farmers would reduce the number of acres allocated to the growing of apricots.
Question
Question
Question
Question
Question
Question
Question
Question
Question
Exhibit 4-10 Supply and demand data for apricots
Which of the following would occur if the government set a price ceiling of $1 in the market shown in Exhibit 4-10?
A) There would be a shortage of apricots.
B) Buyers would not want to purchase all of the apricots that are supplied.
C) There would be a surplus of apricots.
D) Farmers would reduce the number of acres allocated to the growing of apricots.
Question
Question
Question
Question
Exhibit 4-9 Data on supply and demand
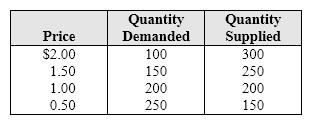
In Exhibit 4-9, if a price ceiling is set at $1.50 the market result after adjustment is:
A) a shortage of 150 units.
B) a surplus of 100 units.
C) shortage of 100 units.
D) equilibrium at 200 units.
In Exhibit 4-9, if a price ceiling is set at $1.50 the market result after adjustment is:
A) a shortage of 150 units.
B) a surplus of 100 units.
C) shortage of 100 units.
D) equilibrium at 200 units.
Question
Question
Question
Question
Question

Unlock Deck
Sign up to unlock the cards in this deck!
Unlock Deck
Unlock Deck
1/137
Play
Full screen (f)
Deck 4: Markets in Action
1
Suppose a new law requires all piercing studios to pass tougher licensing tests and to begin using more costly sterilization methods. Other things constant, this law would cause:
A) an increase in the supply of piercings and a lower price for piercings.
B) an increase in the supply of piercings and a higher price for piercings.
C) a decrease in the supply of piercings and a higher price for piercings.
D) a decrease in the supply of piercings and a lower price for piercings.
A) an increase in the supply of piercings and a lower price for piercings.
B) an increase in the supply of piercings and a higher price for piercings.
C) a decrease in the supply of piercings and a higher price for piercings.
D) a decrease in the supply of piercings and a lower price for piercings.
C
2
Exhibit 4-1 Supply and demand data
In Exhibit 4-1, suppose that a reduction in the price of an important input used to produce the good causes an increase in quantity supplied of 150 units at every price level. Assuming that demand does not change, the new equilibrium price will be:
A) $1.00.
B) $1.50.
C) $2.00.
D) $2.50.
In Exhibit 4-1, suppose that a reduction in the price of an important input used to produce the good causes an increase in quantity supplied of 150 units at every price level. Assuming that demand does not change, the new equilibrium price will be:
A) $1.00.
B) $1.50.
C) $2.00.
D) $2.50.
C
3
If there is a decrease in demand for lettuce, we would expect:
A) both the price and quantity sold to increase.
B) both the price and quantity sold to decrease.
C) the price to decrease and the quantity sold to increase.
D) the price to increase and the quantity sold to decrease.
A) both the price and quantity sold to increase.
B) both the price and quantity sold to decrease.
C) the price to decrease and the quantity sold to increase.
D) the price to increase and the quantity sold to decrease.
B
4
Which of the following would decrease the price of packaged hot dogs?
A) A decrease in the price of hot dog buns, a complement to packaged hot dogs.
B) An increase in the price of hamburger meat, a substitute for packaged hot dogs.
C) A technological advance that lowers the cost of producing packaged hot dogs.
D) An increase in the price of beef used to produce packaged hot dogs.
Unlock Deck
Unlock for access to all 137 flashcards in this deck.
Unlock Deck
k this deck
5
Exhibit 4-2 Supply and demand curves
In Exhibit 4-2, which of the following might cause a shift from S1 to S2?
A) A decrease in input prices.
B) A decrease in consumer prices.
C) An increase in input prices.
D) An increase in consumer income.
In Exhibit 4-2, which of the following might cause a shift from S1 to S2?
A) A decrease in input prices.
B) A decrease in consumer prices.
C) An increase in input prices.
D) An increase in consumer income.
Unlock Deck
Unlock for access to all 137 flashcards in this deck.
Unlock Deck
k this deck
6
Exhibit 4-2 Supply and demand curves
The market shown in Exhibit 4-2 is initially in equilibrium at E1. Changes in market conditions result in a new equilibrium at E2. This change is stated as a(n):
A) increase in supply and an increase in quantity demanded.
B) increase in supply and a decrease in demand.
C) decrease in supply and a decrease in quantity demanded.
D) increase in demand and an increase in supply.
Unlock Deck
Unlock for access to all 137 flashcards in this deck.
Unlock Deck
k this deck
7
If the demand for a good decreased, what would be the effect on the equilibrium price and quantity?
A) Price would increase, and quantity would decrease.
B) Price would decrease, and quantity would decrease.
C) Price would increase, and quantity would increase.
D) Price would decrease, and quantity would increase.
A) Price would increase, and quantity would decrease.
B) Price would decrease, and quantity would decrease.
C) Price would increase, and quantity would increase.
D) Price would decrease, and quantity would increase.
Unlock Deck
Unlock for access to all 137 flashcards in this deck.
Unlock Deck
k this deck
8
How would a decrease in consumer income affect the market for new automobiles, a normal good?
A) Demand would decrease, leading to an increase in price and a reduction in quantity sold.
B) Demand would decrease, leading to a reduction in price and a reduction in quantity sold.
C) Demand would increase, leading to an increase in price and an increase in quantity sold.
D) Demand would increase, leading to a reduction in price and an increase in quantity sold.
Unlock Deck
Unlock for access to all 137 flashcards in this deck.
Unlock Deck
k this deck
9
If we observe a decrease in the price of a good and an increase in the amount of the good bought and sold, this could be explained by a(n):
A) increase in the supply of the good.
B) increase in the demand for the good.
C) decrease in the demand for the good.
D) decrease in the supply of the good.
A) increase in the supply of the good.
B) increase in the demand for the good.
C) decrease in the demand for the good.
D) decrease in the supply of the good.
Unlock Deck
Unlock for access to all 137 flashcards in this deck.
Unlock Deck
k this deck
10
After a hurricane in Florida knocked out the regional water supply for several days, the demand for bottled water increased sharply. In a market economy, how will this increase in demand affect the equilibrium price and quantity of bottled water?
A) Price will increase, and quantity will decrease.
B) Price will decrease, and quantity will decrease.
C) Price will decrease, and quantity will increase.
D) Price will increase, and quantity will increase.
A) Price will increase, and quantity will decrease.
B) Price will decrease, and quantity will decrease.
C) Price will decrease, and quantity will increase.
D) Price will increase, and quantity will increase.
Unlock Deck
Unlock for access to all 137 flashcards in this deck.
Unlock Deck
k this deck
11
Which of the following is the most likely effect of lower apple juice prices on the price and quantity purchased of orange juice, a substitute product?
A) The price of orange juice will increase, and the quantity purchased will fall.
B) The price of orange juice will fall, and the quantity purchased will increase.
C) The price of orange juice will increase, and the quantity purchased will increase.
D) The price of orange juice will fall, and the quantity purchased will fall.
Unlock Deck
Unlock for access to all 137 flashcards in this deck.
Unlock Deck
k this deck
12
If we observe a decrease in the price of a good and a decrease in the amount of the good bought and sold, this could be explained by a(an):
A) increase in the supply of the good.
B) increase in the demand for the good.
C) decrease in the demand for the good.
D) decrease in the supply of the good.
A) increase in the supply of the good.
B) increase in the demand for the good.
C) decrease in the demand for the good.
D) decrease in the supply of the good.
Unlock Deck
Unlock for access to all 137 flashcards in this deck.
Unlock Deck
k this deck
13
If the supply of a good decreased, what would be the effect on the equilibrium price and quantity?
A) Price would increase, and quantity would decrease.
B) Price would decrease, and quantity would decrease.
C) Price would increase, and quantity would increase.
D) Price would decrease, and quantity would increase.
A) Price would increase, and quantity would decrease.
B) Price would decrease, and quantity would decrease.
C) Price would increase, and quantity would increase.
D) Price would decrease, and quantity would increase.
Unlock Deck
Unlock for access to all 137 flashcards in this deck.
Unlock Deck
k this deck
14
Exhibit 4-2 Supply and demand curves
In Exhibit 4-2, a decrease in quantity demanded would cause a movement from which equilibrium point to another, other things being equal?
A) E1 to E2.
B) E1 to E3.
C) E4 to E1.
D) E3 to E4.
In Exhibit 4-2, a decrease in quantity demanded would cause a movement from which equilibrium point to another, other things being equal?
A) E1 to E2.
B) E1 to E3.
C) E4 to E1.
D) E3 to E4.
Unlock Deck
Unlock for access to all 137 flashcards in this deck.
Unlock Deck
k this deck
15
Consider the market for grapes. An increase in the wage paid to grape pickers will cause the:
A) demand curve for grapes to shift to the right, resulting in a higher equilibrium price for grapes and a reduction in the quantity consumed.
B) demand curve for grapes to shift to the left, resulting in a lower equilibrium price for grapes and an increase in the quantity consumed.
C) supply curve for grapes to shift to the right, resulting in a lower equilibrium price for grapes and an increase in the quantity consumed.
D) supply curve for grapes to shift to the left, resulting in a higher equilibrium price for grapes and a decrease in the quantity consumed.
Unlock Deck
Unlock for access to all 137 flashcards in this deck.
Unlock Deck
k this deck
16
Exhibit 4-2 Supply and demand curves
The market shown in Exhibit 4-2 is initially in equilibrium at point E3. Union negotiations for workers producing good X result in a wage increase. Other things being equal, which of the following is the new equilibrium after this wage increase is in effect?
A) E1.
B) E2.
C) E3.
D) E4.
The market shown in Exhibit 4-2 is initially in equilibrium at point E3. Union negotiations for workers producing good X result in a wage increase. Other things being equal, which of the following is the new equilibrium after this wage increase is in effect?
A) E1.
B) E2.
C) E3.
D) E4.
Unlock Deck
Unlock for access to all 137 flashcards in this deck.
Unlock Deck
k this deck
17
Over a ten year period, the monthly charge for cellular phone service decreased from $120 per month to $30 per month. At the same time, the number of subscribers increased from less than 10 million to more than 75 million. Which of the following provides the best explanation for these changes?
A) An increase in consumer income over this ten year period
B) A reduction in the price of residential phone service, a substitute for cellular phone service
C) An increase in the wages of workers in the cellular phone industry
D) Technological improvements that reduced the cost of supplying cellular phone service
Unlock Deck
Unlock for access to all 137 flashcards in this deck.
Unlock Deck
k this deck
18
How would a decrease in the price of the feed grains used to feed cattle affect the market for beef?
A) The demand for beef would increase, increasing beef prices.
B) The demand for beef would decrease, decreasing beef prices.
C) The supply of beef would increase, decreasing beef prices.
D) The supply of beef would decrease, increasing beef prices.
A) The demand for beef would increase, increasing beef prices.
B) The demand for beef would decrease, decreasing beef prices.
C) The supply of beef would increase, decreasing beef prices.
D) The supply of beef would decrease, increasing beef prices.
Unlock Deck
Unlock for access to all 137 flashcards in this deck.
Unlock Deck
k this deck
19
Exhibit 4-2 Supply and demand curves
In Exhibit 4-2 an increase in supply would cause a movement from which equilibrium point to another, other things being equal?
A) E1 to E2.
B) E1 to E3.
C) E4 to E1.
D) E3 to E4.
In Exhibit 4-2 an increase in supply would cause a movement from which equilibrium point to another, other things being equal?
A) E1 to E2.
B) E1 to E3.
C) E4 to E1.
D) E3 to E4.
Unlock Deck
Unlock for access to all 137 flashcards in this deck.
Unlock Deck
k this deck
20
Exhibit 4-2 Supply and demand curves
The market shown in Exhibit 4-2 is initially in equilibrium at E3. Changes in market conditions result in a new equilibrium at E4. This change is stated as a(n):
A) increase in demand and an increase in supply.
B) decrease in demand and a decrease in quantity supplied.
C) increase in supply and an increase in quantity demanded.
D) decrease in supply and a decrease in quantity demanded.
Unlock Deck
Unlock for access to all 137 flashcards in this deck.
Unlock Deck
k this deck
21
Suppose prices for new homes have risen, yet sales of new homes have also risen. We can conclude that:
A) the demand for new homes has risen.
B) the law of demand has been violated.
C) new firms have entered the construction industry.
D) construction firms must be facing higher costs.
A) the demand for new homes has risen.
B) the law of demand has been violated.
C) new firms have entered the construction industry.
D) construction firms must be facing higher costs.
Unlock Deck
Unlock for access to all 137 flashcards in this deck.
Unlock Deck
k this deck
22
Exhibit 4-3 Supply and demand curves
The market shown in Exhibit 4-3 is initially in equilibrium at E4. Changes in market conditions result in a new equilibrium at E3. This change is stated as a(n):
A) increase in supply and an increase in quantity demanded.
B) increase in supply and a decrease in demand.
C) decrease in supply and a decrease in quantity demanded.
D) increase in demand an increase in supply.
Unlock Deck
Unlock for access to all 137 flashcards in this deck.
Unlock Deck
k this deck
23
Exhibit 4-3 Supply and demand curves
Beginning from an equilibrium at point E2 in Exhibit 4-3, an increase in demand for good X, other things being equal, would move the equilibrium point to:
A) E1.
B) E2.
C) E3.
D) E4.
Beginning from an equilibrium at point E2 in Exhibit 4-3, an increase in demand for good X, other things being equal, would move the equilibrium point to:
A) E1.
B) E2.
C) E3.
D) E4.
Unlock Deck
Unlock for access to all 137 flashcards in this deck.
Unlock Deck
k this deck
24
Exhibit 4-6 Demand and supply curves
In Exhibit 4-6, the demand curve has shifted from D1 to D2 and, simultaneously, the supply curve has shifted from S1 to S2. Describe these actions in this market.
A) Market supply has decreased, and market demand has increased.
B) Market supply has increased, and market demand has decreased.
C) Market supply has decreased, and market demand has decreased.
D) Market supply has increased, and market demand has increased.
Unlock Deck
Unlock for access to all 137 flashcards in this deck.
Unlock Deck
k this deck
25
Exhibit 4-3 Supply and demand curves
In Exhibit 4-3, which of the following might cause a shift from S2 to S1?
A) A decrease in input prices.
B) An improvement in technology.
C) An increase in input prices.
D) An increase in consumer income.
In Exhibit 4-3, which of the following might cause a shift from S2 to S1?
A) A decrease in input prices.
B) An improvement in technology.
C) An increase in input prices.
D) An increase in consumer income.
Unlock Deck
Unlock for access to all 137 flashcards in this deck.
Unlock Deck
k this deck
26
Suppose the market for "soda X" is in equilibrium. If the FDA announced today that this soda has been proven to cause a fatal disease, what would be most likely to happen to the equilibrium price and equilibrium quantity of soda X?
A) Price increases and quantity increases
B) Price decreases and quantity increases
C) Price increases and quantity increases
D) Price decreases and quantity decreases
A) Price increases and quantity increases
B) Price decreases and quantity increases
C) Price increases and quantity increases
D) Price decreases and quantity decreases
Unlock Deck
Unlock for access to all 137 flashcards in this deck.
Unlock Deck
k this deck
27
Exhibit 4-3 Supply and demand curves
In Exhibit 4-3, an increase in demand would cause a movement from which equilibrium point to another, other things being equal?
A) E1 to E2.
B) E1 to E3.
C) E4 to E1.
D) E1 to E4.
In Exhibit 4-3, an increase in demand would cause a movement from which equilibrium point to another, other things being equal?
A) E1 to E2.
B) E1 to E3.
C) E4 to E1.
D) E1 to E4.
Unlock Deck
Unlock for access to all 137 flashcards in this deck.
Unlock Deck
k this deck
28
Exhibit 4-6 Demand and supply curves
If market supply decreases and, simultaneously, market demand increases, the new equilibrium will show:
A) market price will decrease, and market quantity exchanged will increase.
B) market price will increase, and market quantity exchanged will decrease.
C) market price will increase, and the quantity exchanged could increase, decrease, or remain the same.
D) market price could increase, decrease, or remain the same, and quantity exchanged will increase.
Unlock Deck
Unlock for access to all 137 flashcards in this deck.
Unlock Deck
k this deck
29
Which of the following would raise both the equilibrium price and the equilibrium quantity of strawberries?
A) A decrease in the demand for strawberries.
B) An increase in the demand for strawberries.
C) A decrease in the supply of strawberries.
D) An increase in the supply of strawberries.
A) A decrease in the demand for strawberries.
B) An increase in the demand for strawberries.
C) A decrease in the supply of strawberries.
D) An increase in the supply of strawberries.
Unlock Deck
Unlock for access to all 137 flashcards in this deck.
Unlock Deck
k this deck
30
Exhibit 4-3 Supply and demand curves
Initially the market shown in Exhibit 4-3 is in equilibrium at P3, Q3 (E3). Changes in market conditions result in a new equilibrium at P2, Q2 (E2). This change is stated as a:
A) decrease in demand and an increase in supply.
B) decrease in demand and a decrease in quantity supplied.
C) decrease in quantity demanded and an increase in quantity supplied.
D) decrease in quantity demanded and an increase in supply.
Unlock Deck
Unlock for access to all 137 flashcards in this deck.
Unlock Deck
k this deck
31
Exhibit 4-6 Demand and supply curves
If the market demand and supply curves shift as given in Exhibit 4-6, the resulting new equilibrium will show a(n):
A) increase in market price and a decrease in the quantity exchanged.
B) decrease in market price and a decrease in the quantity exchanged.
C) increase in market price and an increase in the quantity exchanged.
D) decrease in market price and an increase in the quantity exchanged.
Unlock Deck
Unlock for access to all 137 flashcards in this deck.
Unlock Deck
k this deck
32
An increase in the wages paid to fishermen will have what effect on the fish market equilibrium?
A) Price will decrease, and quantity will decrease.
B) Price will increase, and quantity will increase.
C) Price will decrease, and quantity will increase.
D) Price will increase, and quantity will decrease.
A) Price will decrease, and quantity will decrease.
B) Price will increase, and quantity will increase.
C) Price will decrease, and quantity will increase.
D) Price will increase, and quantity will decrease.
Unlock Deck
Unlock for access to all 137 flashcards in this deck.
Unlock Deck
k this deck
33
Consider the market for chicken. Assuming that chicken and beef are substitutes, an increase in the price of beef will:
A) decrease the demand for chicken creating a lower price and a smaller amount of chicken purchased in the market.
B) decrease the supply of chicken creating a higher price and a smaller amount of chicken purchased in the market.
C) increase the demand for chicken creating a higher price and a greater amount of chicken purchased in the market.
D) increase the supply of chicken creating a lower price and a greater amount of chicken purchased in the market.
Unlock Deck
Unlock for access to all 137 flashcards in this deck.
Unlock Deck
k this deck
34
Exhibit 4-7 Demand and supply schedules for movie tickets
In Exhibit 4-7, a 100 unit decrease in quantity demanded at every price level would cause the new equilibrium price to become:
A) $8.
B) $6.
C) $4.
D) $2.
In Exhibit 4-7, a 100 unit decrease in quantity demanded at every price level would cause the new equilibrium price to become:
A) $8.
B) $6.
C) $4.
D) $2.
Unlock Deck
Unlock for access to all 137 flashcards in this deck.
Unlock Deck
k this deck
35
Exhibit 4-3 Supply and demand curves
In Exhibit 4-3, an increase in quantity supplied would cause a movement from which equilibrium point to another, other things being equal?
A) E1 to E2.
B) E1 to E4.
C) E4 to E1.
D) E3 to E4.
In Exhibit 4-3, an increase in quantity supplied would cause a movement from which equilibrium point to another, other things being equal?
A) E1 to E2.
B) E1 to E4.
C) E4 to E1.
D) E3 to E4.
Unlock Deck
Unlock for access to all 137 flashcards in this deck.
Unlock Deck
k this deck
36
Exhibit 4-2 Supply and demand curves
Beginning from an equilibrium at point E1 in Exhibit 4-2, an increase in demand for good X, other things being equal, would move the equilibrium point to:
A) E1, no change.
B) E2.
C) E3.
D) E4.
Beginning from an equilibrium at point E1 in Exhibit 4-2, an increase in demand for good X, other things being equal, would move the equilibrium point to:
A) E1, no change.
B) E2.
C) E3.
D) E4.
Unlock Deck
Unlock for access to all 137 flashcards in this deck.
Unlock Deck
k this deck
37
Exhibit 4-6 Demand and supply curves
If the market supply increases and, simultaneously, market demand decreases, the new equilibrium will show:
A) market price will decrease, and market quantity exchanged could increase, decrease, or remain unchanged.
B) market price will increase, and market quantity exchanged will decrease.
C) market price will increase, and the quantity exchanged could increase, decrease, or remain the same.
D) market price could increase, decrease, or remain the same, and quantity exchanged will increase.
Unlock Deck
Unlock for access to all 137 flashcards in this deck.
Unlock Deck
k this deck
38
Ceteris paribus , if consumer tastes change so that more people are eating broccoli, then what will happen to the market equilibrium for cabbage, a substitute good for broccoli?
A) Price will increase, and quantity will increase.
B) Price will decrease, and quantity will decrease.
C) Price will decrease, and quantity will increase.
D) Price will increase, and quantity will decrease.
A) Price will increase, and quantity will increase.
B) Price will decrease, and quantity will decrease.
C) Price will decrease, and quantity will increase.
D) Price will increase, and quantity will decrease.
Unlock Deck
Unlock for access to all 137 flashcards in this deck.
Unlock Deck
k this deck
39
Exhibit 4-5 Supply and demand curves for computers
Which of the following changes could cause the computer market to change as shown in Exhibit 4-5?
A) Lower costs for computer chips and motherboards.
B) The failure of several computer manufacturers.
C) Higher prices for computer software.
D) More features and greater ease of use.
Which of the following changes could cause the computer market to change as shown in Exhibit 4-5?
A) Lower costs for computer chips and motherboards.
B) The failure of several computer manufacturers.
C) Higher prices for computer software.
D) More features and greater ease of use.
Unlock Deck
Unlock for access to all 137 flashcards in this deck.
Unlock Deck
k this deck
40
Exhibit 4-3 Supply and demand curves
Initially the market shown in Exhibit 4-3 is in equilibrium at P2, Q2 (E2). Changes in market conditions result in a new equilibrium at P2, Q4 (E4). This change is stated as a(n):
A) increase in supply and an increase in demand.
B) increase in supply and a decrease in demand.
C) decrease in demand and a decrease in supply.
D) increase in demand with supply held constant at S2.
Unlock Deck
Unlock for access to all 137 flashcards in this deck.
Unlock Deck
k this deck
41
Exhibit 4-8 Demand and supply curves
In Exhibit 4-8, a movement from A to B is best explained by:
A) an increase in income and in the number of suppliers.
B) an increase in the price of other goods.
C) an increase in the population.
D) a decrease in income if X is a normal good and an improvement in the technology used to produce the good.
Unlock Deck
Unlock for access to all 137 flashcards in this deck.
Unlock Deck
k this deck
42
Stuart tells his student government representative at his college to propose rent controls on local rental housing as a way to help students afford rental housing. Maria disagrees with Stuart, saying rent controls will make students worse off. Who is correct and why?Economic theory suggests that this policy would harm students as a whole despite the fact that some students who are able to find housing at the reduced price would benefit. Which of the following are some of the offsetting secondary effects of the rent controls that would work to the disadvantage of students?
A) Stuart is correct. All students will be better off with a lower price of rental housing.
B) Maria is correct. All students will be worse off with a shortage of rental housing.
C) Neither are correct. Imposing rent controls will have no effect on the rental housing market.
D) Both are correct in part. Rent controls will be better for the students who are able to find housing at the reduced price but worse for students as a whole because there will be a shortage of rental housing, a lower future supply, and the quality will deteriorate.
Unlock Deck
Unlock for access to all 137 flashcards in this deck.
Unlock Deck
k this deck
43
If the equilibrium price of bread is $2 and the government imposes a $1.50 price ceiling on the price of bread, then:
A) more bread will be produced.
B) there will be a shortage of bread.
C) the demand for bread will decrease.
D) producers will charge $0.50 for bread.
A) more bread will be produced.
B) there will be a shortage of bread.
C) the demand for bread will decrease.
D) producers will charge $0.50 for bread.
Unlock Deck
Unlock for access to all 137 flashcards in this deck.
Unlock Deck
k this deck
44
If the equilibrium price of aspirin is $2.50 and a price ceiling is imposed at $3.00, the market will have a(n):
A) surplus.
B) shortage.
C) accumulation of inventories.
D) equilibrium.
A) surplus.
B) shortage.
C) accumulation of inventories.
D) equilibrium.
Unlock Deck
Unlock for access to all 137 flashcards in this deck.
Unlock Deck
k this deck
45
There was an extensive black market (illegal market) for many consumer products in the United States during World War II. A likely explanation of the black market is that:
A) the prices of goods were artificially held down by price controls.
B) black markets were legal during the war.
C) goods were not subject to price controls.
D) gasoline rationing greatly restricted civilians from driving to stores.
A) the prices of goods were artificially held down by price controls.
B) black markets were legal during the war.
C) goods were not subject to price controls.
D) gasoline rationing greatly restricted civilians from driving to stores.
Unlock Deck
Unlock for access to all 137 flashcards in this deck.
Unlock Deck
k this deck
46
An increase in both supply and demand causes which of the following?
A) Equilibrium price falls.
B) Equilibrium price rises.
C) Equilibrium price change is indeterminate.
D) Equilibrium quantity change is indeterminate.
A) Equilibrium price falls.
B) Equilibrium price rises.
C) Equilibrium price change is indeterminate.
D) Equilibrium quantity change is indeterminate.
Unlock Deck
Unlock for access to all 137 flashcards in this deck.
Unlock Deck
k this deck
47
Rent control applies to about two-thirds of the private rental housing in New York City. Economic theory suggests that a below-equilibrium price established by rent control:
A) creates a surplus of rental housing.
B) promotes a rapid increase in the future supply of housing.
C) results in poor service and quality deterioration of many rental units.
D) leads to a reduction in housing discrimination against minorities.
A) creates a surplus of rental housing.
B) promotes a rapid increase in the future supply of housing.
C) results in poor service and quality deterioration of many rental units.
D) leads to a reduction in housing discrimination against minorities.
Unlock Deck
Unlock for access to all 137 flashcards in this deck.
Unlock Deck
k this deck
48
Exhibit 4-8 Demand and supply curves
In Exhibit 4-8, a movement from A to C is best described as a(n):
A) increase in the quantity supplied and a decrease in the demand.
B) decrease in the quantity supplied and a decrease in demand.
C) decrease in the quantity supplied and an increase in demand.
D) decrease in the quantity demanded and a decrease in supply.
Unlock Deck
Unlock for access to all 137 flashcards in this deck.
Unlock Deck
k this deck
49
An increase in demand and a decrease in supply cause which of the following?
A) Equilibrium price change is indeterminate.
B) Equilibrium quantity decreases.
C) Equilibrium price falls.
D) Equilibrium price rises.
A) Equilibrium price change is indeterminate.
B) Equilibrium quantity decreases.
C) Equilibrium price falls.
D) Equilibrium price rises.
Unlock Deck
Unlock for access to all 137 flashcards in this deck.
Unlock Deck
k this deck
50
If the equilibrium price of good X is $5 and a price ceiling is imposed at $4, the result will be a(n):
A) accumulation of inventories of unsold gas.
B) shortage.
C) surplus.
D) quantity supplied that exceeds the quantity demanded.
A) accumulation of inventories of unsold gas.
B) shortage.
C) surplus.
D) quantity supplied that exceeds the quantity demanded.
Unlock Deck
Unlock for access to all 137 flashcards in this deck.
Unlock Deck
k this deck
51
If a government imposed price ceiling legally sets the price of beef below market equilibrium, which of the following will most likely happen?
A) The quantity of beef demanded will decrease.
B) The quantity of beef supplied will increase.
C) There will be a surplus of beef.
D) There will be a shortage of beef.
A) The quantity of beef demanded will decrease.
B) The quantity of beef supplied will increase.
C) There will be a surplus of beef.
D) There will be a shortage of beef.
Unlock Deck
Unlock for access to all 137 flashcards in this deck.
Unlock Deck
k this deck
52
Ceteris paribus , an increase in the supply of a good causes which of the following?
A) Lowers the equilibrium price, and reduces the quantity bought and sold.
B) Raises the equilibrium price, and raises the quantity bought and sold.
C) Raises the equilibrium price, and increases the quantity bought and sold.
D) Lowers the equilibrium price, and increases the quantity bought and sold.
Unlock Deck
Unlock for access to all 137 flashcards in this deck.
Unlock Deck
k this deck
53
If the government imposes a price ceiling below the market equilibrium price, which of the following will result?
A) There will be a surplus of the good.
B) The quantity demanded will exceed the quantity supplied.
C) The quantity supplied will exceed the quantity demanded.
D) The demand curve will shift to the left.
A) There will be a surplus of the good.
B) The quantity demanded will exceed the quantity supplied.
C) The quantity supplied will exceed the quantity demanded.
D) The demand curve will shift to the left.
Unlock Deck
Unlock for access to all 137 flashcards in this deck.
Unlock Deck
k this deck
54
Exhibit 4-8 Demand and supply curves
In Exhibit 4-8, a movement from A to D is best described as a(n):
A) increase in the quantity demanded and an increase in supply.
B) increase in supply and demand.
C) increase in both the quantity demanded and supplied.
D) increase in the quantity supplied and in the demand.
In Exhibit 4-8, a movement from A to D is best described as a(n):
A) increase in the quantity demanded and an increase in supply.
B) increase in supply and demand.
C) increase in both the quantity demanded and supplied.
D) increase in the quantity supplied and in the demand.
Unlock Deck
Unlock for access to all 137 flashcards in this deck.
Unlock Deck
k this deck
55
Price ceilings set below the equilibrium create:
A) externalities.
B) unemployment.
C) shortages.
D) surpluses.
A) externalities.
B) unemployment.
C) shortages.
D) surpluses.
Unlock Deck
Unlock for access to all 137 flashcards in this deck.
Unlock Deck
k this deck
56
Exhibit 4-11 Data on supply and demand
In Exhibit 4-11, the equilibrium price per bushel of wheat is:
A) $1.
B) $2.
C) $3.
D) $4.
In Exhibit 4-11, the equilibrium price per bushel of wheat is:
A) $1.
B) $2.
C) $3.
D) $4.
Unlock Deck
Unlock for access to all 137 flashcards in this deck.
Unlock Deck
k this deck
57
If the equilibrium price of good X is $4 and a price ceiling is imposed at $5, the result will be a(n):
A) depletion of inventories.
B) shortage.
C) surplus.
D) equilibrium.
A) depletion of inventories.
B) shortage.
C) surplus.
D) equilibrium.
Unlock Deck
Unlock for access to all 137 flashcards in this deck.
Unlock Deck
k this deck
58
When the government imposes a price ceiling on a good whose price is too high,
A) surpluses are created.
B) supply will increase to meet the demand.
C) chronic excess demand occurs.
D) quantity demanded of the good will fall.
A) surpluses are created.
B) supply will increase to meet the demand.
C) chronic excess demand occurs.
D) quantity demanded of the good will fall.
Unlock Deck
Unlock for access to all 137 flashcards in this deck.
Unlock Deck
k this deck
59
Exhibit 4-8 Demand and supply curves
In Exhibit 4-8, a movement from A to B in which price has decreased and quantity has increased is best explained by a(n):
A) increase in supply and demand.
B) decrease in supply and demand.
C) increase in supply that dominates a decrease in demand.
D) increase in demand that dominates a decrease supply.
Unlock Deck
Unlock for access to all 137 flashcards in this deck.
Unlock Deck
k this deck
60
If the equilibrium price of natural gas is $4 per thousand cubic feet and a price ceiling is imposed at $3 per thousand cubic feet, the result will be:
A) a surplus of natural gas.
B) a shortage of natural gas.
C) an accumulation of inventories of unsold gas.
D) more natural gas available than what buyers want to buy.
A) a surplus of natural gas.
B) a shortage of natural gas.
C) an accumulation of inventories of unsold gas.
D) more natural gas available than what buyers want to buy.
Unlock Deck
Unlock for access to all 137 flashcards in this deck.
Unlock Deck
k this deck
61
If a price ceiling is imposed, then:
A) the market supply curve will shift to the right.
B) the market demand will shift to the left.
C) a shortage of product will result.
D) the market equilibrium price is below the level the government wishes to achieve.
A) the market supply curve will shift to the right.
B) the market demand will shift to the left.
C) a shortage of product will result.
D) the market equilibrium price is below the level the government wishes to achieve.
Unlock Deck
Unlock for access to all 137 flashcards in this deck.
Unlock Deck
k this deck
62
Exhibit 4-10 Supply and demand data for apricots
Which of the following would occur if the government sets a price floor of $4 in the market shown in Exhibit 4-10?
A) There would be a shortage of apricots.
B) Buyers would not purchase all of the apricots that are grown.
C) Buyers would purchase more apricots than are currently being supplied.
D) Farmers would reduce the number of acres allocated to the growing of apricots.
Unlock Deck
Unlock for access to all 137 flashcards in this deck.
Unlock Deck
k this deck
63
The minimum price for a good set by the government above the equilibrium price is called a:
A) price ceiling.
B) price floor.
C) parity price ratio.
D) market-generated price.
A) price ceiling.
B) price floor.
C) parity price ratio.
D) market-generated price.
Unlock Deck
Unlock for access to all 137 flashcards in this deck.
Unlock Deck
k this deck
64
Price floors are instituted because the government wants to:
A) help consumers.
B) help producers.
C) raise tax revenue.
D) increase demand.
A) help consumers.
B) help producers.
C) raise tax revenue.
D) increase demand.
Unlock Deck
Unlock for access to all 137 flashcards in this deck.
Unlock Deck
k this deck
65
Rent controls create distortions in the housing market by:
A) increasing the supply of housing in the long run.
B) raising property values.
C) encouraging landlords to overspend for maintenance.
D) discouraging new housing construction.
A) increasing the supply of housing in the long run.
B) raising property values.
C) encouraging landlords to overspend for maintenance.
D) discouraging new housing construction.
Unlock Deck
Unlock for access to all 137 flashcards in this deck.
Unlock Deck
k this deck
66
The excess supply created when governments impose a price floor is:
A) shrinking as the floor rises.
B) the difference between the old quantity supplied and new quantity demanded.
C) the difference between the new quantity supplied and the old quantity demanded.
D) the difference between the new quantity supplied and the new quantity demanded.
A) shrinking as the floor rises.
B) the difference between the old quantity supplied and new quantity demanded.
C) the difference between the new quantity supplied and the old quantity demanded.
D) the difference between the new quantity supplied and the new quantity demanded.
Unlock Deck
Unlock for access to all 137 flashcards in this deck.
Unlock Deck
k this deck
67
A price ceiling:
A) is the lowest price that the law will allow to be charged in the market.
B) is the highest price that the law will allow to be charged in the market.
C) is the price that must be charged in the market.
D) would be imposed if the government believes the market equilibrium price is too low.
A) is the lowest price that the law will allow to be charged in the market.
B) is the highest price that the law will allow to be charged in the market.
C) is the price that must be charged in the market.
D) would be imposed if the government believes the market equilibrium price is too low.
Unlock Deck
Unlock for access to all 137 flashcards in this deck.
Unlock Deck
k this deck
68
An example of a price ceiling would be:
A) a ration coupon.
B) a guarantee of a target price for farm products.
C) parity pricing.
D) rent control.
A) a ration coupon.
B) a guarantee of a target price for farm products.
C) parity pricing.
D) rent control.
Unlock Deck
Unlock for access to all 137 flashcards in this deck.
Unlock Deck
k this deck
69
A price floor is:
A) the lowest price a producer will accept.
B) the lowest price a consumer will pay.
C) a minimum price set by the government above equilibrium price.
D) a maximum price set by the government above equilibrium price
A) the lowest price a producer will accept.
B) the lowest price a consumer will pay.
C) a minimum price set by the government above equilibrium price.
D) a maximum price set by the government above equilibrium price
Unlock Deck
Unlock for access to all 137 flashcards in this deck.
Unlock Deck
k this deck
70
A legally mandated minimum wage is an example of:
A) the invisible hand principle.
B) a price floor.
C) a price ceiling.
D) a fringe benefit.
A) the invisible hand principle.
B) a price floor.
C) a price ceiling.
D) a fringe benefit.
Unlock Deck
Unlock for access to all 137 flashcards in this deck.
Unlock Deck
k this deck
71
Exhibit 4-10 Supply and demand data for apricots
Which of the following would occur if the government set a price ceiling of $1 in the market shown in Exhibit 4-10?
A) There would be a shortage of apricots.
B) Buyers would not want to purchase all of the apricots that are supplied.
C) There would be a surplus of apricots.
D) Farmers would reduce the number of acres allocated to the growing of apricots.
Unlock Deck
Unlock for access to all 137 flashcards in this deck.
Unlock Deck
k this deck
72
Price floors are used as a method to:
A) ensure buyers that goods won't be cheaper tomorrow.
B) see that production levels don't fall too low.
C) guarantee there will be enough food for everyone.
D) ensure sellers a minimum price for their goods.
A) ensure buyers that goods won't be cheaper tomorrow.
B) see that production levels don't fall too low.
C) guarantee there will be enough food for everyone.
D) ensure sellers a minimum price for their goods.
Unlock Deck
Unlock for access to all 137 flashcards in this deck.
Unlock Deck
k this deck
73
A minimum wage that is set below the equilibrium wage will:
A) cause increased unemployment.
B) have no effect on employment.
C) cause the overall wage to increase.
D) cause the overall wage to decrease.
A) cause increased unemployment.
B) have no effect on employment.
C) cause the overall wage to increase.
D) cause the overall wage to decrease.
Unlock Deck
Unlock for access to all 137 flashcards in this deck.
Unlock Deck
k this deck
74
One of the problems created by price floors set above the equilibrium is:
A) the effect on firm profitability.
B) firms don't have incentives to reduce costs.
C) the creation of surplus.
D) how to cope with the shortages.
A) the effect on firm profitability.
B) firms don't have incentives to reduce costs.
C) the creation of surplus.
D) how to cope with the shortages.
Unlock Deck
Unlock for access to all 137 flashcards in this deck.
Unlock Deck
k this deck
75
Exhibit 4-9 Data on supply and demand
In Exhibit 4-9, if a price ceiling is set at $1.50 the market result after adjustment is:
A) a shortage of 150 units.
B) a surplus of 100 units.
C) shortage of 100 units.
D) equilibrium at 200 units.
In Exhibit 4-9, if a price ceiling is set at $1.50 the market result after adjustment is:
A) a shortage of 150 units.
B) a surplus of 100 units.
C) shortage of 100 units.
D) equilibrium at 200 units.
Unlock Deck
Unlock for access to all 137 flashcards in this deck.
Unlock Deck
k this deck
76
Which of the following is the most likely result of an increase in the minimum wage?
A) An increase in the employment of unskilled workers.
B) A decrease in the number of workers seeking minimum wage jobs.
C) An increase in the demand for unskilled workers.
D) A decrease in the employment of unskilled workers.
A) An increase in the employment of unskilled workers.
B) A decrease in the number of workers seeking minimum wage jobs.
C) An increase in the demand for unskilled workers.
D) A decrease in the employment of unskilled workers.
Unlock Deck
Unlock for access to all 137 flashcards in this deck.
Unlock Deck
k this deck
77
If a government-imposed price floor legally sets the price of milk above market equilibrium, which of the following will most likely happen?
A) The quantity of milk demanded will increase.
B) The quantity of milk supplied will decrease.
C) There will be a surplus of milk.
D) There will be a shortage of milk.
A) The quantity of milk demanded will increase.
B) The quantity of milk supplied will decrease.
C) There will be a surplus of milk.
D) There will be a shortage of milk.
Unlock Deck
Unlock for access to all 137 flashcards in this deck.
Unlock Deck
k this deck
78
If an increase in the government-imposed minimum wage pushes the price (wage) of unskilled labor above market equilibrium, which of the following will most likely occur in the unskilled labor market?
A) An increase in quantity of unskilled labor demanded.
B) A decrease in the quantity of unskilled labor supplied.
C) A shortage of unskilled labor.
D) A surplus of unskilled labor (unemployment).
A) An increase in quantity of unskilled labor demanded.
B) A decrease in the quantity of unskilled labor supplied.
C) A shortage of unskilled labor.
D) A surplus of unskilled labor (unemployment).
Unlock Deck
Unlock for access to all 137 flashcards in this deck.
Unlock Deck
k this deck
79
One likely result of a price ceiling is that:
A) a surplus of product would result.
B) the price charged in the market would be above the equilibrium price.
C) the price charged in the market would be the equilibrium price.
D) the available product must be rationed.
A) a surplus of product would result.
B) the price charged in the market would be above the equilibrium price.
C) the price charged in the market would be the equilibrium price.
D) the available product must be rationed.
Unlock Deck
Unlock for access to all 137 flashcards in this deck.
Unlock Deck
k this deck
80
A good example of a price floor is:
A) rent controls on apartments in major cities.
B) general admission tickets to concerts.
C) the minimum wage law.
D) food stamp regulations.
A) rent controls on apartments in major cities.
B) general admission tickets to concerts.
C) the minimum wage law.
D) food stamp regulations.
Unlock Deck
Unlock for access to all 137 flashcards in this deck.
Unlock Deck
k this deck
Unlock Deck
Unlock for access to all 137 flashcards in this deck.


