Deck 13: Hypothesis Tests Applied to Means: Two Related Samples
Full screen (f)
Question
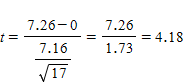
In Chapter 13 the calculation for a repeated measures t test on change within subjects is given as

Use this formula for the next several questions.
In the formula for t , 1.73 is
A) the standard deviation of the sample.
B) the standard deviation of the population.
C) the standard error of the mean.
D) the difference between the means.
Use this formula for the next several questions.
In the formula for t , 1.73 is
A) the standard deviation of the sample.
B) the standard deviation of the population.
C) the standard error of the mean.
D) the difference between the means.
Question
In Chapter 13 the calculation for a repeated measures t test on change within subjects is given as

Use this formula for the next several questions.
In the formula for t , there are _______ pairs of observations in the study.
A) 17
B) 34
C) 18
D) 4.18
Use this formula for the next several questions.
In the formula for t , there are _______ pairs of observations in the study.
A) 17
B) 34
C) 18
D) 4.18
Question
In Chapter 13 the calculation for a repeated measures t test on change within subjects is given as

Use this formula for the next several questions.
If the critical value of t associated with the above formula is 2.12, what would you conclude about your means?
A) There is a significant difference between the means.
B) There is a significant difference between the standard deviations.
C) There is no significant difference between the means.
D) p > .05
Question
Question
Question
Question
Question
Question
Question
Question
The following is part of the printout from an SPSS analysis of data on paired samples. Use it to answer the next several questions.

The standard error of the mean of difference scores could be calculated by
A) taking the standard deviation of the differences.
B) repeating the study many times and looking at the distribution of means.
C) dividing the standard deviation of difference scores by the square root of the sample size.
D) looking at the standard deviation of the posttest scores.
Question
Question
Question
Question
Question
Question
In Chapter 13 the calculation for a repeated measures t test on change within subjects is given as
Use this formula for the next several questions.
A t test, in general, involves
A) dividing the difference between means by the standard deviation of the population.
B) dividing the difference between means by the standard deviation of the sample.
C) dividing the difference between means by the standard error of a distribution of differences between means.
D) dividing the difference in standard deviations by the size of the larger mean.
Question
In Chapter 13 the calculation for a repeated measures t test on change within subjects is given as

Use this formula for the next several questions.
In a repeated measures t , the degrees of freedom are equal to
A) N .
B) N - 1.
C) N - 2.
D) the number of observations in the two conditions.
Use this formula for the next several questions.
In a repeated measures t , the degrees of freedom are equal to
A) N .
B) N - 1.
C) N - 2.
D) the number of observations in the two conditions.
Question
Question
Question
Question
Question
Question
Question
The following is part of the printout from an SPSS analysis of data on paired samples. Use it to answer the next several questions.

The 2-tailed significance level tells us
A) the difference is not significant at the .05 level.
B) the difference is significant at the .05 level.
C) the means of the pre- and post-scores are large.
D) We can't tell whether the difference is significant or not.
The 2-tailed significance level tells us
A) the difference is not significant at the .05 level.
B) the difference is significant at the .05 level.
C) the means of the pre- and post-scores are large.
D) We can't tell whether the difference is significant or not.
Question
The following is part of the printout from an SPSS analysis of data on paired samples. Use it to answer the next several questions.
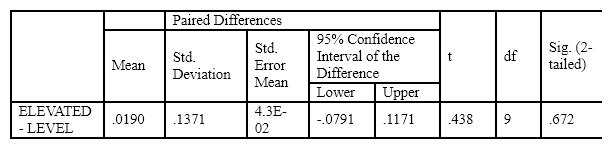
In the output, the value of .1371 stands for
A) the standard deviation of the pre-test scores.
B) the standard deviation of the post-test scores.
C) the standard deviation of the difference scores.
D) none of the above
In the output, the value of .1371 stands for
A) the standard deviation of the pre-test scores.
B) the standard deviation of the post-test scores.
C) the standard deviation of the difference scores.
D) none of the above
Question
Question
Question
Question
Question
The following is part of the printout from an SPSS analysis of data on paired samples. Use it to answer the next several questions.

The standard error of the mean would normally be written
A) 4302
B) 0.043
C) 430
D) 43
The standard error of the mean would normally be written
A) 4302
B) 0.043
C) 430
D) 43
Question
When we have related samples, the best measure of the effect size
 uses
uses
A) the standard deviation of the difference scores.
B) the standard deviation of the pretest scores (if they exist).
C) the pooled estimate of the pre- and post-score standard deviations.
D) none of the above
usesA) the standard deviation of the difference scores.
B) the standard deviation of the pretest scores (if they exist).
C) the pooled estimate of the pre- and post-score standard deviations.
D) none of the above
Question
Question
Question
Question
Question
The following is part of the printout from an SPSS analysis of data on paired samples. Use it to answer the next several questions.

The confidence limits in the output can best be interpreted to mean
A) the difference between the pre- and post-test sample means is between -.0791 and .1171.
B) the population mean must be at least =.0791.
C) an interval computed in this way has a probability of .95 of encompassing the difference in population means.
D) the population mean has a probability of .95 of lying between -.0791 and .1171.
Question
The null hypothesis of a related scores t test is
A)
B)
C)
D)
A)
B)
C)
D)
Question
Question
Question
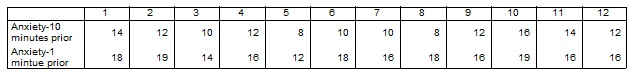
A student hypothesized that test anxiety increases as the time of the test approaches. Calculate t and evaluate the hypothesis given the following data.
Question
Question
Question
Answer these questions based on the following SPSS output.
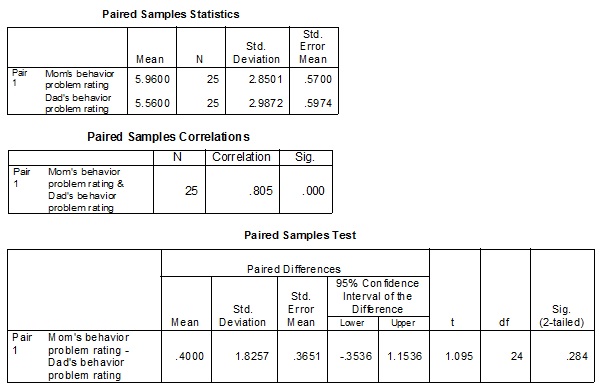
a. Are mothers' and fathers' scores correlated?
b. What is the mean difference in mothers' and fathers' scores?
c. Write a sentence interpreting the results of the t-test.
a. Are mothers' and fathers' scores correlated?
b. What is the mean difference in mothers' and fathers' scores?
c. Write a sentence interpreting the results of the t-test.
Question
Calculate and interpret t for the previous data.
Question
Question
Question
Question
Question
Question
Question
Question
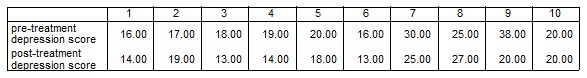
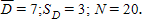
A psychologist designed a new treatment for depression. He predicted depressive symptoms would be lower post-treatment. The data follow. Calculate the difference for each subject, the mean difference, and the standard deviation of the difference.
Question
Question
Calculate and interpret the correlation for the previous data.
Question
A kindergarten teacher wanted to see if her students' social skills changed over the academic year. She compared the scores on a standardized measure of social skills at the beginning of the year, and the end of the year. The results follow:
a. What is the null hypothesis?
b. Is a one or two-tailed test more appropriate?
c. Calculate t .
d. Write a sentence explaining the results.
a. What is the null hypothesis?
b. Is a one or two-tailed test more appropriate?
c. Calculate t .
d. Write a sentence explaining the results.
Question
Question
Question

Unlock Deck
Sign up to unlock the cards in this deck!
Unlock Deck
Unlock Deck
1/59
Play
Full screen (f)
Deck 13: Hypothesis Tests Applied to Means: Two Related Samples
1
In Chapter 13 the calculation for a repeated measures t test on change within subjects is given as
Use this formula for the next several questions.
In the formula for t , 1.73 is
A) the standard deviation of the sample.
B) the standard deviation of the population.
C) the standard error of the mean.
D) the difference between the means.
Use this formula for the next several questions.
In the formula for t , 1.73 is
A) the standard deviation of the sample.
B) the standard deviation of the population.
C) the standard error of the mean.
D) the difference between the means.
the standard error of the mean.
2
In Chapter 13 the calculation for a repeated measures t test on change within subjects is given as
Use this formula for the next several questions.
In the formula for t , there are _______ pairs of observations in the study.
A) 17
B) 34
C) 18
D) 4.18
Use this formula for the next several questions.
In the formula for t , there are _______ pairs of observations in the study.
A) 17
B) 34
C) 18
D) 4.18
17
3
In Chapter 13 the calculation for a repeated measures t test on change within subjects is given as
Use this formula for the next several questions.
If the critical value of t associated with the above formula is 2.12, what would you conclude about your means?
A) There is a significant difference between the means.
B) There is a significant difference between the standard deviations.
C) There is no significant difference between the means.
D) p > .05
There is a significant difference between the means.
4
Which of the following terms does NOT belong with the rest?
A) related samples
B) repeated samples
C) independent samples
D) matched samples
A) related samples
B) repeated samples
C) independent samples
D) matched samples
Unlock Deck
Unlock for access to all 59 flashcards in this deck.
Unlock Deck
k this deck
5
We are evaluating a method of therapy for extremely underweight adolescent girls. If we weighed our subjects at the beginning and end of therapy, a difference in weight could mean
A) that our therapy worked.
B) that people gain weight over time regardless of what we do.
C) that our scales changed due to repeated use.
D) all of the above
A) that our therapy worked.
B) that people gain weight over time regardless of what we do.
C) that our scales changed due to repeated use.
D) all of the above
Unlock Deck
Unlock for access to all 59 flashcards in this deck.
Unlock Deck
k this deck
6
We treat the repeated sample case differently from the case involving two separate samples because of
A) the difference in the means of the two samples.
B) the fact that different subjects were involved.
C) the correlation between the two sets of data.
D) the size of the sample.
A) the difference in the means of the two samples.
B) the fact that different subjects were involved.
C) the correlation between the two sets of data.
D) the size of the sample.
Unlock Deck
Unlock for access to all 59 flashcards in this deck.
Unlock Deck
k this deck
7
The null hypothesis in a repeated measures t test is
A) the hypothesis that the mean difference score is equal to 0.
B) the hypothesis that the mean difference score is different from 0 in either direction.
C) the hypothesis that post scores are larger than pre-scores.
D) the hypothesis that the variance of scores stays constant from pretest to posttest.
Unlock Deck
Unlock for access to all 59 flashcards in this deck.
Unlock Deck
k this deck
8
Which of the following is sometimes a serious problem with repeated measures designs?
A) Carryover effects can cloud the interpretation.
B) Small sample sizes can distort the results more than with other designs.
C) They require more subjects than designs with independent samples.
D) all of the above
A) Carryover effects can cloud the interpretation.
B) Small sample sizes can distort the results more than with other designs.
C) They require more subjects than designs with independent samples.
D) all of the above
Unlock Deck
Unlock for access to all 59 flashcards in this deck.
Unlock Deck
k this deck
9
We would be least likely to use a repeated measures design when
A) there are substantial individual differences.
B) there are minimal individual differences.
C) we want to control for differences among subjects.
D) we want to compare husbands and wives on their levels of marriage satisfaction.
A) there are substantial individual differences.
B) there are minimal individual differences.
C) we want to control for differences among subjects.
D) we want to compare husbands and wives on their levels of marriage satisfaction.
Unlock Deck
Unlock for access to all 59 flashcards in this deck.
Unlock Deck
k this deck
10
Which of the following are reasons why we might NOT use a repeated measures t ?
A) It requires too many subjects.
B) It is more likely to reject a null hypothesis than the design with difference subjects in the groups.
C) Information the subjects pick up in early trials may influence their performance on later trials in ways that we don't find helpful.
D) It allows the correlation between trials to influence the results.
Unlock Deck
Unlock for access to all 59 flashcards in this deck.
Unlock Deck
k this deck
11
The following is part of the printout from an SPSS analysis of data on paired samples. Use it to answer the next several questions.
The standard error of the mean of difference scores could be calculated by
A) taking the standard deviation of the differences.
B) repeating the study many times and looking at the distribution of means.
C) dividing the standard deviation of difference scores by the square root of the sample size.
D) looking at the standard deviation of the posttest scores.
Unlock Deck
Unlock for access to all 59 flashcards in this deck.
Unlock Deck
k this deck
12
A difference score is obtained by
A) subtracting the Before score from the After score.
B) subtracting the After score from the Before score.
C) dividing After scores by Before scores.
D) either a or b, just so long as you are consistent
A) subtracting the Before score from the After score.
B) subtracting the After score from the Before score.
C) dividing After scores by Before scores.
D) either a or b, just so long as you are consistent
Unlock Deck
Unlock for access to all 59 flashcards in this deck.
Unlock Deck
k this deck
13
In the preceding question on autonomy in children, we would be most likely to use that design, rather than random sampling of children, because
A) we want to control for differences in means.
B) we want to control for differences in parenting style.
C) we expect scores of children in the same family to be unrelated.
D) we want to control for differences in age between first and second born children.
A) we want to control for differences in means.
B) we want to control for differences in parenting style.
C) we expect scores of children in the same family to be unrelated.
D) we want to control for differences in age between first and second born children.
Unlock Deck
Unlock for access to all 59 flashcards in this deck.
Unlock Deck
k this deck
14
The mean of a column of difference scores is equal to
A) the ratio of the means of the individual columns.
B) the difference between the means of the individual columns.
C) the sample size.
D) We can't tell without calculating it for a set of data.
A) the ratio of the means of the individual columns.
B) the difference between the means of the individual columns.
C) the sample size.
D) We can't tell without calculating it for a set of data.
Unlock Deck
Unlock for access to all 59 flashcards in this deck.
Unlock Deck
k this deck
15
Which of the following was NOT an advantage of repeated measures designs discussed in the text?
A) It allows us to avoid problems associated with variability from subject to subject.
B) It helps to control for extraneous variables.
C) It is easier to calculate the statistics.
D) It requires fewer subjects that other designs.
A) It allows us to avoid problems associated with variability from subject to subject.
B) It helps to control for extraneous variables.
C) It is easier to calculate the statistics.
D) It requires fewer subjects that other designs.
Unlock Deck
Unlock for access to all 59 flashcards in this deck.
Unlock Deck
k this deck
16
We want to study the mean difference in autonomy between first-born and second-born children. Instead of taking a random sample of children we take a random sample of families and sort the children into first- and second-born. The dependent variable is a measure of autonomy. This experiment would most likely employ
A) a repeated measures analysis.
B) an independent measures analysis.
C) a correlation coefficient.
D) a scatterplot.
A) a repeated measures analysis.
B) an independent measures analysis.
C) a correlation coefficient.
D) a scatterplot.
Unlock Deck
Unlock for access to all 59 flashcards in this deck.
Unlock Deck
k this deck
17
In Chapter 13 the calculation for a repeated measures t test on change within subjects is given as
Use this formula for the next several questions.
A t test, in general, involves
A) dividing the difference between means by the standard deviation of the population.
B) dividing the difference between means by the standard deviation of the sample.
C) dividing the difference between means by the standard error of a distribution of differences between means.
D) dividing the difference in standard deviations by the size of the larger mean.
Unlock Deck
Unlock for access to all 59 flashcards in this deck.
Unlock Deck
k this deck
18
In Chapter 13 the calculation for a repeated measures t test on change within subjects is given as
Use this formula for the next several questions.
In a repeated measures t , the degrees of freedom are equal to
A) N .
B) N - 1.
C) N - 2.
D) the number of observations in the two conditions.
Use this formula for the next several questions.
In a repeated measures t , the degrees of freedom are equal to
A) N .
B) N - 1.
C) N - 2.
D) the number of observations in the two conditions.
Unlock Deck
Unlock for access to all 59 flashcards in this deck.
Unlock Deck
k this deck
19
A repeated measures t test is more likely to lead to rejection of the null hypothesis if
A) subjects show considerable variability in their change scores.
B) many subjects show no change.
C) some subjects change a lot more than others.
D) the degree of change is consistent across subjects.
A) subjects show considerable variability in their change scores.
B) many subjects show no change.
C) some subjects change a lot more than others.
D) the degree of change is consistent across subjects.
Unlock Deck
Unlock for access to all 59 flashcards in this deck.
Unlock Deck
k this deck
20
If we test the mean amount that alcoholic subjects drink before and after therapy, and that difference is NOT statistically significant, this could mean
A) the therapy was not effective.
B) the sample size was too large.
C) the study lacked sufficient power.
D) a and c
A) the therapy was not effective.
B) the sample size was too large.
C) the study lacked sufficient power.
D) a and c
Unlock Deck
Unlock for access to all 59 flashcards in this deck.
Unlock Deck
k this deck
21
The difference between the values of degrees of freedom for one sample t tests and related means t tests is that
A) related means t tests have a df = N - 2, where N is the number of pairs of scores.
B) related means t tests have a df = N, where N is the number of pairs of scores.
C) related means t tests have a df = N - 1, where N is the number of pairs of scores.
D) one sample t tests have a df = N - 2, where N is the total number of raw scores.
Unlock Deck
Unlock for access to all 59 flashcards in this deck.
Unlock Deck
k this deck
22
The example of the moon illusion discussed in the text illustrates the fact that
A) the best estimate of the size of an effect need not use the standard deviation.
B) standardized effect sizes are clearly superior.
C) the moon grows as it rises in the sky.
D) an effect size is best based on medians.
A) the best estimate of the size of an effect need not use the standard deviation.
B) standardized effect sizes are clearly superior.
C) the moon grows as it rises in the sky.
D) an effect size is best based on medians.
Unlock Deck
Unlock for access to all 59 flashcards in this deck.
Unlock Deck
k this deck
23
If the experimenter had instead used an independent samples design with the same number of participants
A) the power of the design would have increased.
B) the power of the design would have decreased.
C) the power of the design would have stayed the same.
D) the power of the design would not be predictably affected.
A) the power of the design would have increased.
B) the power of the design would have decreased.
C) the power of the design would have stayed the same.
D) the power of the design would not be predictably affected.
Unlock Deck
Unlock for access to all 59 flashcards in this deck.
Unlock Deck
k this deck
24
The scores of the same students on a pre-test and a post-test are independent.
Unlock Deck
Unlock for access to all 59 flashcards in this deck.
Unlock Deck
k this deck
25
The following is part of the printout from an SPSS analysis of data on paired samples. Use it to answer the next several questions.
The 2-tailed significance level tells us
A) the difference is not significant at the .05 level.
B) the difference is significant at the .05 level.
C) the means of the pre- and post-scores are large.
D) We can't tell whether the difference is significant or not.
The 2-tailed significance level tells us
A) the difference is not significant at the .05 level.
B) the difference is significant at the .05 level.
C) the means of the pre- and post-scores are large.
D) We can't tell whether the difference is significant or not.
Unlock Deck
Unlock for access to all 59 flashcards in this deck.
Unlock Deck
k this deck
26
The following is part of the printout from an SPSS analysis of data on paired samples. Use it to answer the next several questions.
In the output, the value of .1371 stands for
A) the standard deviation of the pre-test scores.
B) the standard deviation of the post-test scores.
C) the standard deviation of the difference scores.
D) none of the above
In the output, the value of .1371 stands for
A) the standard deviation of the pre-test scores.
B) the standard deviation of the post-test scores.
C) the standard deviation of the difference scores.
D) none of the above
Unlock Deck
Unlock for access to all 59 flashcards in this deck.
Unlock Deck
k this deck
27
If two sets of measures have the same mean, but different variances, the resulting t will be closest to
A) 1.00
B) 3.00
C) 0.00
D) It is impossible to know.
A) 1.00
B) 3.00
C) 0.00
D) It is impossible to know.
Unlock Deck
Unlock for access to all 59 flashcards in this deck.
Unlock Deck
k this deck
28
The t test for two related measures
A) is complicated by the fact that we have two different sets of numbers.
B) is simplified by the fact that we really only focus on the column of difference scores.
C) is not a valid test if the pre- and post-measures are correlated.
D) is impractical because you do not know the population variance.
Unlock Deck
Unlock for access to all 59 flashcards in this deck.
Unlock Deck
k this deck
29
In the t test for repeated measures the symbol SD stands for the
A) standard error of the mean.
B) standard error of differences between means.
C) standard deviation of differences scores.
D) There is no way to know.
A) standard error of the mean.
B) standard error of differences between means.
C) standard deviation of differences scores.
D) There is no way to know.
Unlock Deck
Unlock for access to all 59 flashcards in this deck.
Unlock Deck
k this deck
30
If the effect of the first measurement influences what the subject does on the second measurement, we would name this
A) a treatment effect.
B) a carryover effect.
C) a contaminating influence.
D) a flaw in the design.
A) a treatment effect.
B) a carryover effect.
C) a contaminating influence.
D) a flaw in the design.
Unlock Deck
Unlock for access to all 59 flashcards in this deck.
Unlock Deck
k this deck
31
The following is part of the printout from an SPSS analysis of data on paired samples. Use it to answer the next several questions.
The standard error of the mean would normally be written
A) 4302
B) 0.043
C) 430
D) 43
The standard error of the mean would normally be written
A) 4302
B) 0.043
C) 430
D) 43
Unlock Deck
Unlock for access to all 59 flashcards in this deck.
Unlock Deck
k this deck
32
When we have related samples, the best measure of the effect size
uses
A) the standard deviation of the difference scores.
B) the standard deviation of the pretest scores (if they exist).
C) the pooled estimate of the pre- and post-score standard deviations.
D) none of the above
usesA) the standard deviation of the difference scores.
B) the standard deviation of the pretest scores (if they exist).
C) the pooled estimate of the pre- and post-score standard deviations.
D) none of the above
Unlock Deck
Unlock for access to all 59 flashcards in this deck.
Unlock Deck
k this deck
33
In the Kaufman and Rock (1972) moon illusion example in the text, they hypothesized that there would be no moon illusion in their experiment. Experiments of this type pose problems for researchers because
A) you cannot logically prove the null hypothesis to be true.
B) the null hypothesis is obviously true.
C) rejecting the null hypothesis would mean that Kaufman and Rock were wrong.
D) the null hypothesis is obviously false.
A) you cannot logically prove the null hypothesis to be true.
B) the null hypothesis is obviously true.
C) rejecting the null hypothesis would mean that Kaufman and Rock were wrong.
D) the null hypothesis is obviously false.
Unlock Deck
Unlock for access to all 59 flashcards in this deck.
Unlock Deck
k this deck
34
Cohen's d refers to
A) the probability associated with t .
B) the difference between the means before and after treatment.
C) the "diagnostic" statistic.
D) the difference between the means before and after treatment divided by a standard deviation.
A) the probability associated with t .
B) the difference between the means before and after treatment.
C) the "diagnostic" statistic.
D) the difference between the means before and after treatment divided by a standard deviation.
Unlock Deck
Unlock for access to all 59 flashcards in this deck.
Unlock Deck
k this deck
35
The standard error of the difference between two means is
A) the standard deviation of a set of difference scores.
B) the standard deviation of a set of means of difference scores.
C) the variance of the means.
D) the standard deviation of the pretest scores.
A) the standard deviation of a set of difference scores.
B) the standard deviation of a set of means of difference scores.
C) the variance of the means.
D) the standard deviation of the pretest scores.
Unlock Deck
Unlock for access to all 59 flashcards in this deck.
Unlock Deck
k this deck
36
As the value of the mean difference score decreases
A) the t score increases.
B) the t score decreases.
C) the t score stays the same.
D) You cannot predict how the t score will be affected.
A) the t score increases.
B) the t score decreases.
C) the t score stays the same.
D) You cannot predict how the t score will be affected.
Unlock Deck
Unlock for access to all 59 flashcards in this deck.
Unlock Deck
k this deck
37
The following is part of the printout from an SPSS analysis of data on paired samples. Use it to answer the next several questions.
The confidence limits in the output can best be interpreted to mean
A) the difference between the pre- and post-test sample means is between -.0791 and .1171.
B) the population mean must be at least =.0791.
C) an interval computed in this way has a probability of .95 of encompassing the difference in population means.
D) the population mean has a probability of .95 of lying between -.0791 and .1171.
Unlock Deck
Unlock for access to all 59 flashcards in this deck.
Unlock Deck
k this deck
38
The null hypothesis of a related scores t test is
A)
B)
C)
D)
A)
B)
C)
D)
Unlock Deck
Unlock for access to all 59 flashcards in this deck.
Unlock Deck
k this deck
39
An experimenter collected data on how well a study guide improved grades on an exam taken late in the semester compared to an exam taken early in the semester. Using a related sample means t test, the results showed that later grades were higher than early grades ( t (74) = 3.64, p
A) The design controlled for students who did poorly both times.
B) The design controlled for extraneous variables like intelligence levels.
C) The design controlled for carry-over effects from already having taken one exam when the second exam was administered.
D) All of the above are advantages of this design.
Unlock Deck
Unlock for access to all 59 flashcards in this deck.
Unlock Deck
k this deck
40
Suppose that we take 15 gay couples and observe the difference within couples in terms of age. Then we take 15 straight couples are record the same differences. We want to test if straight couples are more similar in age than gay couples. (There is some reason to expect that this is true.) What statistical procedure would be most appropriate?
A) computing a correlation coefficient for each couple
B) running an independent samples t test between gays and straights
C) running a t test for related samples
D) using a chi-square test
A) computing a correlation coefficient for each couple
B) running an independent samples t test between gays and straights
C) running a t test for related samples
D) using a chi-square test
Unlock Deck
Unlock for access to all 59 flashcards in this deck.
Unlock Deck
k this deck
41
A student hypothesized that test anxiety increases as the time of the test approaches. Calculate t and evaluate the hypothesis given the following data.
Unlock Deck
Unlock for access to all 59 flashcards in this deck.
Unlock Deck
k this deck
42
Related samples designs require fewer subjects than independent sample designs to achieve the same degree of statistical power.
Unlock Deck
Unlock for access to all 59 flashcards in this deck.
Unlock Deck
k this deck
43
A research article says, "Students scored higher at the post-test than at the pre-test, t (29) = 1.30; p " What would you conclude?
Unlock Deck
Unlock for access to all 59 flashcards in this deck.
Unlock Deck
k this deck
44
Answer these questions based on the following SPSS output.
a. Are mothers' and fathers' scores correlated?
b. What is the mean difference in mothers' and fathers' scores?
c. Write a sentence interpreting the results of the t-test.
a. Are mothers' and fathers' scores correlated?
b. What is the mean difference in mothers' and fathers' scores?
c. Write a sentence interpreting the results of the t-test.
Unlock Deck
Unlock for access to all 59 flashcards in this deck.
Unlock Deck
k this deck
45
Calculate and interpret t for the previous data.
Unlock Deck
Unlock for access to all 59 flashcards in this deck.
Unlock Deck
k this deck
46
In repeated measures designs, the difference score refers to the difference in standard deviations for the two variables being compared.
Unlock Deck
Unlock for access to all 59 flashcards in this deck.
Unlock Deck
k this deck
47
A researcher hypothesized that adolescent girls are more invested in their romantic relationships than are adolescent boys. She asked adolescent partners to rate the total amount of time they engaged in activities centered around their relationship (e.g., seeing each other, thinking about the partner, talking about the relationship with others). In a sample of 41 couples, girls spent an average of 12 hours a week and boys an average of 10. The standard deviation of the difference was 1.5 hours.
a. Calculate t .
b. Was the research hypothesis supported? Explain.
a. Calculate t .
b. Was the research hypothesis supported? Explain.
Unlock Deck
Unlock for access to all 59 flashcards in this deck.
Unlock Deck
k this deck
48
Individual differences between subjects are less problematic in related samples designs than in independent samples designs.
Unlock Deck
Unlock for access to all 59 flashcards in this deck.
Unlock Deck
k this deck
49
The variables under study in repeated measures designs are unrelated to one another.
Unlock Deck
Unlock for access to all 59 flashcards in this deck.
Unlock Deck
k this deck
50
A repeated measures t test would be appropriate to see if students who took the SAT in 2000 scored higher than students who took the SAT in 2002.
Unlock Deck
Unlock for access to all 59 flashcards in this deck.
Unlock Deck
k this deck
51
The formula for calculating a related samples t includes the standard deviations of the two variables being compared.
Unlock Deck
Unlock for access to all 59 flashcards in this deck.
Unlock Deck
k this deck
52
Generate three examples of research questions that are appropriate for testing with a related samples t-test.
Unlock Deck
Unlock for access to all 59 flashcards in this deck.
Unlock Deck
k this deck
53
A psychologist designed a new treatment for depression. He predicted depressive symptoms would be lower post-treatment. The data follow. Calculate the difference for each subject, the mean difference, and the standard deviation of the difference.
Unlock Deck
Unlock for access to all 59 flashcards in this deck.
Unlock Deck
k this deck
54
Repeated measures designs are subject to order effects.
Unlock Deck
Unlock for access to all 59 flashcards in this deck.
Unlock Deck
k this deck
55
Calculate and interpret the correlation for the previous data.
Unlock Deck
Unlock for access to all 59 flashcards in this deck.
Unlock Deck
k this deck
56
A kindergarten teacher wanted to see if her students' social skills changed over the academic year. She compared the scores on a standardized measure of social skills at the beginning of the year, and the end of the year. The results follow:
a. What is the null hypothesis?
b. Is a one or two-tailed test more appropriate?
c. Calculate t .
d. Write a sentence explaining the results.
a. What is the null hypothesis?
b. Is a one or two-tailed test more appropriate?
c. Calculate t .
d. Write a sentence explaining the results.
Unlock Deck
Unlock for access to all 59 flashcards in this deck.
Unlock Deck
k this deck
57
Give an example in which carryover effects may impact a repeated measures design unduly.
Unlock Deck
Unlock for access to all 59 flashcards in this deck.
Unlock Deck
k this deck
58
The degrees of freedom in a related samples t-test are N - 2.
Unlock Deck
Unlock for access to all 59 flashcards in this deck.
Unlock Deck
k this deck
59
In a related samples t test, the difference score is usually compared to 0.
Unlock Deck
Unlock for access to all 59 flashcards in this deck.
Unlock Deck
k this deck
Unlock Deck
Unlock for access to all 59 flashcards in this deck.


