Deck 17: Factorial Analysis of Variance
Full screen (f)
Question
Question
Question
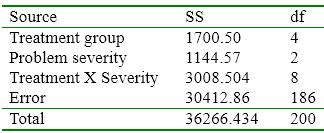
Use the following ANOVA summary table to answer the following four questions:
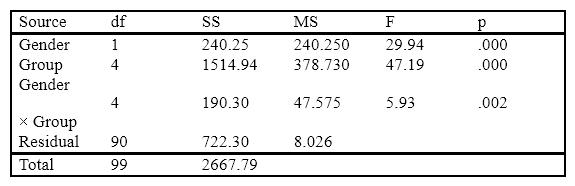
How many cells are there in this design?
A) 1
B) 4
C) 8
D) 10
How many cells are there in this design?
A) 1
B) 4
C) 8
D) 10
Question
Question
Question
Question
Question
Question
The notation  ... stands for
A) the mean of any row.
B) the mean of any column.
C) the mean of any cell.
D) the grand mean.
... stands forA) the mean of any row.
B) the mean of any column.
C) the mean of any cell.
D) the grand mean.
Question
Question
Question
Question
Use the following ANOVA summary table to answer the following four questions:

What does the significant F for Group most likely mean?
A) All the groups are different from each other.
B) None of the groups are different from each other.
C) The study has problems with control.
D) There is at least one significant difference among the groups.
What does the significant F for Group most likely mean?
A) All the groups are different from each other.
B) None of the groups are different from each other.
C) The study has problems with control.
D) There is at least one significant difference among the groups.
Question
Question
Question
Question
Use the following ANOVA summary table to answer the following four questions:

Why does Group have 4 degrees of freedom?
A) because there are 4 groups
B) because there are 5 groups (5 - 1 = 4)
C) because gender has 1 df (1 × 4 = 4)
D) because the design has four cells
Why does Group have 4 degrees of freedom?
A) because there are 4 groups
B) because there are 5 groups (5 - 1 = 4)
C) because gender has 1 df (1 × 4 = 4)
D) because the design has four cells
Question
Question
Question
Use the following ANOVA summary table to answer the following four questions:

The summary table suggests which of the following conclusions?
A) a main effect of gender
B) a main effect of group
C) an interaction of gender × group
D) all of the above
The summary table suggests which of the following conclusions?
A) a main effect of gender
B) a main effect of group
C) an interaction of gender × group
D) all of the above
Question
Question
Question
Question
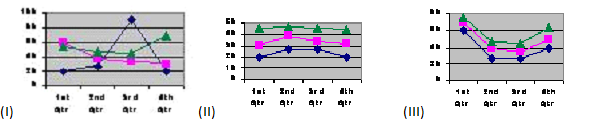
In the three graphs below, which one is most likely to have a main effect for quarters (the variable that increases along the X axis)?
A) I
B) II
C) III
D) none.
A) I
B) II
C) III
D) none.
Question
Which of the following graphs is most likely to portray an interaction?

A) I
B) II
C) III
D) There is no interaction in any of these.
A) I
B) II
C) III
D) There is no interaction in any of these.
Question
Question
Question
Question
Question
Question
The following is a printout from SPSS.
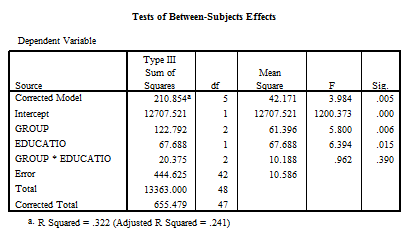
From this table, which of the following conclusions would be wrong?
A) There is a significant effect for Groups.
B) There is a significant effect for Education.
C) The interaction is significant.
D) Both main effects are significant.
From this table, which of the following conclusions would be wrong?
A) There is a significant effect for Groups.
B) There is a significant effect for Education.
C) The interaction is significant.
D) Both main effects are significant.
Question
Question
Question
Question
In a study which investigated the effects of amount of coffee consumption and mood (good or bad) on driving speed, the magnitude of effects estimates were as follows: Coffee:
 ; Mood:
 ; Coffee × Mood:
 . Together, how much of the variability in driving speed is accounted for by Coffee, Mood, and their interaction?
A) cannot determine
B) .49
C) .51
D) .19
; Mood: ; Coffee × Mood: . Together, how much of the variability in driving speed is accounted for by Coffee, Mood, and their interaction?A) cannot determine
B) .49
C) .51
D) .19
Question
Question
Question
Question
Question
In graph I below, the most apparent simple effect is for the line represented by

A) diamonds.
B) squares.
C) triangles.
D) It is unlikely for there to be a simple effect for any level of the independent variable.
A) diamonds.
B) squares.
C) triangles.
D) It is unlikely for there to be a simple effect for any level of the independent variable.
Question
Question
Question
Question
Question
Question
Question
Question
This graph represents a/an
A) repeated-measures design
B) one-way ANOVA
C) 2 × 5 factorial
D) significant alpha
A) repeated-measures design
B) one-way ANOVA
C) 2 × 5 factorial
D) significant alpha
Question
Question
Question
Question
Question
Question
Using the example in the text of a participant receiving therapy while sitting in a bath of ice water, what would be the best denominator for calculating  ?
?
A) the square root of MSerror
B) the square root of MSerror after removing effects due to the Ice condition and its interaction with treatment
C) the standard deviation of participants in the non-ice condition
D) the standard deviation of difference scores
?A) the square root of MSerror
B) the square root of MSerror after removing effects due to the Ice condition and its interaction with treatment
C) the standard deviation of participants in the non-ice condition
D) the standard deviation of difference scores
Question
Question
When we compute an effect size measure such as
 for a factorial ANOVA we have to decide
A) what effects should be included in estimating the denominator.
B) what are our variables of theoretical interest.
C) whether we want an r -family measure or a d -family measure.
D) all of the above
for a factorial ANOVA we have to decideA) what effects should be included in estimating the denominator.
B) what are our variables of theoretical interest.
C) whether we want an r -family measure or a d -family measure.
D) all of the above
Question
Question
Question
Question
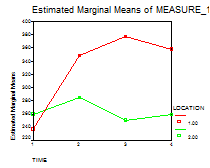
In this graph we can see that there is
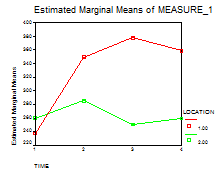
A) a significant difference between Location 1 at time 1 and Location 2 at time 1.
B) an interaction between location and time.
C) a significant post hoc analysis.
D) a quadratic significant correlation.
A) a significant difference between Location 1 at time 1 and Location 2 at time 1.
B) an interaction between location and time.
C) a significant post hoc analysis.
D) a quadratic significant correlation.
Question
Question
Question
Calculate and interpret F for each effect based on the following data.
Question
Question
Calculate and explain ω 2 for treatment group from the previous problem.
Question
What value appears in each identified cell in the following table?
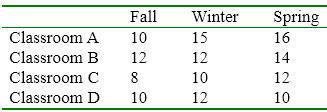
a. X11
b. X23
c. X41
a. X11
b. X23
c. X41
Question
Question
A doctor examining the effectiveness of smoking cessation programs wanted to examine the independent and joint effect of a support group and the patch. The following data are the average number of packs smoked 2 weeks after the interventions. Each group consisted of 10 people. Answer the following questions based on this table of means.
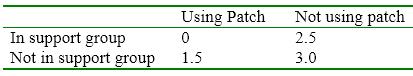
a. What is the grand mean?
b. Calculate the mean packs smoked at each level of support group.
c. Calculate the mean packs smokes at each level of the patch.
a. What is the grand mean?
b. Calculate the mean packs smoked at each level of support group.
c. Calculate the mean packs smokes at each level of the patch.
Question
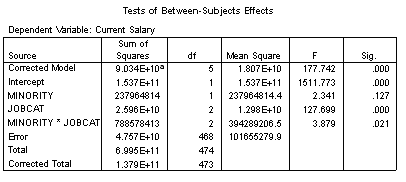
A human resources director for a large company wanted to compare salaries based on minority status and the type of job. Answer the following questions based on the following SPSS output.
Calculate and explain η2 for the significant effects from the previous data.
Calculate and explain η2 for the significant effects from the previous data.
Question
Plot the data from the previous question three times (each main effect and the interaction effect); interpret the graphs.
Question
Determine whether each of the following effects is statistically significant at α = .05.
Question
Question
A human resources director for a large company wanted to compare salaries based on minority status and the type of job. Answer the following questions based on the following SPSS output.
a. How many levels are there for each factor?
b. Which effects are statistically significant?
a. How many levels are there for each factor?
b. Which effects are statistically significant?
Question
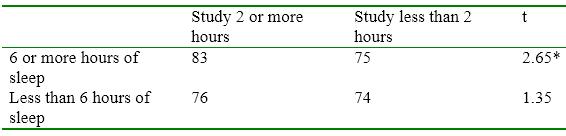
A researcher noted that there was a significant interaction effect of amount of time studying and hours of sleep the night before an exam on exam scores. He calculated simple effects to try to interpret the data. Here are the results. Graph them and explain the nature of the interaction.

Unlock Deck
Sign up to unlock the cards in this deck!
Unlock Deck
Unlock Deck
1/74
Play
Full screen (f)
Deck 17: Factorial Analysis of Variance
1
A simple effect is defined as
A) part of the interaction.
B) the effect of one variable taken by itself.
C) the effect of one variable at a single level of the other variable.
D) the difference between the row effect and the column effect.
A) part of the interaction.
B) the effect of one variable taken by itself.
C) the effect of one variable at a single level of the other variable.
D) the difference between the row effect and the column effect.
the effect of one variable at a single level of the other variable.
2
To look at an interaction effect we must
A) consider one variable at a time.
B) plot the data within each cell.
C) plot the data in such a way that we see how each independent variable changes at each level of the other independent variable.
D) calculate the row means.
A) consider one variable at a time.
B) plot the data within each cell.
C) plot the data in such a way that we see how each independent variable changes at each level of the other independent variable.
D) calculate the row means.
plot the data in such a way that we see how each independent variable changes at each level of the other independent variable.
3
Use the following ANOVA summary table to answer the following four questions:
How many cells are there in this design?
A) 1
B) 4
C) 8
D) 10
How many cells are there in this design?
A) 1
B) 4
C) 8
D) 10
10
4
The main effect of a variable is
A) the effect of that variable controlling for another variable.
B) the effect of that variable averaged over the levels of other independent variable(s).
C) part of the interaction effect.
D) none of the above
A) the effect of that variable controlling for another variable.
B) the effect of that variable averaged over the levels of other independent variable(s).
C) part of the interaction effect.
D) none of the above
Unlock Deck
Unlock for access to all 74 flashcards in this deck.
Unlock Deck
k this deck
5
Use the following research scenario to answer the next four questions:
A researcher was interested in the effects of 1) alcohol consumption and 2) content of a videotape, on how likely one is to support rape myths. The researcher randomly assigned 60 college-aged males to one of the following three groups: no alcohol consumed, a moderated amount of alcohol consumed, and a large amount of alcohol consumed. Additionally, half of the participants were shown the educational video on rape myths. The other half of the participants watched a documentary on owls (a control condition). At the end of the study all the participants filled out a survey on rape myth acceptance. Higher scores on the survey indicated higher acceptance of rape myths.
The results indicated that the participants who watched the educational video scored significantly lower on the rape myth scale compared to the group that watched the owl video. What does this suggest?
A) There is a main effect of alcohol consumption.
B) There is a main effect of video type.
C) There is an interaction between alcohol consumption and video type.
D) For some unknown reason, owls seem to promote rape myth acceptance.
Unlock Deck
Unlock for access to all 74 flashcards in this deck.
Unlock Deck
k this deck
6
Which of the following is not an advantage of factorial designs over one-way designs?
A) They allow for greater generalizability.
B) They allow us to test an interaction.
C) They make it easier to deal with unequal sample sizes.
D) They give us greater economy.
A) They allow for greater generalizability.
B) They allow us to test an interaction.
C) They make it easier to deal with unequal sample sizes.
D) They give us greater economy.
Unlock Deck
Unlock for access to all 74 flashcards in this deck.
Unlock Deck
k this deck
7
If the analysis of variance is significant, we are pretty sure that
A) we have an important finding.
B) at least one mean is different from one or more other means.
C) the means don't differ from each other.
D) we screwed up somewhere.
A) we have an important finding.
B) at least one mean is different from one or more other means.
C) the means don't differ from each other.
D) we screwed up somewhere.
Unlock Deck
Unlock for access to all 74 flashcards in this deck.
Unlock Deck
k this deck
8
In a factorial design a cell is
A) the combination of a row and a column.
B) the smallest number of subjects who were treated alike.
C) another name for a simple effect.
D) both a and b
A) the combination of a row and a column.
B) the smallest number of subjects who were treated alike.
C) another name for a simple effect.
D) both a and b
Unlock Deck
Unlock for access to all 74 flashcards in this deck.
Unlock Deck
k this deck
9
The notation ... stands for
A) the mean of any row.
B) the mean of any column.
C) the mean of any cell.
D) the grand mean.
... stands forA) the mean of any row.
B) the mean of any column.
C) the mean of any cell.
D) the grand mean.
Unlock Deck
Unlock for access to all 74 flashcards in this deck.
Unlock Deck
k this deck
10
The difference between a one-way analysis of variance and a factorial analysis of variance is
A) the presence of an interaction.
B) the presence of more than one main effect.
C) one-way analyses of variance have an error term, whereas factorial analyses do not.
D) both a and b
A) the presence of an interaction.
B) the presence of more than one main effect.
C) one-way analyses of variance have an error term, whereas factorial analyses do not.
D) both a and b
Unlock Deck
Unlock for access to all 74 flashcards in this deck.
Unlock Deck
k this deck
11
A 2 × 4 factorial has
A) 8 subjects.
B) 2 levels of one variable and 4 levels of the other.
C) 8 factors.
D) one variable with 4 levels and 2 subjects.
A) 8 subjects.
B) 2 levels of one variable and 4 levels of the other.
C) 8 factors.
D) one variable with 4 levels and 2 subjects.
Unlock Deck
Unlock for access to all 74 flashcards in this deck.
Unlock Deck
k this deck
12
Use the following research scenario to answer the next four questions:
A researcher was interested in the effects of 1) alcohol consumption and 2) content of a videotape, on how likely one is to support rape myths. The researcher randomly assigned 60 college-aged males to one of the following three groups: no alcohol consumed, a moderated amount of alcohol consumed, and a large amount of alcohol consumed. Additionally, half of the participants were shown the educational video on rape myths. The other half of the participants watched a documentary on owls (a control condition). At the end of the study all the participants filled out a survey on rape myth acceptance. Higher scores on the survey indicated higher acceptance of rape myths.
How many cells does this experiment have?
A) 2
B) 5
C) 6
D) 12
Unlock Deck
Unlock for access to all 74 flashcards in this deck.
Unlock Deck
k this deck
13
Use the following ANOVA summary table to answer the following four questions:
What does the significant F for Group most likely mean?
A) All the groups are different from each other.
B) None of the groups are different from each other.
C) The study has problems with control.
D) There is at least one significant difference among the groups.
What does the significant F for Group most likely mean?
A) All the groups are different from each other.
B) None of the groups are different from each other.
C) The study has problems with control.
D) There is at least one significant difference among the groups.
Unlock Deck
Unlock for access to all 74 flashcards in this deck.
Unlock Deck
k this deck
14
Use the following research scenario to answer the next four questions:
A researcher was interested in the effects of 1) alcohol consumption and 2) content of a videotape, on how likely one is to support rape myths. The researcher randomly assigned 60 college-aged males to one of the following three groups: no alcohol consumed, a moderated amount of alcohol consumed, and a large amount of alcohol consumed. Additionally, half of the participants were shown the educational video on rape myths. The other half of the participants watched a documentary on owls (a control condition). At the end of the study all the participants filled out a survey on rape myth acceptance. Higher scores on the survey indicated higher acceptance of rape myths.
What type of statistical analysis would be most appropriate for this experiment?
A) a t -test
B) a regression
C) a one-way analysis of variance
D) a factorial analysis of variance
Unlock Deck
Unlock for access to all 74 flashcards in this deck.
Unlock Deck
k this deck
15
A factorial analysis of variance has
A) more than one dependent variable.
B) more than one independent variable.
C) every level of every independent variable paired with every level of every other independent variable.
D) both b and c
A) more than one dependent variable.
B) more than one independent variable.
C) every level of every independent variable paired with every level of every other independent variable.
D) both b and c
Unlock Deck
Unlock for access to all 74 flashcards in this deck.
Unlock Deck
k this deck
16
In the text the Eysenck study of recall as a function of Age and Instructions allowed us to see that
A) older subjects don't recall as well as earlier subjects, on average.
B) older and younger subjects differ more on tasks which involve greater depth of processing.
C) greater processing tends to lead to better recall.
D) all of the above
A) older subjects don't recall as well as earlier subjects, on average.
B) older and younger subjects differ more on tasks which involve greater depth of processing.
C) greater processing tends to lead to better recall.
D) all of the above
Unlock Deck
Unlock for access to all 74 flashcards in this deck.
Unlock Deck
k this deck
17
Use the following ANOVA summary table to answer the following four questions:
Why does Group have 4 degrees of freedom?
A) because there are 4 groups
B) because there are 5 groups (5 - 1 = 4)
C) because gender has 1 df (1 × 4 = 4)
D) because the design has four cells
Why does Group have 4 degrees of freedom?
A) because there are 4 groups
B) because there are 5 groups (5 - 1 = 4)
C) because gender has 1 df (1 × 4 = 4)
D) because the design has four cells
Unlock Deck
Unlock for access to all 74 flashcards in this deck.
Unlock Deck
k this deck
18
Use the following research scenario to answer the next four questions:
A researcher was interested in the effects of 1) alcohol consumption and 2) content of a videotape, on how likely one is to support rape myths. The researcher randomly assigned 60 college-aged males to one of the following three groups: no alcohol consumed, a moderated amount of alcohol consumed, and a large amount of alcohol consumed. Additionally, half of the participants were shown the educational video on rape myths. The other half of the participants watched a documentary on owls (a control condition). At the end of the study all the participants filled out a survey on rape myth acceptance. Higher scores on the survey indicated higher acceptance of rape myths.
What would you suggest if the researcher found that alcohol consumption increased rape myth acceptance, but only when the participants had watched the owl video?
A) There is an interaction between alcohol consumption and video type.
B) There is a main effect of alcohol consumption.
C) There is a simple effect of alcohol in the educational video condition.
D) There is a main effect of the video condition.
Unlock Deck
Unlock for access to all 74 flashcards in this deck.
Unlock Deck
k this deck
19
To calculate the sum of squares for a treatment effect in the analysis of variance, we would work with
A) the squares of the differences between the treatment means and the grand mean.
B) the variance within the treatments.
C) the number of samples.
D) both a and b
A) the squares of the differences between the treatment means and the grand mean.
B) the variance within the treatments.
C) the number of samples.
D) both a and b
Unlock Deck
Unlock for access to all 74 flashcards in this deck.
Unlock Deck
k this deck
20
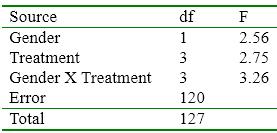
Use the following ANOVA summary table to answer the following four questions:
The summary table suggests which of the following conclusions?
A) a main effect of gender
B) a main effect of group
C) an interaction of gender × group
D) all of the above
The summary table suggests which of the following conclusions?
A) a main effect of gender
B) a main effect of group
C) an interaction of gender × group
D) all of the above
Unlock Deck
Unlock for access to all 74 flashcards in this deck.
Unlock Deck
k this deck
21
In the factorial design analyses discussed in Chapter 17, the different cells
A) often have different subjects in them.
B) never have different subjects in them.
C) always have different subjects.
D) can have either the same subjects or different subjects.
A) often have different subjects in them.
B) never have different subjects in them.
C) always have different subjects.
D) can have either the same subjects or different subjects.
Unlock Deck
Unlock for access to all 74 flashcards in this deck.
Unlock Deck
k this deck
22
To calculate the magnitude of effect estimates for a factorial design, the methods are
A) radically different from the methods used with a one-way design.
B) simple extensions of the methods used with a one-way design.
C) not possible to calculate.
D) only useful for estimating magnitude of effects for interactions, not main efforts.
A) radically different from the methods used with a one-way design.
B) simple extensions of the methods used with a one-way design.
C) not possible to calculate.
D) only useful for estimating magnitude of effects for interactions, not main efforts.
Unlock Deck
Unlock for access to all 74 flashcards in this deck.
Unlock Deck
k this deck
23
Which of the following is NOT true in a factorial analysis of variance?
A) SS total = SS A + SS B + SS AB
B) SS total = SS A + SS B + SS AB + SS error
C) SS cells = SS A + SS B + SS AB
D) SS total = SS cells + SS error
A) SS total = SS A + SS B + SS AB
B) SS total = SS A + SS B + SS AB + SS error
C) SS cells = SS A + SS B + SS AB
D) SS total = SS cells + SS error
Unlock Deck
Unlock for access to all 74 flashcards in this deck.
Unlock Deck
k this deck
24
In the three graphs below, which one is most likely to have a main effect for quarters (the variable that increases along the X axis)?
A) I
B) II
C) III
D) none.
A) I
B) II
C) III
D) none.
Unlock Deck
Unlock for access to all 74 flashcards in this deck.
Unlock Deck
k this deck
25
Which of the following graphs is most likely to portray an interaction?
A) I
B) II
C) III
D) There is no interaction in any of these.
A) I
B) II
C) III
D) There is no interaction in any of these.
Unlock Deck
Unlock for access to all 74 flashcards in this deck.
Unlock Deck
k this deck
26
To calculate the F for the interaction in an analysis of variance we
A) divide the MS interaction by MS error.
B) divide the MS interaction by MS total.
C) multiply MS ¬interaction by its df .
D) divide MS interaction into MS rows.
A) divide the MS interaction by MS error.
B) divide the MS interaction by MS total.
C) multiply MS ¬interaction by its df .
D) divide MS interaction into MS rows.
Unlock Deck
Unlock for access to all 74 flashcards in this deck.
Unlock Deck
k this deck
27
If ω2 is calculated to yield the magnitude of effect estimates instead of η2 for a particular experiment, the ω2 estimates would probably be
A) higher and more biased.
B) higher and less biased.
C) lower and more biased.
D) lower and less biased.
A) higher and more biased.
B) higher and less biased.
C) lower and more biased.
D) lower and less biased.
Unlock Deck
Unlock for access to all 74 flashcards in this deck.
Unlock Deck
k this deck
28
A pediatrician is studying weight gain in infants. He divides them into 2 groups: breast fed and bottle fed. Further, he divides them into those whose mothers feed them on a timed schedule, and those whose mothers feed them when they cry (on demand). Weight gain is the dependent measure. What type of analysis should you run?
A) a regression
B) a one-way ANOVA
C) a 2 × 2 factorial ANOVA
D) a 2 × 2 correlation
A) a regression
B) a one-way ANOVA
C) a 2 × 2 factorial ANOVA
D) a 2 × 2 correlation
Unlock Deck
Unlock for access to all 74 flashcards in this deck.
Unlock Deck
k this deck
29
Unequal sample sizes in a factorial analysis of variance are
A) no problem.
B) often difficult to interpret.
C) impossible to interpret.
D) easily explained by the use of simple effects.
A) no problem.
B) often difficult to interpret.
C) impossible to interpret.
D) easily explained by the use of simple effects.
Unlock Deck
Unlock for access to all 74 flashcards in this deck.
Unlock Deck
k this deck
30
_______ are the effect of one variable at one level of the other variable.
A) simple effects
B) main effects
C) interactions
D) relationships
A) simple effects
B) main effects
C) interactions
D) relationships
Unlock Deck
Unlock for access to all 74 flashcards in this deck.
Unlock Deck
k this deck
31
The following is a printout from SPSS.
From this table, which of the following conclusions would be wrong?
A) There is a significant effect for Groups.
B) There is a significant effect for Education.
C) The interaction is significant.
D) Both main effects are significant.
From this table, which of the following conclusions would be wrong?
A) There is a significant effect for Groups.
B) There is a significant effect for Education.
C) The interaction is significant.
D) Both main effects are significant.
Unlock Deck
Unlock for access to all 74 flashcards in this deck.
Unlock Deck
k this deck
32
To calculate the F for a simple effect you
A) often use the same error term you use for main effects.
B) use the mean square for the main effect as the denominator in F .
C) first divide the mean square for the simple effect by its degrees of freedom.
D) none of the above
A) often use the same error term you use for main effects.
B) use the mean square for the main effect as the denominator in F .
C) first divide the mean square for the simple effect by its degrees of freedom.
D) none of the above
Unlock Deck
Unlock for access to all 74 flashcards in this deck.
Unlock Deck
k this deck
33
Unequal sample sizes in a factorial analysis of variance
A) are difficult to deal with when doing calculations by hand.
B) are treated exactly as they were in the one-way design.
C) cannot be dealt with at all.
D) are dealt with just like equal sample sizes when doing hand calculations.
A) are difficult to deal with when doing calculations by hand.
B) are treated exactly as they were in the one-way design.
C) cannot be dealt with at all.
D) are dealt with just like equal sample sizes when doing hand calculations.
Unlock Deck
Unlock for access to all 74 flashcards in this deck.
Unlock Deck
k this deck
34
If you have a significant interaction,
A) at least one of the main effects will be nonsignificant.
B) both of the main effects will be nonsignificant.
C) at least one simple effect is likely, though not certain, to be significant.
D) the interaction doesn't suggest anything about simple effects.
A) at least one of the main effects will be nonsignificant.
B) both of the main effects will be nonsignificant.
C) at least one simple effect is likely, though not certain, to be significant.
D) the interaction doesn't suggest anything about simple effects.
Unlock Deck
Unlock for access to all 74 flashcards in this deck.
Unlock Deck
k this deck
35
In a study which investigated the effects of amount of coffee consumption and mood (good or bad) on driving speed, the magnitude of effects estimates were as follows: Coffee:
; Mood:
; Coffee × Mood:
. Together, how much of the variability in driving speed is accounted for by Coffee, Mood, and their interaction?
A) cannot determine
B) .49
C) .51
D) .19
; Mood: ; Coffee × Mood: . Together, how much of the variability in driving speed is accounted for by Coffee, Mood, and their interaction?A) cannot determine
B) .49
C) .51
D) .19
Unlock Deck
Unlock for access to all 74 flashcards in this deck.
Unlock Deck
k this deck
36
If you have a significant interaction, you should
A) think carefully about any main effects you might have.
B) ignore any main effects you might have.
C) ignore the interaction unless there is a main effect.
D) none of the above
A) think carefully about any main effects you might have.
B) ignore any main effects you might have.
C) ignore the interaction unless there is a main effect.
D) none of the above
Unlock Deck
Unlock for access to all 74 flashcards in this deck.
Unlock Deck
k this deck
37
A simple effect is calculated by
A) looking only at the data for one level of one of the independent variables.
B) averaging across the levels of one of the independent variables.
C) ignoring one of the independent variables.
D) dividing the main effect by the degrees of freedom.
A) looking only at the data for one level of one of the independent variables.
B) averaging across the levels of one of the independent variables.
C) ignoring one of the independent variables.
D) dividing the main effect by the degrees of freedom.
Unlock Deck
Unlock for access to all 74 flashcards in this deck.
Unlock Deck
k this deck
38
In a factorial analysis of variance you cannot have
A) both a significant interaction and a significant main effect.
B) two significant main effects.
C) a significant main effect and a nonsignificant interaction.
D) Any combination is possible.
A) both a significant interaction and a significant main effect.
B) two significant main effects.
C) a significant main effect and a nonsignificant interaction.
D) Any combination is possible.
Unlock Deck
Unlock for access to all 74 flashcards in this deck.
Unlock Deck
k this deck
39
The degrees of freedom for an interaction in a two-way factorial are equal to
A) the degrees of freedom for the main effects.
B) the sum of the degrees of freedom for the main effects.
C) the product of the degrees of freedom for the main effects.
D) 6.
A) the degrees of freedom for the main effects.
B) the sum of the degrees of freedom for the main effects.
C) the product of the degrees of freedom for the main effects.
D) 6.
Unlock Deck
Unlock for access to all 74 flashcards in this deck.
Unlock Deck
k this deck
40
In graph I below, the most apparent simple effect is for the line represented by
A) diamonds.
B) squares.
C) triangles.
D) It is unlikely for there to be a simple effect for any level of the independent variable.
A) diamonds.
B) squares.
C) triangles.
D) It is unlikely for there to be a simple effect for any level of the independent variable.
Unlock Deck
Unlock for access to all 74 flashcards in this deck.
Unlock Deck
k this deck
41
Dr. Gates looked at the effects of frustration on the use of profanity by males and females. Males and females were asked to write a lab report on computers in a lab, but half the computers were set up to crash during the session while half of the computers were not set up to crash. Three observers recorded the use of profanity by the participants during the task. What is the design of this study?
A) 2 × 2 factorial
B) 1 × 2 factorial
C) 2 × 2 × 3 factorial
D) 2 × 2 correlational
A) 2 × 2 factorial
B) 1 × 2 factorial
C) 2 × 2 × 3 factorial
D) 2 × 2 correlational
Unlock Deck
Unlock for access to all 74 flashcards in this deck.
Unlock Deck
k this deck
42
A factorial design has at least
A) one dependent variable and one independent variable.
B) two dependent variables and one independent variable.
C) two independent variables and one dependent variable.
D) The number of independent variables is not important.
A) one dependent variable and one independent variable.
B) two dependent variables and one independent variable.
C) two independent variables and one dependent variable.
D) The number of independent variables is not important.
Unlock Deck
Unlock for access to all 74 flashcards in this deck.
Unlock Deck
k this deck
43
The mean difference in GPA based on gender and year in school is a main effect.
Unlock Deck
Unlock for access to all 74 flashcards in this deck.
Unlock Deck
k this deck
44
To calculate the F for a simple effect you
A) use the mean square for the main effect as the denominator in F .
B) first divide the mean square for the simple effect by its degrees of freedom.
C) use the same error term you use for main effects.
D) none of the above
A) use the mean square for the main effect as the denominator in F .
B) first divide the mean square for the simple effect by its degrees of freedom.
C) use the same error term you use for main effects.
D) none of the above
Unlock Deck
Unlock for access to all 74 flashcards in this deck.
Unlock Deck
k this deck
45
When comparing differences in an experiment with two or more independent variables we should use a(n)
A) one way ANOVA.
B) paired sample t-test.
C) R squared comparison.
D) factorial design.
A) one way ANOVA.
B) paired sample t-test.
C) R squared comparison.
D) factorial design.
Unlock Deck
Unlock for access to all 74 flashcards in this deck.
Unlock Deck
k this deck
46
What type of design is the above study?
A) 2 × 2 × 2
B) 2 × 2
C) 2 × 3
D) 3 × 3 × 3
A) 2 × 2 × 2
B) 2 × 2
C) 2 × 3
D) 3 × 3 × 3
Unlock Deck
Unlock for access to all 74 flashcards in this deck.
Unlock Deck
k this deck
47
When you compare the effect of one variable at one level of another variable you are examining
A) a main effect
B) a simple effect
C) a correlational effect
D) both a and c
A) a main effect
B) a simple effect
C) a correlational effect
D) both a and c
Unlock Deck
Unlock for access to all 74 flashcards in this deck.
Unlock Deck
k this deck
48
This graph represents a/an
A) repeated-measures design
B) one-way ANOVA
C) 2 × 5 factorial
D) significant alpha
A) repeated-measures design
B) one-way ANOVA
C) 2 × 5 factorial
D) significant alpha
Unlock Deck
Unlock for access to all 74 flashcards in this deck.
Unlock Deck
k this deck
49
The finding that women eat less in the company of men then when they are in the company of other women is a(n)
A) simple effect.
B) interaction.
C) factorial effect.
D) main effect.
A) simple effect.
B) interaction.
C) factorial effect.
D) main effect.
Unlock Deck
Unlock for access to all 74 flashcards in this deck.
Unlock Deck
k this deck
50
Pliner and Chaiken (1990) wanted to investigate whether the amount of food eaten depended on the gender of the participant and the gender of the confederate. It was observed that women eat less than men overall and that women eat less in the company of men than they do when in the company of other women. The finding that women eat less than men across all conditions is a(n)
A) simple effect.
B) interaction.
C) factorial effect.
D) main effect.
A) simple effect.
B) interaction.
C) factorial effect.
D) main effect.
Unlock Deck
Unlock for access to all 74 flashcards in this deck.
Unlock Deck
k this deck
51
The mean difference in GPA based on gender is an interaction effect.
Unlock Deck
Unlock for access to all 74 flashcards in this deck.
Unlock Deck
k this deck
52
The overall effect of an independent variable is called a(n)
A) main effect.
B) simple effect.
C) interaction.
D) manipulation.
A) main effect.
B) simple effect.
C) interaction.
D) manipulation.
Unlock Deck
Unlock for access to all 74 flashcards in this deck.
Unlock Deck
k this deck
53
A 2 × 4 factorial involves two independent variables. One has two levels and the other has four.
Unlock Deck
Unlock for access to all 74 flashcards in this deck.
Unlock Deck
k this deck
54
Using the example in the text of a participant receiving therapy while sitting in a bath of ice water, what would be the best denominator for calculating ?
A) the square root of MSerror
B) the square root of MSerror after removing effects due to the Ice condition and its interaction with treatment
C) the standard deviation of participants in the non-ice condition
D) the standard deviation of difference scores
?A) the square root of MSerror
B) the square root of MSerror after removing effects due to the Ice condition and its interaction with treatment
C) the standard deviation of participants in the non-ice condition
D) the standard deviation of difference scores
Unlock Deck
Unlock for access to all 74 flashcards in this deck.
Unlock Deck
k this deck
55
In the Spilich et al. study of the effects of smoking that was discussed in the text, active smokers were found to do better than nonsmokers on a driving task but did worse than nonsmokers on a cognitive task. However, over all three tasks (the third was pattern recognition and the groups were not different on that) active smokers did not differ from nonsmokers on performance. The results suggest
A) an interaction between smoke group and task, and a main effect for smoke group.
B) an interaction between smoke group and task, but no main effect for smoke group.
C) a main effect for smoke group, but no interaction between smoke group and task.
D) a main effect for task only.
A) an interaction between smoke group and task, and a main effect for smoke group.
B) an interaction between smoke group and task, but no main effect for smoke group.
C) a main effect for smoke group, but no interaction between smoke group and task.
D) a main effect for task only.
Unlock Deck
Unlock for access to all 74 flashcards in this deck.
Unlock Deck
k this deck
56
When we compute an effect size measure such as
for a factorial ANOVA we have to decide
A) what effects should be included in estimating the denominator.
B) what are our variables of theoretical interest.
C) whether we want an r -family measure or a d -family measure.
D) all of the above
for a factorial ANOVA we have to decideA) what effects should be included in estimating the denominator.
B) what are our variables of theoretical interest.
C) whether we want an r -family measure or a d -family measure.
D) all of the above
Unlock Deck
Unlock for access to all 74 flashcards in this deck.
Unlock Deck
k this deck
57
In a factorial design involving the sex of the participant and the sex of the experimenter's confederate
A) there were multiple subjects in each cell of the design.
B) there were different subjects in each cell of the design.
C) all possible combinations of sex of subject and sex of confederate were represented.
D) all of the above
A) there were multiple subjects in each cell of the design.
B) there were different subjects in each cell of the design.
C) all possible combinations of sex of subject and sex of confederate were represented.
D) all of the above
Unlock Deck
Unlock for access to all 74 flashcards in this deck.
Unlock Deck
k this deck
58
When we say that a measure is "not of theoretical interest" we mean that
A) variability attributable to it should be removed from the denominator.
B) we can simply ignore that variable.
C) variability attributable to it should be included in the denominator.
D) there is no significant effect for that variable.
A) variability attributable to it should be removed from the denominator.
B) we can simply ignore that variable.
C) variability attributable to it should be included in the denominator.
D) there is no significant effect for that variable.
Unlock Deck
Unlock for access to all 74 flashcards in this deck.
Unlock Deck
k this deck
59
A factorial analysis of variance involves more than one dependent variable.
Unlock Deck
Unlock for access to all 74 flashcards in this deck.
Unlock Deck
k this deck
60
In this graph we can see that there is
A) a significant difference between Location 1 at time 1 and Location 2 at time 1.
B) an interaction between location and time.
C) a significant post hoc analysis.
D) a quadratic significant correlation.
A) a significant difference between Location 1 at time 1 and Location 2 at time 1.
B) an interaction between location and time.
C) a significant post hoc analysis.
D) a quadratic significant correlation.
Unlock Deck
Unlock for access to all 74 flashcards in this deck.
Unlock Deck
k this deck
61
In analysis of variance, factor refers to independent variables.
Unlock Deck
Unlock for access to all 74 flashcards in this deck.
Unlock Deck
k this deck
62
The mean difference in GPA based on Gender for Freshman only is a simple effect.
Unlock Deck
Unlock for access to all 74 flashcards in this deck.
Unlock Deck
k this deck
63
Calculate and interpret F for each effect based on the following data.
Unlock Deck
Unlock for access to all 74 flashcards in this deck.
Unlock Deck
k this deck
64
Three main effects and three interactions are tested in a factorial design with three independent variables.
Unlock Deck
Unlock for access to all 74 flashcards in this deck.
Unlock Deck
k this deck
65
Calculate and explain ω 2 for treatment group from the previous problem.
Unlock Deck
Unlock for access to all 74 flashcards in this deck.
Unlock Deck
k this deck
66
What value appears in each identified cell in the following table?
a. X11
b. X23
c. X41
a. X11
b. X23
c. X41
Unlock Deck
Unlock for access to all 74 flashcards in this deck.
Unlock Deck
k this deck
67
In a factorial design based on two independent variables, three F values will be calculated.
Unlock Deck
Unlock for access to all 74 flashcards in this deck.
Unlock Deck
k this deck
68
A doctor examining the effectiveness of smoking cessation programs wanted to examine the independent and joint effect of a support group and the patch. The following data are the average number of packs smoked 2 weeks after the interventions. Each group consisted of 10 people. Answer the following questions based on this table of means.
a. What is the grand mean?
b. Calculate the mean packs smoked at each level of support group.
c. Calculate the mean packs smokes at each level of the patch.
a. What is the grand mean?
b. Calculate the mean packs smoked at each level of support group.
c. Calculate the mean packs smokes at each level of the patch.
Unlock Deck
Unlock for access to all 74 flashcards in this deck.
Unlock Deck
k this deck
69
A human resources director for a large company wanted to compare salaries based on minority status and the type of job. Answer the following questions based on the following SPSS output.
Calculate and explain η2 for the significant effects from the previous data.
Calculate and explain η2 for the significant effects from the previous data.
Unlock Deck
Unlock for access to all 74 flashcards in this deck.
Unlock Deck
k this deck
70
Plot the data from the previous question three times (each main effect and the interaction effect); interpret the graphs.
Unlock Deck
Unlock for access to all 74 flashcards in this deck.
Unlock Deck
k this deck
71
Determine whether each of the following effects is statistically significant at α = .05.
Unlock Deck
Unlock for access to all 74 flashcards in this deck.
Unlock Deck
k this deck
72
X13 refers to the value located in the first row and the third column.
Unlock Deck
Unlock for access to all 74 flashcards in this deck.
Unlock Deck
k this deck
73
A human resources director for a large company wanted to compare salaries based on minority status and the type of job. Answer the following questions based on the following SPSS output.
a. How many levels are there for each factor?
b. Which effects are statistically significant?
a. How many levels are there for each factor?
b. Which effects are statistically significant?
Unlock Deck
Unlock for access to all 74 flashcards in this deck.
Unlock Deck
k this deck
74
A researcher noted that there was a significant interaction effect of amount of time studying and hours of sleep the night before an exam on exam scores. He calculated simple effects to try to interpret the data. Here are the results. Graph them and explain the nature of the interaction.
Unlock Deck
Unlock for access to all 74 flashcards in this deck.
Unlock Deck
k this deck
Unlock Deck
Unlock for access to all 74 flashcards in this deck.


