Deck 9: Correlation
Full screen (f)
Question
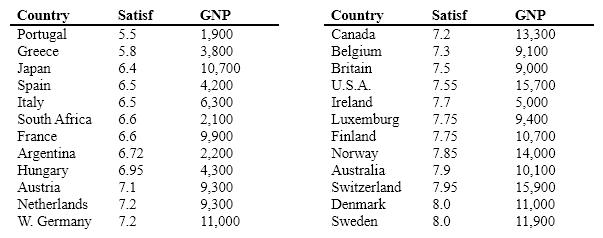
Inglehart (1990) presented data on the relationship between income (as represented by a country's Gross National Product), and reported Satisfaction With Life for 24 countries. These data speak to the issue of whether people in countries with a higher standard of living also report greater satisfaction. The data have been sorted by Satisfaction.
A) .00
B) .50
C) .90
D) -.50
A) .00
B) .50
C) .90
D) -.50
Question
Question
The data illustrated in the graph below suggest
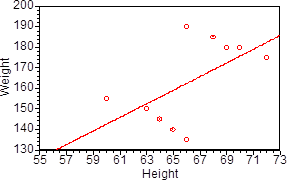
A) that there is a strong positive relationship between height and weight.
B) that there is no relationship between height and weight.
C) that some other variable is involved in the relationship.
D) that these data are unreliable.
A) that there is a strong positive relationship between height and weight.
B) that there is no relationship between height and weight.
C) that some other variable is involved in the relationship.
D) that these data are unreliable.
Question
The following is a scatterplot of data that my students collected concerning the relationship between the cost of chocolate chip cookies and their rated quality. The correlation between the two variables is most likely to be
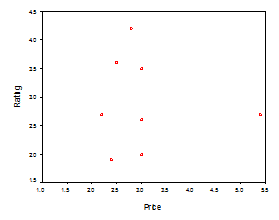
A) -.50
B) -.80
C) .80
D) .00
A) -.50
B) -.80
C) .80
D) .00
Question
Question
Question
Question
Question
Question
Question
Question
Question
Question
Question
Question
Question
Question
Question
Question
Question
Question
Question
Question
Question
Question
Which of the following is the formula for the covariance?
A)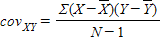
B)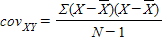
C)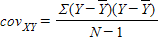
D)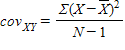
A)
B)
C)
D)
Question
The correlation in the population is denoted by
A) r
B)
C) R
D) f
A) r
B)
C) R
D) f
Question
Question
Question
Question
Question
Question
Question
Question
Question
Question
Question
Question
Question
Question
Question
Question
Question
Question
Question
Question
Question
Question
Question
Question
Question
Question
Question
Question
Question
Question
Question
Question
Question
Question
Question
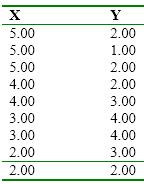
Calculate and interpret the correlation between the following variables.
Question
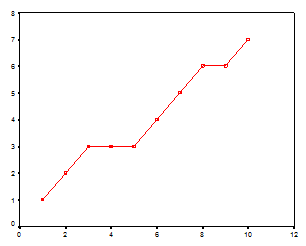
Describe the following graph.
Question
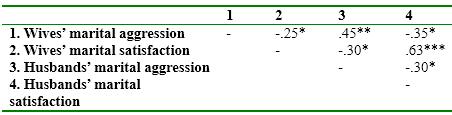
Write a brief paragraph to summarize the data displayed in the following table.
Question
Question
Question
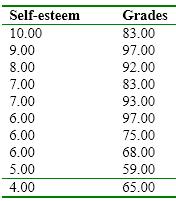
Calculate the correlation coefficient for the previous data. Is it significant? Write a brief statement to explain the results.
Question
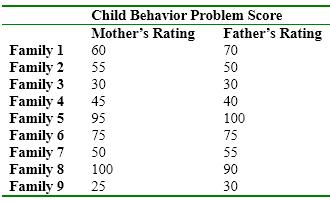
Given the following pairs of data for mothers' and fathers' ratings of their child's behavior problems, what type of correlation would you expect? Explain your answer.
Question
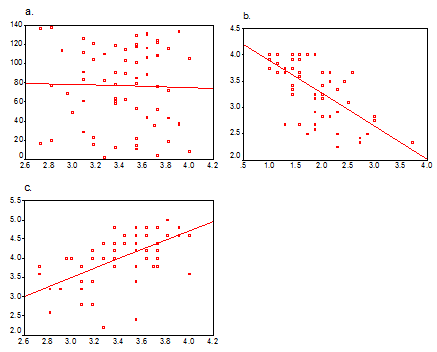
Indicate the types of relationships illustrated in the following graphs. (e.g., positive, negative, no relationship, curvilinear).
Question
Make a scatterplot of the following data and draw a line of best fit.
Question

Unlock Deck
Sign up to unlock the cards in this deck!
Unlock Deck
Unlock Deck
1/71
Play
Full screen (f)
Deck 9: Correlation
1
Inglehart (1990) presented data on the relationship between income (as represented by a country's Gross National Product), and reported Satisfaction With Life for 24 countries. These data speak to the issue of whether people in countries with a higher standard of living also report greater satisfaction. The data have been sorted by Satisfaction.
A) .00
B) .50
C) .90
D) -.50
A) .00
B) .50
C) .90
D) -.50
.50
2
A curvilinear relationship is one in which
A) one variable always increases as the other increases.
B) as X increases, Y will increase and then level off or fall.
C) as X increases, Y will decrease and then level off or rise.
D) both b and c
A) one variable always increases as the other increases.
B) as X increases, Y will increase and then level off or fall.
C) as X increases, Y will decrease and then level off or rise.
D) both b and c
both b and c
3
The data illustrated in the graph below suggest
A) that there is a strong positive relationship between height and weight.
B) that there is no relationship between height and weight.
C) that some other variable is involved in the relationship.
D) that these data are unreliable.
A) that there is a strong positive relationship between height and weight.
B) that there is no relationship between height and weight.
C) that some other variable is involved in the relationship.
D) that these data are unreliable.
that some other variable is involved in the relationship.
4
The following is a scatterplot of data that my students collected concerning the relationship between the cost of chocolate chip cookies and their rated quality. The correlation between the two variables is most likely to be
A) -.50
B) -.80
C) .80
D) .00
A) -.50
B) -.80
C) .80
D) .00
Unlock Deck
Unlock for access to all 71 flashcards in this deck.
Unlock Deck
k this deck
5
The correlation between two variables is a measure of the degree to which
A) points cluster together around some best-fitting straight line.
B) differences in one variable can be predicted from differences in the other variable.
C) one variable varies with the other variable.
D) all of the above
A) points cluster together around some best-fitting straight line.
B) differences in one variable can be predicted from differences in the other variable.
C) one variable varies with the other variable.
D) all of the above
Unlock Deck
Unlock for access to all 71 flashcards in this deck.
Unlock Deck
k this deck
6
In plotting the relationship between the incidence of breast cancer and the level of vitamin D in the body, we would most likely plot
A) vitamin D on the Y axis and incidence of breast cancer on the X axis.
B) average daily sunlight on the Y axis and the incidence of breast cancer on the X axis.
C) vitamin D on the X axis and incidence of breast cancer on the Y axis.
D) The three answers above are equally good.
A) vitamin D on the Y axis and incidence of breast cancer on the X axis.
B) average daily sunlight on the Y axis and the incidence of breast cancer on the X axis.
C) vitamin D on the X axis and incidence of breast cancer on the Y axis.
D) The three answers above are equally good.
Unlock Deck
Unlock for access to all 71 flashcards in this deck.
Unlock Deck
k this deck
7
In the previous question, a "best-fitting" line drawn through the data points would most likely go
A) straight across the page.
B) straight down the page.
C) from upper left to lower right.
D) from lower left to upper right.
A) straight across the page.
B) straight down the page.
C) from upper left to lower right.
D) from lower left to upper right.
Unlock Deck
Unlock for access to all 71 flashcards in this deck.
Unlock Deck
k this deck
8
If the correlation between the rating of cookie quality and cookie price is .30, and the critical value from the table of significance of correlation coefficients is .35, we would say that
A) the correlation is not significant.
B) the correlation is significant.
C) the difference is too close to call.
D) we don't have any way to come to a conclusion.
A) the correlation is not significant.
B) the correlation is significant.
C) the difference is too close to call.
D) we don't have any way to come to a conclusion.
Unlock Deck
Unlock for access to all 71 flashcards in this deck.
Unlock Deck
k this deck
9
The example showing a negative relationship between speed and accuracy tells us that
A) the slowest responders are always the most accurate.
B) the fastest responders are always the most accurate.
C) on average, slower responders are more accurate than faster responders.
D) speed is a virtue.
A) the slowest responders are always the most accurate.
B) the fastest responders are always the most accurate.
C) on average, slower responders are more accurate than faster responders.
D) speed is a virtue.
Unlock Deck
Unlock for access to all 71 flashcards in this deck.
Unlock Deck
k this deck
10
Early in the correlation chapter the author showed figures in which he drew vertical and horizontal lines at the mean of each variable to cut the graph into four quadrants. When there is a high positive correlation between two variables, we would expect most of the data points to fall
A) to the right of vertical line.
B) in the upper right and lower left quadrants.
C) below the horizontal line.
D) equally in all four quadrants.
A) to the right of vertical line.
B) in the upper right and lower left quadrants.
C) below the horizontal line.
D) equally in all four quadrants.
Unlock Deck
Unlock for access to all 71 flashcards in this deck.
Unlock Deck
k this deck
11
When we restrict the range of X or Y , we may
A) lower the correlation from what it would otherwise be.
B) raise the correlation from what it might be.
C) leave the correlation the same as it would otherwise be.
D) All of the above are possible.
A) lower the correlation from what it would otherwise be.
B) raise the correlation from what it might be.
C) leave the correlation the same as it would otherwise be.
D) All of the above are possible.
Unlock Deck
Unlock for access to all 71 flashcards in this deck.
Unlock Deck
k this deck
12
Which of the following represents a closer relationship between two variables?
A) r = .00
B) r = .50
C) r = -.30
D) r = -.65
A) r = .00
B) r = .50
C) r = -.30
D) r = -.65
Unlock Deck
Unlock for access to all 71 flashcards in this deck.
Unlock Deck
k this deck
13
The correlation between two variables is defined as
A) the covariance of those variables divided by the product of their standard deviations.
B) the covariance of those variables divided by the variance of X .
C) the covariance of those variables divided by the variance of Y .
D) the cross-product of all of the pairs of scores.
A) the covariance of those variables divided by the product of their standard deviations.
B) the covariance of those variables divided by the variance of X .
C) the covariance of those variables divided by the variance of Y .
D) the cross-product of all of the pairs of scores.
Unlock Deck
Unlock for access to all 71 flashcards in this deck.
Unlock Deck
k this deck
14
A dichotomous variable is one that
A) can take on any number of values.
B) can take on one of only three values.
C) can take on one of only two values.
D) can take on only one value.
A) can take on any number of values.
B) can take on one of only three values.
C) can take on one of only two values.
D) can take on only one value.
Unlock Deck
Unlock for access to all 71 flashcards in this deck.
Unlock Deck
k this deck
15
A reliable correlation is one that
A) is significantly different from 0.
B) is likely to be closely approximated in a future study.
C) is close to 1.00.
D) is non-negative.
A) is significantly different from 0.
B) is likely to be closely approximated in a future study.
C) is close to 1.00.
D) is non-negative.
Unlock Deck
Unlock for access to all 71 flashcards in this deck.
Unlock Deck
k this deck
16
Spearman's correlation coefficient ( r S ) applies to
A) any data.
B) linear data.
C) data that have been converted to ranks.
D) only continuous data.
A) any data.
B) linear data.
C) data that have been converted to ranks.
D) only continuous data.
Unlock Deck
Unlock for access to all 71 flashcards in this deck.
Unlock Deck
k this deck
17
The difference between a point biserial coefficient and a normal Pearson correlation coefficient is that
A) a point biserial correlation is based on two continuous variables.
B) a point biserial correlation is based on one dichotomous variable and one continuous variable.
C) a point biserial correlation is based on two dichotomous variables.
D) the kind of variable has nothing to do with the issue.
A) a point biserial correlation is based on two continuous variables.
B) a point biserial correlation is based on one dichotomous variable and one continuous variable.
C) a point biserial correlation is based on two dichotomous variables.
D) the kind of variable has nothing to do with the issue.
Unlock Deck
Unlock for access to all 71 flashcards in this deck.
Unlock Deck
k this deck
18
When we say that the correlation between Age and test Performance is significant, we mean
A) there is an important relationship between Age and Performance.
B) the true correlation between Age and Performance in the population is equal to 0.
C) the true correlation between Age and Performance in the population is not equal to 0.
D) getting older causes you to do poorly on tests.
A) there is an important relationship between Age and Performance.
B) the true correlation between Age and Performance in the population is equal to 0.
C) the true correlation between Age and Performance in the population is not equal to 0.
D) getting older causes you to do poorly on tests.
Unlock Deck
Unlock for access to all 71 flashcards in this deck.
Unlock Deck
k this deck
19
When we use heterogeneous subsamples of data, such as older and younger subjects, the resulting correlation between intelligence and education could
A) tell you more about the relationship between Age and Education than between Intelligence and Education.
B) be very misleading.
C) represent the relationship between Education and Intelligence accurately.
D) all of the above
A) tell you more about the relationship between Age and Education than between Intelligence and Education.
B) be very misleading.
C) represent the relationship between Education and Intelligence accurately.
D) all of the above
Unlock Deck
Unlock for access to all 71 flashcards in this deck.
Unlock Deck
k this deck
20
In the scatterplot for the data in the previous question, the biggest outliers are likely to be
A) Portugal and Sweden.
B) Japan and Ireland .
C) Denmark and Sweden.
D) the U.S.A. and West Germany.
A) Portugal and Sweden.
B) Japan and Ireland .
C) Denmark and Sweden.
D) the U.S.A. and West Germany.
Unlock Deck
Unlock for access to all 71 flashcards in this deck.
Unlock Deck
k this deck
21
Which of the following is NOT a reason to explain why infant mortality increased with the number of physicians?
A) More physicians would lead to greater rates of reporting infant deaths.
B) Physicians go where the problems are.
C) Both variables are under the control of some third variable.
D) All of these answers are possible.
A) More physicians would lead to greater rates of reporting infant deaths.
B) Physicians go where the problems are.
C) Both variables are under the control of some third variable.
D) All of these answers are possible.
Unlock Deck
Unlock for access to all 71 flashcards in this deck.
Unlock Deck
k this deck
22
An intercorrelation matrix is one that
A) presents the correlations of each variable with each other variable.
B) is symmetric.
C) has as many rows as it does columns.
D) all of the above
A) presents the correlations of each variable with each other variable.
B) is symmetric.
C) has as many rows as it does columns.
D) all of the above
Unlock Deck
Unlock for access to all 71 flashcards in this deck.
Unlock Deck
k this deck
23
If the correlation between two variables is .76, and the sample size is large, we can conclude that
A) there is 76% of a relationship between the two variables.
B) there is a strong positive relationship between the two variables.
C) there is no relationship between the two variables.
D) both a and b
A) there is 76% of a relationship between the two variables.
B) there is a strong positive relationship between the two variables.
C) there is no relationship between the two variables.
D) both a and b
Unlock Deck
Unlock for access to all 71 flashcards in this deck.
Unlock Deck
k this deck
24
If one of our variables is a dichotomy, the correlation we compute is
A) Spearman's r S.
B) a rank correlation.
C) a point-biserial correlation.
D) a tetrachoric correlation.
A) Spearman's r S.
B) a rank correlation.
C) a point-biserial correlation.
D) a tetrachoric correlation.
Unlock Deck
Unlock for access to all 71 flashcards in this deck.
Unlock Deck
k this deck
25
If we look at the correlation between college admissions test scores and subsequent performance in college for all admitted applicants, we are likely to
A) underestimate the degree of correlation between test score and potential performance.
B) overestimate the relationship.
C) do quite a good job of estimating the relationship if our sample is sufficiently large.
D) not know much more than when we began.
A) underestimate the degree of correlation between test score and potential performance.
B) overestimate the relationship.
C) do quite a good job of estimating the relationship if our sample is sufficiently large.
D) not know much more than when we began.
Unlock Deck
Unlock for access to all 71 flashcards in this deck.
Unlock Deck
k this deck
26
Which of the following is the formula for the covariance?
A)
B)
C)
D)
A)
B)
C)
D)
Unlock Deck
Unlock for access to all 71 flashcards in this deck.
Unlock Deck
k this deck
27
The correlation in the population is denoted by
A) r
B)
C) R
D) f
A) r
B)
C) R
D) f
Unlock Deck
Unlock for access to all 71 flashcards in this deck.
Unlock Deck
k this deck
28
The covariance will always
A) be a positive number.
B) be larger than the variance.
C) reflect the direction of the relationship.
D) be less than 1.0.
A) be a positive number.
B) be larger than the variance.
C) reflect the direction of the relationship.
D) be less than 1.0.
Unlock Deck
Unlock for access to all 71 flashcards in this deck.
Unlock Deck
k this deck
29
When we have a relationship that is continually rising, but the line showing the relationship is not necessarily straight, we call this a _______ relationship.
A) linear
B) reclining
C) bivariate
D) monotonic
A) linear
B) reclining
C) bivariate
D) monotonic
Unlock Deck
Unlock for access to all 71 flashcards in this deck.
Unlock Deck
k this deck
30
A newspaper headline writer found that the more adjectives she put in the titles of her articles, the greater the number of newspapers that were sold that day. This relationship between numbers of adjectives and newspaper sales must be
A) significantly positive.
B) significantly negative.
C) monotonic.
D) positive.
A) significantly positive.
B) significantly negative.
C) monotonic.
D) positive.
Unlock Deck
Unlock for access to all 71 flashcards in this deck.
Unlock Deck
k this deck
31
When the data are in the form of ranks we
A) need a special formula that Spearman derived.
B) can just apply the standard formula to the ranks.
C) need to convert the ranks to raw scores before computing the correlation.
D) cannot do anything with the data.
A) need a special formula that Spearman derived.
B) can just apply the standard formula to the ranks.
C) need to convert the ranks to raw scores before computing the correlation.
D) cannot do anything with the data.
Unlock Deck
Unlock for access to all 71 flashcards in this deck.
Unlock Deck
k this deck
32
For a given set of data the covariance between X and Y is .80. The standard deviation of X is 2.0, and the standard deviation of Y is 3.0. The resulting correlation is closest to
A) .00
B) .15
C) .80
D) -.30
A) .00
B) .15
C) .80
D) -.30
Unlock Deck
Unlock for access to all 71 flashcards in this deck.
Unlock Deck
k this deck
33
The covariance between height and running speed on the State College track team was equal to -28.21. This tells us that the
A) relationship between height and speed is significant.
B) relationship between height and speed is negative.
C) the correlation is equal to the square root of -28.21.
D) the correlation is equal to -28.21.
A) relationship between height and speed is significant.
B) relationship between height and speed is negative.
C) the correlation is equal to the square root of -28.21.
D) the correlation is equal to -28.21.
Unlock Deck
Unlock for access to all 71 flashcards in this deck.
Unlock Deck
k this deck
34
If high scores on X are paired with low scores on Y , the covariance is going to be
A) positive.
B) negative.
C) zero.
D) There is no way to tell.
A) positive.
B) negative.
C) zero.
D) There is no way to tell.
Unlock Deck
Unlock for access to all 71 flashcards in this deck.
Unlock Deck
k this deck
35
For the following data, S XY is equal to
X 2 4 5
Y 2 3 4
A) 11
B) 9
C) 99
D) 36
X 2 4 5
Y 2 3 4
A) 11
B) 9
C) 99
D) 36
Unlock Deck
Unlock for access to all 71 flashcards in this deck.
Unlock Deck
k this deck
36
We can often use a Pearson correlation even when a relationship is curvilinear. This is because
A) a straight line will often fit the data remarkably well.
B) you can always calculate a correlation with any set of data.
C) the correlation coefficient doesn't care if the relationship is curvilinear.
D) there is no alternative.
A) a straight line will often fit the data remarkably well.
B) you can always calculate a correlation with any set of data.
C) the correlation coefficient doesn't care if the relationship is curvilinear.
D) there is no alternative.
Unlock Deck
Unlock for access to all 71 flashcards in this deck.
Unlock Deck
k this deck
37
In testing the significance of a correlation coefficient, the degrees of freedom are
A) N
B) N - 1
C) N - 2
D) N - 3
A) N
B) N - 1
C) N - 2
D) N - 3
Unlock Deck
Unlock for access to all 71 flashcards in this deck.
Unlock Deck
k this deck
38
A _______ refers to the degree of the relationship between two or more variables.
A) regression
B) correlation
C) relative frequency
D) matched sample
A) regression
B) correlation
C) relative frequency
D) matched sample
Unlock Deck
Unlock for access to all 71 flashcards in this deck.
Unlock Deck
k this deck
39
Which of the following pairs go together?
A) dependent variable : criterion variable
B) dependent variable : predictor variable
C) independent variable : criterion variable
D) independent variable : Y variable
A) dependent variable : criterion variable
B) dependent variable : predictor variable
C) independent variable : criterion variable
D) independent variable : Y variable
Unlock Deck
Unlock for access to all 71 flashcards in this deck.
Unlock Deck
k this deck
40
When we say that a correlation coefficient is statistically significant, we mean that
A) we have reason to believe that it reflects an important relationship between variables.
B) we have reason to believe that the relationship is positive.
C) we have reason to believe that the true correlation in the population is not 0.0.
D) we have strong support for a causal statement about the relationship.
Unlock Deck
Unlock for access to all 71 flashcards in this deck.
Unlock Deck
k this deck
41
Professor Falls wants to determine if there is a relationship between frequent hearing of a startle stimulus and hearing loss. He ran a regression and obtained an r value of .60. Which of the following best summarizes what this result means?
A) 60% of hearing loss is accounted for by frequency of hearing startle stimuli.
B) 36% of the variability in hearing loss can be accounted for by variability in the hearing of startle stimuli.
C) 36% of startle stimuli cause hearing loss.
D) 60% of hearing loss is caused by startle stimuli.
A) 60% of hearing loss is accounted for by frequency of hearing startle stimuli.
B) 36% of the variability in hearing loss can be accounted for by variability in the hearing of startle stimuli.
C) 36% of startle stimuli cause hearing loss.
D) 60% of hearing loss is caused by startle stimuli.
Unlock Deck
Unlock for access to all 71 flashcards in this deck.
Unlock Deck
k this deck
42
A scatterplot can be used to visualize the degree of association between 2 variables.
Unlock Deck
Unlock for access to all 71 flashcards in this deck.
Unlock Deck
k this deck
43
Which r-value represents the strongest correlation?
A) +.50
B) -.50
C) -.75
D) 1.65
A) +.50
B) -.50
C) -.75
D) 1.65
Unlock Deck
Unlock for access to all 71 flashcards in this deck.
Unlock Deck
k this deck
44
Correlation coefficients can range from -1 to 1.
Unlock Deck
Unlock for access to all 71 flashcards in this deck.
Unlock Deck
k this deck
45
We look at a number of states and record the number of auto fatalities last year and the state's maximum speed limit, trying to show that high speed limits are dangerous. This is an example of
A) a correlational study.
B) an experiment.
C) a longitudinal study.
D) naturalistic observation.
A) a correlational study.
B) an experiment.
C) a longitudinal study.
D) naturalistic observation.
Unlock Deck
Unlock for access to all 71 flashcards in this deck.
Unlock Deck
k this deck
46
The correlation between amount of caffeine consumed and nervous behavior was found to be .30. What conclusion can be drawn from this finding?
A) 30% of the of the variability in nervous behavior can be accounted for by variability in amount of caffeine consumed.
B) 9% of the of the variability in nervous behavior can be accounted for by variability in amount of caffeine consumed.
C) The correlation between nervous behavior and caffeine consumption is not significant
D) Consuming caffeine causes nervousness.
Unlock Deck
Unlock for access to all 71 flashcards in this deck.
Unlock Deck
k this deck
47
A researcher is predicting exam scores based on the amount of time spent studying. The criterion variable is exam scores.
Unlock Deck
Unlock for access to all 71 flashcards in this deck.
Unlock Deck
k this deck
48
A correlation was computed between amount of exercise people do and people's overall happiness. A significant correlation was found, such that the more people exercise, the happier they are. What is the best conclusion to draw from this finding?
A) Exercise leads people to be happy.
B) We have proved that people should exercise more.
C) A positive relationship exists between exercise and happiness.
D) A negative relationship exists between exercise and happiness.
A) Exercise leads people to be happy.
B) We have proved that people should exercise more.
C) A positive relationship exists between exercise and happiness.
D) A negative relationship exists between exercise and happiness.
Unlock Deck
Unlock for access to all 71 flashcards in this deck.
Unlock Deck
k this deck
49
Correlations are typically used to examine mean differences between groups.
Unlock Deck
Unlock for access to all 71 flashcards in this deck.
Unlock Deck
k this deck
50
Restricted range has no effect on correlation coefficients.
Unlock Deck
Unlock for access to all 71 flashcards in this deck.
Unlock Deck
k this deck
51
A significant correlation is one which
A) has a great deal of meaning.
B) means that the variables are not linearly independent.
C) is very hard to find.
D) is most likely to occur when the true correlation is near 0.
A) has a great deal of meaning.
B) means that the variables are not linearly independent.
C) is very hard to find.
D) is most likely to occur when the true correlation is near 0.
Unlock Deck
Unlock for access to all 71 flashcards in this deck.
Unlock Deck
k this deck
52
The covariance measure is
A) the probability of obtaining a significant result.
B) the degree to which observations predict each other.
C) the degree to which observations vary together.
D) the probability of finding variance.
A) the probability of obtaining a significant result.
B) the degree to which observations predict each other.
C) the degree to which observations vary together.
D) the probability of finding variance.
Unlock Deck
Unlock for access to all 71 flashcards in this deck.
Unlock Deck
k this deck
53
The following is an example of a negative correlation. As height increase, so does foot size.
Unlock Deck
Unlock for access to all 71 flashcards in this deck.
Unlock Deck
k this deck
54
Correlation cannot be used to test associations between two dichotomous variables.
Unlock Deck
Unlock for access to all 71 flashcards in this deck.
Unlock Deck
k this deck
55
Which of the following is the most accurate statement?
A) Correlation shows causation.
B) R squared or regression shows causation.
C) Correlation and R squared or regression show causation.
D) Neither correlation nor R squared nor regression show causation.
A) Correlation shows causation.
B) R squared or regression shows causation.
C) Correlation and R squared or regression show causation.
D) Neither correlation nor R squared nor regression show causation.
Unlock Deck
Unlock for access to all 71 flashcards in this deck.
Unlock Deck
k this deck
56
A correlation of .65 between depression and anxiety suggests that people who are highly depressed are reasonably likely to be highly anxious.
Unlock Deck
Unlock for access to all 71 flashcards in this deck.
Unlock Deck
k this deck
57
Correlation coefficients closer to 0 reflect strong relationships.
Unlock Deck
Unlock for access to all 71 flashcards in this deck.
Unlock Deck
k this deck
58
Which of the following pairs is most likely to be negatively correlated?
A) height of husband and height of wife
B) depression and stress
C) intelligence and sociability
D) volatile temper and success as an arbitrator
A) height of husband and height of wife
B) depression and stress
C) intelligence and sociability
D) volatile temper and success as an arbitrator
Unlock Deck
Unlock for access to all 71 flashcards in this deck.
Unlock Deck
k this deck
59
We want to demonstrate that a relationship exists between optimism and happiness. We are not concerned with trying to demonstrate that one variable causes the other. What type of statistical test can be use to see if a relationship exists between the variables?
A) correlation
B) independent samples t-test
C) power analysis
D) one way ANOVA
A) correlation
B) independent samples t-test
C) power analysis
D) one way ANOVA
Unlock Deck
Unlock for access to all 71 flashcards in this deck.
Unlock Deck
k this deck
60
If the R squared between brain size and IQ is .09 then
A) 9% of your IQ is accounted for by variability in brain size.
B) 91% of your IQ is accounted for by variability in brain size.
C) 9% of the variability in IQ is accounted for by variability in brain size.
D) 91% of the variability in IQ is accounted for by variability in brain size.
A) 9% of your IQ is accounted for by variability in brain size.
B) 91% of your IQ is accounted for by variability in brain size.
C) 9% of the variability in IQ is accounted for by variability in brain size.
D) 91% of the variability in IQ is accounted for by variability in brain size.
Unlock Deck
Unlock for access to all 71 flashcards in this deck.
Unlock Deck
k this deck
61
Give an example of a relationship that is effected by restricted range. Explain your example clearly.
Unlock Deck
Unlock for access to all 71 flashcards in this deck.
Unlock Deck
k this deck
62
Calculate and interpret the correlation between the following variables.
Unlock Deck
Unlock for access to all 71 flashcards in this deck.
Unlock Deck
k this deck
63
Describe the following graph.
Unlock Deck
Unlock for access to all 71 flashcards in this deck.
Unlock Deck
k this deck
64
Write a brief paragraph to summarize the data displayed in the following table.
Unlock Deck
Unlock for access to all 71 flashcards in this deck.
Unlock Deck
k this deck
65
Give an example of a relationship that may be effected by the heterogeneity of a sample. Explain your example clearly.
Unlock Deck
Unlock for access to all 71 flashcards in this deck.
Unlock Deck
k this deck
66
Point biseral correlation is used when one of the variables is dichotomous.
Unlock Deck
Unlock for access to all 71 flashcards in this deck.
Unlock Deck
k this deck
67
Calculate the correlation coefficient for the previous data. Is it significant? Write a brief statement to explain the results.
Unlock Deck
Unlock for access to all 71 flashcards in this deck.
Unlock Deck
k this deck
68
Given the following pairs of data for mothers' and fathers' ratings of their child's behavior problems, what type of correlation would you expect? Explain your answer.
Unlock Deck
Unlock for access to all 71 flashcards in this deck.
Unlock Deck
k this deck
69
Indicate the types of relationships illustrated in the following graphs. (e.g., positive, negative, no relationship, curvilinear).
Unlock Deck
Unlock for access to all 71 flashcards in this deck.
Unlock Deck
k this deck
70
Make a scatterplot of the following data and draw a line of best fit.
Unlock Deck
Unlock for access to all 71 flashcards in this deck.
Unlock Deck
k this deck
71
Give an example of a:
a. positive relationship
b. negative relationship
c. curvilinear relationship
a. positive relationship
b. negative relationship
c. curvilinear relationship
Unlock Deck
Unlock for access to all 71 flashcards in this deck.
Unlock Deck
k this deck
Unlock Deck
Unlock for access to all 71 flashcards in this deck.


