Deck 15: Basic Statistics
Full screen (f)
Question
Question
Question
Question
Question
Question
Question
Question
Question
Question
Question
Question
Question
Question
Question
Question
Question
Question
Question
Question
Question
Question
Question
Question
Question
The mileage on six vehicles leased for one year were recorded as follows.  What is the mean measurement?
What is the mean measurement? Question
Question
Question
Question
Question
Question
Question
Question
Question
Question
Question
Question
Question
Question
A trucking company had hauls of the following mileage.  What is the mean measurement of the hauls?
What is the mean measurement of the hauls? Question
Question
Question
Question
Question
Find the median measurement for the set of measurements.  ,
,  ,
,  ,
,  ,
,  ,
,  ,
,  ,
,  ,
,  ,
,  ,
,  ,
,  ,
,  ,
,  ,
,  ,
,  ,
,  ,
,  ,
, 
, , , , , , , , , , , , , , , , , , Question
Question
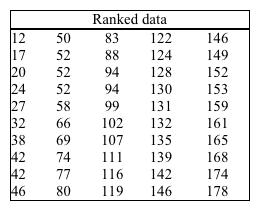
The following list gives 50 pieces of ranked data (ranked from smallest to largest). Find the 4th percentile.
Question
Find the median measurement for the set of measurements.  ,
,  ,
,  ,
,  ,
,  ,
,  ,
,  ,
,  ,
,  ,
,  ,
,  ,
, 
, , , , , , , , , , , Question
Find the median measurement for the set of measurements.  mm,
mm,  mm,
mm,  mm,
mm,  mm,
mm,  mm
mm
__________ mm
mm, mm, mm, mm, mm__________ mm
Question
Question
Question
The following list gives 50 pieces of ranked data (ranked from smallest to largest). Find the 72nd percentile. 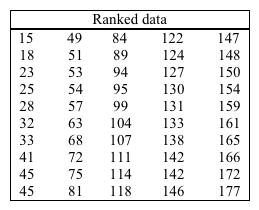
Question
Question
Find the median measurement for the set of measurements.  m,
m,  m,
m,  m,
m,  m,
m,  m
m
__________ m
m, m, m, m, m__________ m
Question
Question
Question
Question
Question
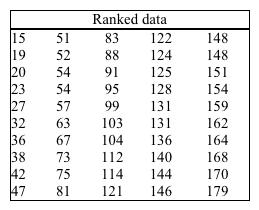
The following list gives 50 pieces of ranked data (ranked from smallest to largest). Find the 49th percentile.
Question
Find the median measurement for the set of measurements.  cm,
cm,  cm,
cm,  cm,
cm,  cm
cm
__________ cm
cm, cm, cm, cm__________ cm
Question
Question
Draw a circle graph. In the United States for 2000, the percentage of national household income by quintiles was as follows: 1st, 4%; 2nd, 17.1%; 3rd, 36.7%; 4th, 24.4%; 5th, 17.8%.
A)
B)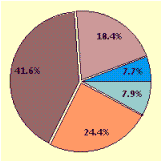
C)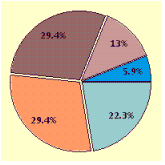
D)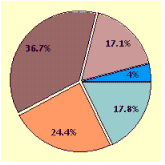
A)
B)
C)
D)
Question
Draw a circle graph. Depict the suggested semester credit-hour requirements for a community college curriculum in industrial technology as shown in the table.
A)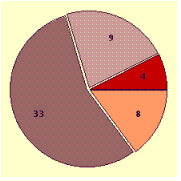
B)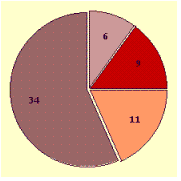
C)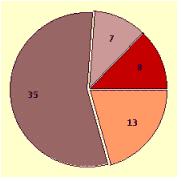
D)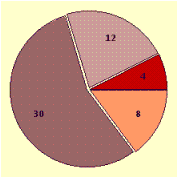
A)
B)
C)
D)
Question
Draw a circle graph. In 1999, U.S. nonfarm employment was as follows: manufacturing, 17.3 million
Other goods-producing industries, 5.1 million
Private service producing industries, 79.1 million
Government, 21 million
A)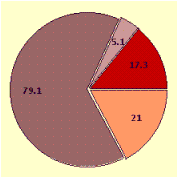
B)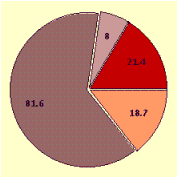
C)
D)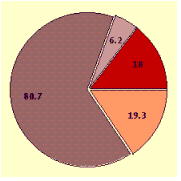
Other goods-producing industries, 5.1 million
Private service producing industries, 79.1 million
Government, 21 million
A)
B)
C)
D)
Question
Question
Question
The highest level of education for persons age 25 and older in some state in 2004 can be found in the data below. Draw a circle graph.
A)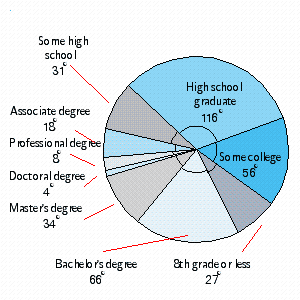
B)
C)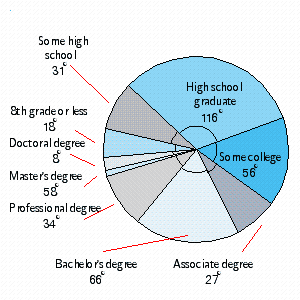
D)
E)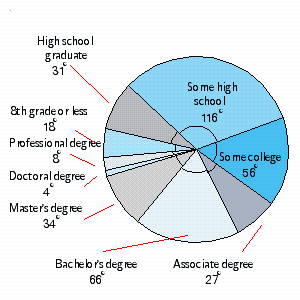
A)
B)
C)
D)
E)
Question
Question
Question
Draw a circle graph. A company interviewed its 478 employees to find the toughest day to work of a five-day work week as shown in the table. 
A)
B)
C)
D)
A)
B)
C)
D)
Question
Question
Question
Question
Question
Question
The 2022 projected population data for the regions of the world are as follows in millions: North America, 437.7
South America, 433.4
Africa, 1,154.7
Europe, 705.2
Asia, 5,876.3
Oceania, 37.9
Draw a circle graph.
A)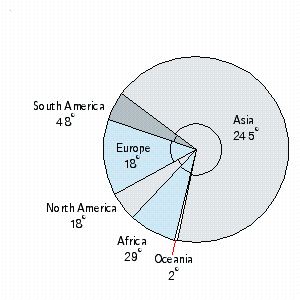
B)
C)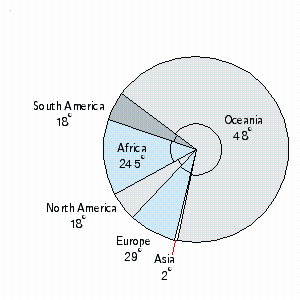
D)
E)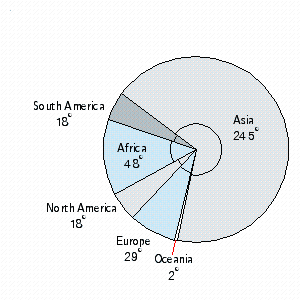
South America, 433.4
Africa, 1,154.7
Europe, 705.2
Asia, 5,876.3
Oceania, 37.9
Draw a circle graph.
A)
B)
C)
D)
E)
Question
Question
Draw a circle graph. In 1996, the values, in millions of dollars, of crop output for farms in the United States were as follows: food grains, 11,666
Food crops, 20,065
Cotton, 7,342
Oil crops, 17,703
Tobacco, 4,900
Fruits and tree nuts, 11,593
Vegetables, 14,491
All other, 15,737
A)
B)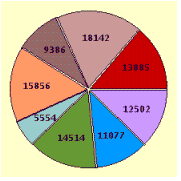
C)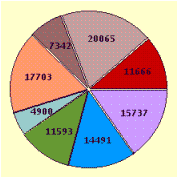
D)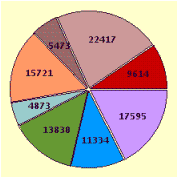
Food crops, 20,065
Cotton, 7,342
Oil crops, 17,703
Tobacco, 4,900
Fruits and tree nuts, 11,593
Vegetables, 14,491
All other, 15,737
A)
B)
C)
D)
Question
Question
In 2000 the United States population by age was as follows: under: 15, 22.2%; 15-29, 21%; 30-44, 25.3%; 45-59, 15.8%; 60-74, 10%; 75
And over, 5.7%.
A)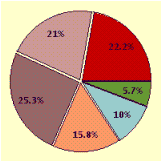
B)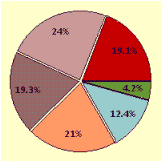
C)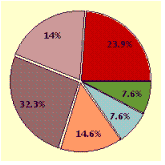
D)
And over, 5.7%.
A)
B)
C)
D)
Question

Unlock Deck
Sign up to unlock the cards in this deck!
Unlock Deck
Unlock Deck
1/201
Play
Full screen (f)
Deck 15: Basic Statistics
1
The mileage on six vehicles leased for one year were recorded as follows. 25,740 mi, 25,720 mi, 25,810 mi, 25,830 mi, 25,840 mi
What is the mean measurement?
A) 25,540 mi
B) 25,780 mi
C) 103,120 mi
D) 26,000 mi
E) 154,680 mi
What is the mean measurement?
A) 25,540 mi
B) 25,780 mi
C) 103,120 mi
D) 26,000 mi
E) 154,680 mi
25,780 mi
2
Find the mean measurement for the set of measurements. 0.019, 0.118, 0.059, 0.198, 0.228, 0.182, 0.227, 0.331, 0.534, 0.344, 0.197, 0.254
A) 0.300
B) 2.691
C) 0.022
D) 0.224
E) 0.174
A) 0.300
B) 2.691
C) 0.022
D) 0.224
E) 0.174
0.224
3
Find the mean measurement for the set of measurements. 248, 622, 328, 126, 761, 955, 845, 24, 0.14, 857, 197, 345, 367, 289, 628, 738, 804, 2,889, 212, 485
A) 940
B) 35,701
C) 1,849
D) 1,854
E) 1,879
A) 940
B) 35,701
C) 1,849
D) 1,854
E) 1,879
1,879
4
Find the mean measurement for the set of measurements. 2.3, 8.8, 9.5, 7.5, 10.6, 11.7, 12.9, 13.6, 16.6, 10.7, 12.7, 15.3, 20.9, 21.2, 30.2, 42.5
A) 30.9
B) 16.0
C) 18.0
D) 247.0
E) 15.4
A) 30.9
B) 16.0
C) 18.0
D) 247.0
E) 15.4
Unlock Deck
Unlock for access to all 201 flashcards in this deck.
Unlock Deck
k this deck
5
Find the mean measurement for the set of measurements. 9,214 m, 9.237 m, 9,294 m, 9.222 m, 9.291 m
A) 46,258 m
B) 9,252 m
C) 9,246 m
D) 37,006 m
E) 9,232 m
A) 46,258 m
B) 9,252 m
C) 9,246 m
D) 37,006 m
E) 9,232 m
Unlock Deck
Unlock for access to all 201 flashcards in this deck.
Unlock Deck
k this deck
6
Find the mean measurement for the set of measurements.
A) 88,197
B) 23,210
C) 4,604
D) 4,561
E) 4,642
A) 88,197
B) 23,210
C) 4,604
D) 4,561
E) 4,642
Unlock Deck
Unlock for access to all 201 flashcards in this deck.
Unlock Deck
k this deck
7
Find the mean measurement for the set of measurements. 6.643 mm, 6.642 mm, 6.652 mm, 6.642 mm, 2.718282 mm
A) 6.300 mm
B) 0.665 mm
C) 6.646 mm
D) 33.228 mm
E) 6.606 mm
A) 6.300 mm
B) 0.665 mm
C) 6.646 mm
D) 33.228 mm
E) 6.606 mm
Unlock Deck
Unlock for access to all 201 flashcards in this deck.
Unlock Deck
k this deck
8
Find the mean measurement for the set of measurements. 1.001, 1.109, 1.055, 1.064, 1.116, 1.217
A) 0.080
B) 7.677
C) 1.087
D) 0.110
E) 1.097
A) 0.080
B) 7.677
C) 1.087
D) 0.110
E) 1.097
Unlock Deck
Unlock for access to all 201 flashcards in this deck.
Unlock Deck
k this deck
9
Find the mean measurement for the set of measurements. 21, 53, 76, 46, 63, 26, 55, 82, 97, 36, 12
A) 52
B) 208
C) 46
D) 37
E) 572
A) 52
B) 208
C) 46
D) 37
E) 572
Unlock Deck
Unlock for access to all 201 flashcards in this deck.
Unlock Deck
k this deck
10
A trucking company had hauls of the following mileage. 2,032 km, 2,059 km, 2,035 km, 2,026 km, 2,089 km
What is the mean measurement of the hauls?
A) 2,116 km
B) 2,048 km
C) 10,240 km
D) 1,024 km
E) 1,808 km
What is the mean measurement of the hauls?
A) 2,116 km
B) 2,048 km
C) 10,240 km
D) 1,024 km
E) 1,808 km
Unlock Deck
Unlock for access to all 201 flashcards in this deck.
Unlock Deck
k this deck
11
A pharmacist weighed ten different capsules of the same compound and recorded these measurements.
3,429 mg, 3,442 mg, 3,424 mg, 3,449 mg, 3,443 mg, 3,441 mg, 3,411 mg, 3,422 mg, 3,417 mg, 3,439 mg
What is the mean measurement?
A) 3,192 mg
B) 3,427 mg
C) 34,320 mg
D) 3,432 mg
E) 13,728 mg
3,429 mg, 3,442 mg, 3,424 mg, 3,449 mg, 3,443 mg, 3,441 mg, 3,411 mg, 3,422 mg, 3,417 mg, 3,439 mg
What is the mean measurement?
A) 3,192 mg
B) 3,427 mg
C) 34,320 mg
D) 3,432 mg
E) 13,728 mg
Unlock Deck
Unlock for access to all 201 flashcards in this deck.
Unlock Deck
k this deck
12
Find the mean measurement for the set of measurements.
A) 2,014
B) 2,018
C) 2,013
D) 8,071
E) 16,142
A) 2,014
B) 2,018
C) 2,013
D) 8,071
E) 16,142
Unlock Deck
Unlock for access to all 201 flashcards in this deck.
Unlock Deck
k this deck
13
A trucking company had 7 items with the following weights.
753 lb, 835 lb, 1,008 lb, 256 lb, 641 lb, 783 lb, 443 lb
What is the mean measurement?
A) 682 lb
B) 337 lb
C) 674 lb
D) 660 lb
E) 4,718 lb
753 lb, 835 lb, 1,008 lb, 256 lb, 641 lb, 783 lb, 443 lb
What is the mean measurement?
A) 682 lb
B) 337 lb
C) 674 lb
D) 660 lb
E) 4,718 lb
Unlock Deck
Unlock for access to all 201 flashcards in this deck.
Unlock Deck
k this deck
14
Find the mean measurement for the set of measurements. 0.2639 in., 0.2635 in., 0.2683 in., 0.2624 in., 0.2624 in., 0.2659 in.
A) 0.2900 in.
B) 0.2444 in.
C) 0.5864 in.
D) 1.3220 in.
E) 0.2644 in.
A) 0.2900 in.
B) 0.2444 in.
C) 0.5864 in.
D) 1.3220 in.
E) 0.2644 in.
Unlock Deck
Unlock for access to all 201 flashcards in this deck.
Unlock Deck
k this deck
15
Find the mean measurement for the set of measurements.
A) 6,914
B) 6,916
C) 82,996
D) 3,458
E) 6,872
A) 6,914
B) 6,916
C) 82,996
D) 3,458
E) 6,872
Unlock Deck
Unlock for access to all 201 flashcards in this deck.
Unlock Deck
k this deck
16
Find the mean measurement for the set of measurements. 47.85 cm, 48.26 cm, 47.53 cm, 47.43 cm
A) 47.77 cm
B) 95.54 cm
C) 51.00 cm
D) 23.88 cm
E) 191.07 cm
A) 47.77 cm
B) 95.54 cm
C) 51.00 cm
D) 23.88 cm
E) 191.07 cm
Unlock Deck
Unlock for access to all 201 flashcards in this deck.
Unlock Deck
k this deck
17
Find the mean measurement for the set of measurements. 0.88, 0.34, 1.66, 0.77, 1.05, 0.75, 1.11, 1.99, 0.065
A) 0.96
B) 3.88
C) 8.62
D) 3.83
E) 1.40
A) 0.96
B) 3.88
C) 8.62
D) 3.83
E) 1.40
Unlock Deck
Unlock for access to all 201 flashcards in this deck.
Unlock Deck
k this deck
18
Over an eight day period of time the high temperature of each day was recorded in degrees Fahrenheit as follows. 65, 76, 87, 75, 77, 82, 88, 64.
What is the mean measurement?
A) 616
B) 76
C) 72
D) 77
E) 308
What is the mean measurement?
A) 616
B) 76
C) 72
D) 77
E) 308
Unlock Deck
Unlock for access to all 201 flashcards in this deck.
Unlock Deck
k this deck
19
Find the mean measurement for the set of measurements.
1)66, 2.38, 4.18, 7.12, 3.68, 2.84, 4.18, 8.24, 4.71, 3.62, 6.16, 1.83, 4.18, 2.87, 1.04,9.61, 7.77, 6.39
A) 82.46
B) 4.46
C) 22.91
D) 4.58
E) 4.70
1)66, 2.38, 4.18, 7.12, 3.68, 2.84, 4.18, 8.24, 4.71, 3.62, 6.16, 1.83, 4.18, 2.87, 1.04,9.61, 7.77, 6.39
A) 82.46
B) 4.46
C) 22.91
D) 4.58
E) 4.70
Unlock Deck
Unlock for access to all 201 flashcards in this deck.
Unlock Deck
k this deck
20
A tech measured the power usage of six appliances and recorded the following results.
173 kW, 106 kW, 135 kW, 176 kW, 195 kW, 201 kW
What is the mean measurement?
A) 16 kW
B) 162 kW
C) 175 kW
D) 984 kW
E) 164 kW
173 kW, 106 kW, 135 kW, 176 kW, 195 kW, 201 kW
What is the mean measurement?
A) 16 kW
B) 162 kW
C) 175 kW
D) 984 kW
E) 164 kW
Unlock Deck
Unlock for access to all 201 flashcards in this deck.
Unlock Deck
k this deck
21
Find the median measurement for the set of measurements. , , , , , , , ,
A)
B)
C)
D)
E)
A)
B)
C)
D)
E)
Unlock Deck
Unlock for access to all 201 flashcards in this deck.
Unlock Deck
k this deck
22
The following list gives 50 pieces of ranked data (ranked from smallest to largest). Find the 7th percentile.
A) 12
B) 38
C) 19
D) 24
E) 55
A) 12
B) 38
C) 19
D) 24
E) 55
Unlock Deck
Unlock for access to all 201 flashcards in this deck.
Unlock Deck
k this deck
23
Find the median measurement for the set of measurements. , , , , , , , , , ,
A)
B)
C)
D)
E)
A)
B)
C)
D)
E)
Unlock Deck
Unlock for access to all 201 flashcards in this deck.
Unlock Deck
k this deck
24
Find the median measurement for the set of measurements. , , , , , , , , , , , , , , ,
A)
B)
C)
D)
E)
A)
B)
C)
D)
E)
Unlock Deck
Unlock for access to all 201 flashcards in this deck.
Unlock Deck
k this deck
25
The mileage on six vehicles leased for one year were recorded as follows. What is the mean measurement?
What is the mean measurement? Unlock Deck
Unlock for access to all 201 flashcards in this deck.
Unlock Deck
k this deck
26
A trucking company had hauls of the following distances. km, km, km, km, km What is the median measurement of the hauls?
A) km
B) km
C) km
D) km
E) km
A) km
B) km
C) km
D) km
E) km
Unlock Deck
Unlock for access to all 201 flashcards in this deck.
Unlock Deck
k this deck
27
Find the median measurement for the set of measurements. , , , , , , , , , , ,
A)
B)
C)
D)
E)
A)
B)
C)
D)
E)
Unlock Deck
Unlock for access to all 201 flashcards in this deck.
Unlock Deck
k this deck
28
Find the median measurement for the set of measurements. mm, mm, mm, mm, mm
A) mm
B) mm
C) mm
D) mm
E) mm
A) mm
B) mm
C) mm
D) mm
E) mm
Unlock Deck
Unlock for access to all 201 flashcards in this deck.
Unlock Deck
k this deck
29
The following list gives 50 pieces of ranked data (ranked from smallest to largest). Find the 67th percentile.
A) 177
B) 130
C) 119
D) 152
E) 133
A) 177
B) 130
C) 119
D) 152
E) 133
Unlock Deck
Unlock for access to all 201 flashcards in this deck.
Unlock Deck
k this deck
30
A technician measured the power usage of six appliances and recorded the following results. kW, kW, kW, kW, kW, kW What is the median measurement?
A) kW
B) kW
C) kW
D) kW
E) kW
A) kW
B) kW
C) kW
D) kW
E) kW
Unlock Deck
Unlock for access to all 201 flashcards in this deck.
Unlock Deck
k this deck
31
A pharmacist weighed ten different capsules of the same compound and recorded these measurements. mg, mg, mg, mg, mg, mg, mg, mg, mg, mg What is the median measurement?
A) mg
B) mg
C) mg
D) mg
E) mg
A) mg
B) mg
C) mg
D) mg
E) mg
Unlock Deck
Unlock for access to all 201 flashcards in this deck.
Unlock Deck
k this deck
32
Find the median measurement for the set of measurements. cm, cm, cm, cm
A) cm
B) cm
C) cm
D) cm
E) cm
A) cm
B) cm
C) cm
D) cm
E) cm
Unlock Deck
Unlock for access to all 201 flashcards in this deck.
Unlock Deck
k this deck
33
Find the median measurement for the set of measurements. , , , , , , , , , , , , , , , , , ,
A)
B)
C)
D)
E)
A)
B)
C)
D)
E)
Unlock Deck
Unlock for access to all 201 flashcards in this deck.
Unlock Deck
k this deck
34
Find the median measurement for the set of measurements. ; ; ; ; ; ; ; ; ; ; ; ; ; ; ; ; ; ;
A)
B)
C)
D)
E)
A)
B)
C)
D)
E)
Unlock Deck
Unlock for access to all 201 flashcards in this deck.
Unlock Deck
k this deck
35
A trucking company had seven items with the following weights. lb, lb, lb, lb, lb, lb, lb What is the median measurement?
A) lb
B) lb
C) lb
D) lb
E) lb
A) lb
B) lb
C) lb
D) lb
E) lb
Unlock Deck
Unlock for access to all 201 flashcards in this deck.
Unlock Deck
k this deck
36
Find the median measurement for the set of measurements. m, m, m, m, m
A) m
B) m
C) m
D) m
E) m
A) m
B) m
C) m
D) m
E) m
Unlock Deck
Unlock for access to all 201 flashcards in this deck.
Unlock Deck
k this deck
37
The following list gives 50 pieces of ranked data (ranked from smallest to largest). Find the 66th percentile.
A) 126
B) 106
C) 113
D) 117
E) 67
A) 126
B) 106
C) 113
D) 117
E) 67
Unlock Deck
Unlock for access to all 201 flashcards in this deck.
Unlock Deck
k this deck
38
The mileage on six vehicles leased for one year were recorded as follows. mi, mi, mi, mi, mi, mi What is the median measurement?
A) mi
B) mi
C) mi
D) mi
E) mi
A) mi
B) mi
C) mi
D) mi
E) mi
Unlock Deck
Unlock for access to all 201 flashcards in this deck.
Unlock Deck
k this deck
39
A trucking company had hauls of the following mileage. What is the mean measurement of the hauls?
What is the mean measurement of the hauls? Unlock Deck
Unlock for access to all 201 flashcards in this deck.
Unlock Deck
k this deck
40
Find the median measurement for the set of measurements. , , , , , , ,
A)
B)
C)
D)
E)
A)
B)
C)
D)
E)
Unlock Deck
Unlock for access to all 201 flashcards in this deck.
Unlock Deck
k this deck
41
Find 53% of 360o Round your answer to the nearest tenth.
A) 169.2o
B) 180.0o
C) 201.4o
D) 198.0o
E) 190.8o
A) 169.2o
B) 180.0o
C) 201.4o
D) 198.0o
E) 190.8o
Unlock Deck
Unlock for access to all 201 flashcards in this deck.
Unlock Deck
k this deck
42
Of 1,859 students, 210 are taking technical physics. What angle of a circle would show the percent of students taking technical physics? Round your answer to the nearest tenth.
A) 40.7o
B) 32.5o
C) 43.8o
D) 34.9o
E) 21.9o
A) 40.7o
B) 32.5o
C) 43.8o
D) 34.9o
E) 21.9o
Unlock Deck
Unlock for access to all 201 flashcards in this deck.
Unlock Deck
k this deck
43
A department spends $16,349 of its $181,500 budget for supplies. What angle of a circle would show the percent of money the department spends on things other than supplies? Round your answer to the nearest tenth.
A) 328.1o
B) 328.0o
C) 327.6o
D) 327.8o
E) 164.0o
A) 328.1o
B) 328.0o
C) 327.6o
D) 327.8o
E) 164.0o
Unlock Deck
Unlock for access to all 201 flashcards in this deck.
Unlock Deck
k this deck
44
Find the median measurement for the set of measurements. , , , , , , , , , , , , , , , , , ,
, , , , , , , , , , , , , , , , , , Unlock Deck
Unlock for access to all 201 flashcards in this deck.
Unlock Deck
k this deck
45
Of 686 students, 362 are taking mathematics. What angle of a circle would show the percent of students taking mathematics? Round your answer to the nearest tenth.
A) 223.0o
B) 203.6o
C) 190.0o
D) 207.3o
E) 360.0o
A) 223.0o
B) 203.6o
C) 190.0o
D) 207.3o
E) 360.0o
Unlock Deck
Unlock for access to all 201 flashcards in this deck.
Unlock Deck
k this deck
46
The following list gives 50 pieces of ranked data (ranked from smallest to largest). Find the 4th percentile.
Unlock Deck
Unlock for access to all 201 flashcards in this deck.
Unlock Deck
k this deck
47
Find the median measurement for the set of measurements. , , , , , , , , , , ,
, , , , , , , , , , , Unlock Deck
Unlock for access to all 201 flashcards in this deck.
Unlock Deck
k this deck
48
Find the median measurement for the set of measurements. mm, mm, mm, mm, mm
__________ mm
mm, mm, mm, mm, mm__________ mm
Unlock Deck
Unlock for access to all 201 flashcards in this deck.
Unlock Deck
k this deck
49
In one month, the sales of calculators were as follows: What central angle of a circle graph would show Brand B's sales as a percent of the total sales for the month?
Round your answer to the nearest tenth.
A) 106.2o
B) 99.2o
C) 91.2o
D) 83.2o
E) 73.2o
Round your answer to the nearest tenth.
A) 106.2o
B) 99.2o
C) 91.2o
D) 83.2o
E) 73.2o
Unlock Deck
Unlock for access to all 201 flashcards in this deck.
Unlock Deck
k this deck
50
Find 65% of 360o
A) 306o
B) 270o
C) 234o
D) 247o
E) 198o
A) 306o
B) 270o
C) 234o
D) 247o
E) 198o
Unlock Deck
Unlock for access to all 201 flashcards in this deck.
Unlock Deck
k this deck
51
The following list gives 50 pieces of ranked data (ranked from smallest to largest). Find the 72nd percentile.
Unlock Deck
Unlock for access to all 201 flashcards in this deck.
Unlock Deck
k this deck
52
Find 39.1% of 360o Round your answer to the nearest tenth.
A) 158.8o
B) 144.4o
C) 148.6o
D) 140.8o
E) 148.0o
A) 158.8o
B) 144.4o
C) 148.6o
D) 140.8o
E) 148.0o
Unlock Deck
Unlock for access to all 201 flashcards in this deck.
Unlock Deck
k this deck
53
Find the median measurement for the set of measurements. m, m, m, m, m
__________ m
m, m, m, m, m__________ m
Unlock Deck
Unlock for access to all 201 flashcards in this deck.
Unlock Deck
k this deck
54
Find 31% of 360o Round your answer to the nearest tenth.
A) 90.0o
B) 82.8o
C) 117.8o
D) 111.6o
E) 108.0o
A) 90.0o
B) 82.8o
C) 117.8o
D) 111.6o
E) 108.0o
Unlock Deck
Unlock for access to all 201 flashcards in this deck.
Unlock Deck
k this deck
55
Of 5,000 TV sets, 227 are found to be defective. What angle of a circle would show the percent of defective TV sets? Round your answer to the nearest tenth.
A)
B)
C)
D)
E)
A)
B)
C)
D)
E)
Unlock Deck
Unlock for access to all 201 flashcards in this deck.
Unlock Deck
k this deck
56
Find 48.7% of 360o Round your answer to the nearest tenth.
A) 185.1o
B) 164.5o
C) 150.1o
D) 175.3o
E) 160.9o
A) 185.1o
B) 164.5o
C) 150.1o
D) 175.3o
E) 160.9o
Unlock Deck
Unlock for access to all 201 flashcards in this deck.
Unlock Deck
k this deck
57
Candidate A was one of four candidate in an election. Of 28,405 votes cast, 4,840 were for Candidate A. What angle of a circle would show the percent of votes not cast for Candidate A? Round your answer to the nearest tenth.
A) 305.9o
B) 300.3o
C) 307.2o
D) 152.9o
E) 298.7o
A) 305.9o
B) 300.3o
C) 307.2o
D) 152.9o
E) 298.7o
Unlock Deck
Unlock for access to all 201 flashcards in this deck.
Unlock Deck
k this deck
58
The following list gives 50 pieces of ranked data (ranked from smallest to largest). Find the 49th percentile.
Unlock Deck
Unlock for access to all 201 flashcards in this deck.
Unlock Deck
k this deck
59
Find the median measurement for the set of measurements. cm, cm, cm, cm
__________ cm
cm, cm, cm, cm__________ cm
Unlock Deck
Unlock for access to all 201 flashcards in this deck.
Unlock Deck
k this deck
60
Find 18.2% of 360o Round your answer to the nearest tenth.
A) 58.3o
B) 69.2o
C) 51.1o
D) 65.52o
E) 43.9o
A) 58.3o
B) 69.2o
C) 51.1o
D) 65.52o
E) 43.9o
Unlock Deck
Unlock for access to all 201 flashcards in this deck.
Unlock Deck
k this deck
61
Draw a circle graph. In the United States for 2000, the percentage of national household income by quintiles was as follows: 1st, 4%; 2nd, 17.1%; 3rd, 36.7%; 4th, 24.4%; 5th, 17.8%.
A)
B)
C)
D)
A)
B)
C)
D)
Unlock Deck
Unlock for access to all 201 flashcards in this deck.
Unlock Deck
k this deck
62
Draw a circle graph. Depict the suggested semester credit-hour requirements for a community college curriculum in industrial technology as shown in the table.
A)
B)
C)
D)
A)
B)
C)
D)
Unlock Deck
Unlock for access to all 201 flashcards in this deck.
Unlock Deck
k this deck
63
Draw a circle graph. In 1999, U.S. nonfarm employment was as follows: manufacturing, 17.3 million
Other goods-producing industries, 5.1 million
Private service producing industries, 79.1 million
Government, 21 million
A)
B)
C)
D)
Other goods-producing industries, 5.1 million
Private service producing industries, 79.1 million
Government, 21 million
A)
B)
C)
D)
Unlock Deck
Unlock for access to all 201 flashcards in this deck.
Unlock Deck
k this deck
64
A bag contains 1 red marble, 1 blue marble, 1 green marble, 1 black and 1 white marble. What is the probability of drawing 1 red marble, replacing it, and then drawing a red marble again?
A)
B)
C)
D)
E)
A)
B)
C)
D)
E)
Unlock Deck
Unlock for access to all 201 flashcards in this deck.
Unlock Deck
k this deck
65
A card is drawn and replaced three times from a deck of 52 cards. What is the probability of getting 3 aces?
A)
B)
C)
D)
E)
A)
B)
C)
D)
E)
Unlock Deck
Unlock for access to all 201 flashcards in this deck.
Unlock Deck
k this deck
66
The highest level of education for persons age 25 and older in some state in 2004 can be found in the data below. Draw a circle graph.
A)
B)
C)
D)
E)
A)
B)
C)
D)
E)
Unlock Deck
Unlock for access to all 201 flashcards in this deck.
Unlock Deck
k this deck
67
A large box of vegetables contains 7 tomatoes, 3 heads of lettuce, and 8 onions. A vegetable is chosen at random and then placed back in the box, and a second vegetable is picked. What is the probability of choosing a tomato and an onion?
A)
B)
C)
D)
E)
A)
B)
C)
D)
E)
Unlock Deck
Unlock for access to all 201 flashcards in this deck.
Unlock Deck
k this deck
68
A card is chosen from a deck of 52 cards and placed back in the deck, and a second card is chosen from the deck. What is the probability of drawing the king of diamonds and the queen of clubs?
A)
B)
C)
D)
E)
A)
B)
C)
D)
E)
Unlock Deck
Unlock for access to all 201 flashcards in this deck.
Unlock Deck
k this deck
69
Draw a circle graph. A company interviewed its 478 employees to find the toughest day to work of a five-day work week as shown in the table.
A)
B)
C)
D)
A)
B)
C)
D)
Unlock Deck
Unlock for access to all 201 flashcards in this deck.
Unlock Deck
k this deck
70
A card is chosen from a deck of 52 cards. It is put back in the deck and a second card is chosen. What is the probability of an ace and a 2?
A)
B)
C)
D)
E)
A)
B)
C)
D)
E)
Unlock Deck
Unlock for access to all 201 flashcards in this deck.
Unlock Deck
k this deck
71
Two dice are rolled. What is the probability of getting two 5s?
A)
B)
C)
D)
E)
A)
B)
C)
D)
E)
Unlock Deck
Unlock for access to all 201 flashcards in this deck.
Unlock Deck
k this deck
72
A card is chosen from a deck of 52 cards and then placed back in the deck, and a second card is chosen. What is the probability of drawing 2 queens?
A)
B)
C)
D)
E)
A)
B)
C)
D)
E)
Unlock Deck
Unlock for access to all 201 flashcards in this deck.
Unlock Deck
k this deck
73
A coin is tossed, and a die is thrown. What is the probability of a head and a 1?
A)
B)
C)
D)
E)
A)
B)
C)
D)
E)
Unlock Deck
Unlock for access to all 201 flashcards in this deck.
Unlock Deck
k this deck
74
A bag contains 10 green marbles, 4 white marbles, and 6 red marbles. A marble is removed and then placed back in the bag, and a second marble is picked. What is the probability of getting a green marble and a red marble?
A)
B)
C)
D)
A)
B)
C)
D)
Unlock Deck
Unlock for access to all 201 flashcards in this deck.
Unlock Deck
k this deck
75
The 2022 projected population data for the regions of the world are as follows in millions: North America, 437.7
South America, 433.4
Africa, 1,154.7
Europe, 705.2
Asia, 5,876.3
Oceania, 37.9
Draw a circle graph.
A)
B)
C)
D)
E)
South America, 433.4
Africa, 1,154.7
Europe, 705.2
Asia, 5,876.3
Oceania, 37.9
Draw a circle graph.
A)
B)
C)
D)
E)
Unlock Deck
Unlock for access to all 201 flashcards in this deck.
Unlock Deck
k this deck
76
A card is drawn and replaced four times from a deck of 52 cards. What is the probability of getting a 4 of clubs?
A)
B)
C)
D)
E)
A)
B)
C)
D)
E)
Unlock Deck
Unlock for access to all 201 flashcards in this deck.
Unlock Deck
k this deck
77
Draw a circle graph. In 1996, the values, in millions of dollars, of crop output for farms in the United States were as follows: food grains, 11,666
Food crops, 20,065
Cotton, 7,342
Oil crops, 17,703
Tobacco, 4,900
Fruits and tree nuts, 11,593
Vegetables, 14,491
All other, 15,737
A)
B)
C)
D)
Food crops, 20,065
Cotton, 7,342
Oil crops, 17,703
Tobacco, 4,900
Fruits and tree nuts, 11,593
Vegetables, 14,491
All other, 15,737
A)
B)
C)
D)
Unlock Deck
Unlock for access to all 201 flashcards in this deck.
Unlock Deck
k this deck
78
Three out of ten motorcyclists wear safety helmets. If two motorcyclists are chosen, what is the probability that both wear a safety helmet?
A)
B)
C)
D)
E)
A)
B)
C)
D)
E)
Unlock Deck
Unlock for access to all 201 flashcards in this deck.
Unlock Deck
k this deck
79
In 2000 the United States population by age was as follows: under: 15, 22.2%; 15-29, 21%; 30-44, 25.3%; 45-59, 15.8%; 60-74, 10%; 75
And over, 5.7%.
A)
B)
C)
D)
And over, 5.7%.
A)
B)
C)
D)
Unlock Deck
Unlock for access to all 201 flashcards in this deck.
Unlock Deck
k this deck
80
Four dice are rolled. What is the probability of getting 24?
A)
B)
C)
D)
E)
A)
B)
C)
D)
E)
Unlock Deck
Unlock for access to all 201 flashcards in this deck.
Unlock Deck
k this deck
Unlock Deck
Unlock for access to all 201 flashcards in this deck.


