Deck 3: Graphs and Functions
Full screen (f)
Question
Question
Plot the points on a rectangular coordinate system.
A)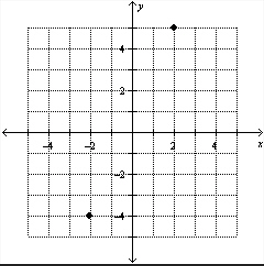
B)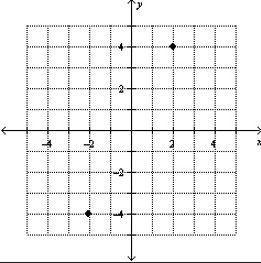
C)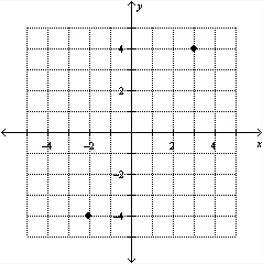
D)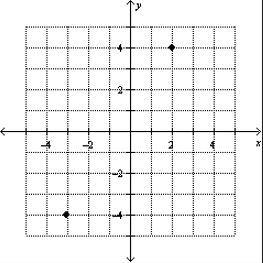
E)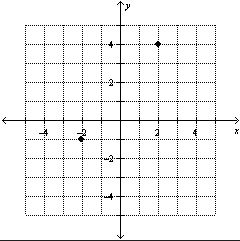
A)
B)
C)
D)
E)
Question
Question
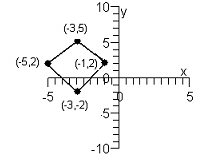
Determine the coordinates of the point labeled 2 . 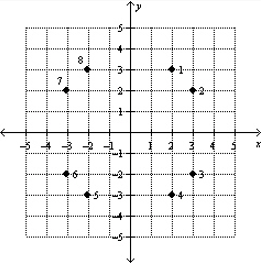
A)
B)
C)
D)
E)
A)
B)
C)
D)
E)
Question
Question
Question
Question
Question
Plot the points on a rectangular coordinate system.
A)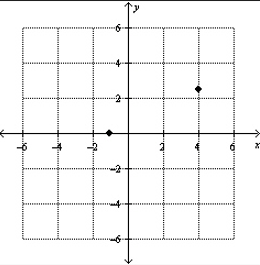
B)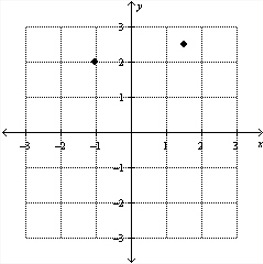
C)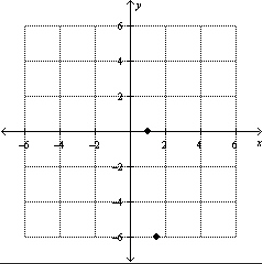
D)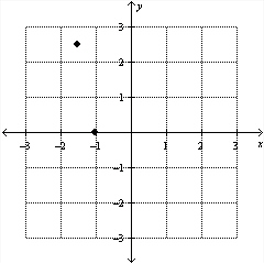
E)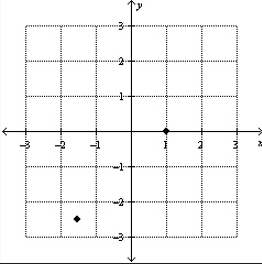
A)
B)
C)
D)
E)
Question
Plot the points and connect them with line segments to form a figure.
A)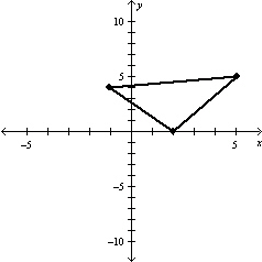
B)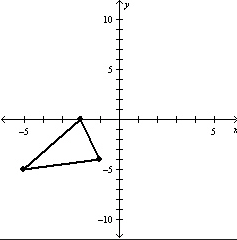
C)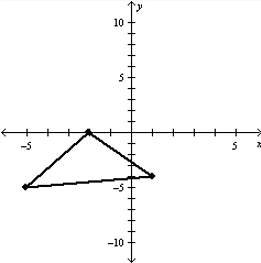
D)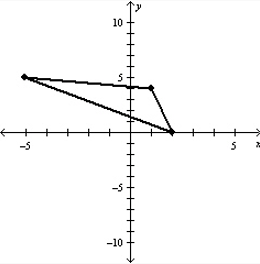
E)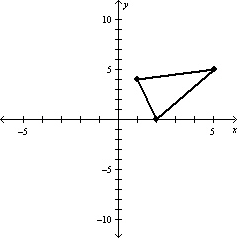
A)
B)
C)
D)
E)
Question
Question
Question
Find the coordinates of the vertices of the figure if it is shifted 3 units to the right and 3 units up.
A)
B)
C)
D)
E)
A)
B)
C)
D)
E)
Question
Question
Plot the points and . Find the square that is obtained by connecting the points with line segments.
A)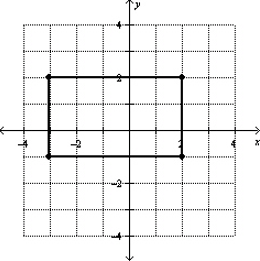
B)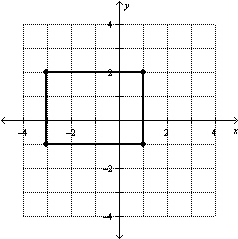
C)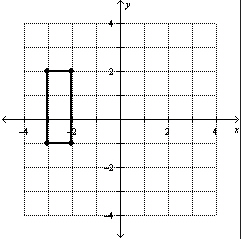
D)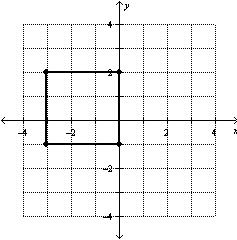
E)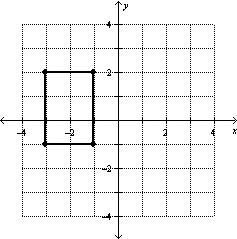
A)
B)
C)
D)
E)
Question
Question
Question
Plot the points and . Find the parallelogram that is obtained by connecting the points with line segments.
A)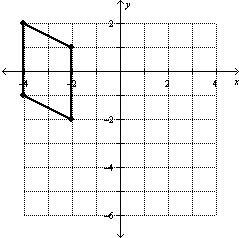
B)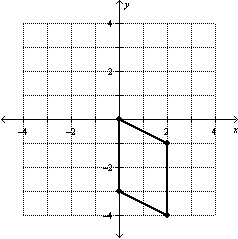
C)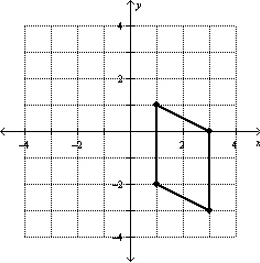
D)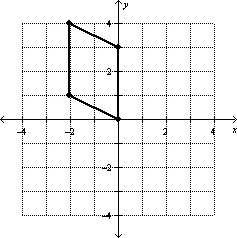
E)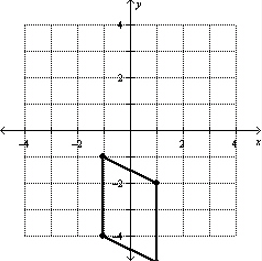
A)
B)
C)
D)
E)
Question
Question
Question
Question
Question
Graph the equation .
A)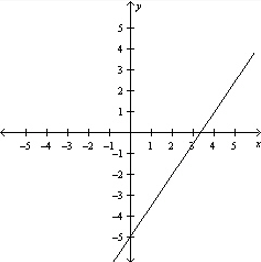
B)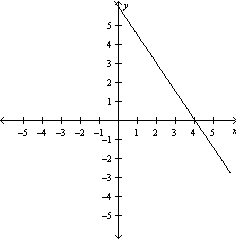
C)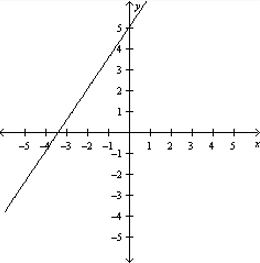
D)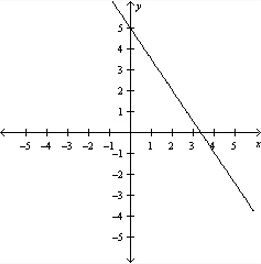
E)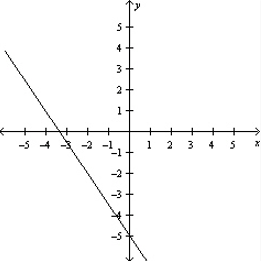
A)
B)
C)
D)
E)
Question
Question
Estimate the x - and y -intercepts of the graph. 
A)x -intercept: y -intercept:
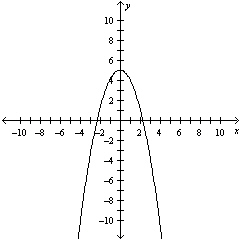
B)x -intercept: y -intercept:
C)x -intercept: y -intercept:
D)x -intercept: y -intercept:
E)x -intercept: y -intercept:
A)x -intercept:
y -intercept: B)x -intercept:
y -intercept: C)x -intercept:
y -intercept: D)x -intercept:
y -intercept: E)x -intercept:
y -intercept: Question
Sketch the graph of the equation and label three points on the graph.
A)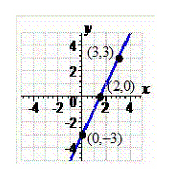
B)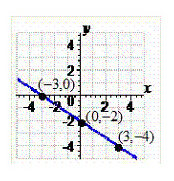
C)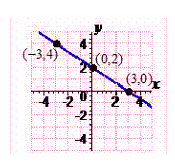
D)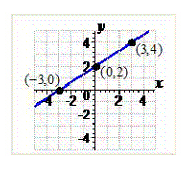
E)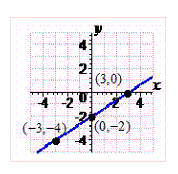
A)
B)
C)
D)
E)
Question
Graph the equation .
A)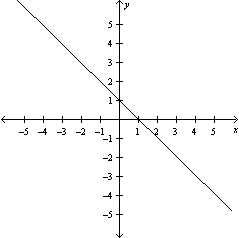
B)
C)
D)
E)
A)
B)
C)
D)
E)
Question
Match the correct equation with the given graph. 
A)
B)
C)
D)
E)
A)
B)
C)
D)
E)
Question
Use a graphing calculator (with a standard viewing window)to graph the equation .
A)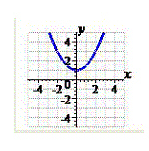
B)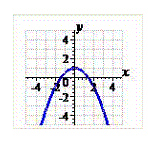
C)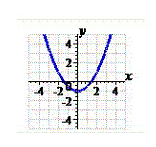
D)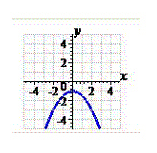
E)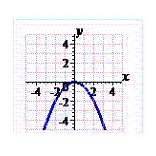
A)
B)
C)
D)
E)
Question
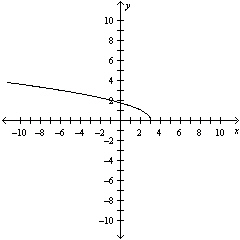
Graphically estimate the x- and y- intercepts, if any, of the graph. 
A)x- intercept at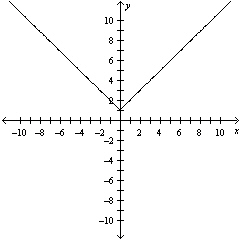 , y- intercept at
B)x- intercept at , no y- intercepts
C)no x- intercepts, y- intercept at
D)x- intercept at , y- intercept at
E)no intercepts
A)x- intercept at
, y- intercept at B)x- intercept at
, no y- interceptsC)no x- intercepts, y- intercept at
D)x- intercept at
, y- intercept at E)no intercepts
Question
Compete the table and use the results to sketch the graph of the equation .
A)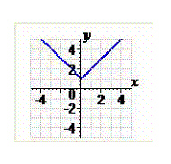
B)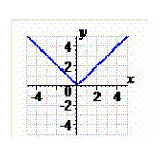
C)
D)
E)
A)
B)
C)
D)
E)
Question
Use a graphing calculator (with a standard viewing window)to graph the equation .
A)
B)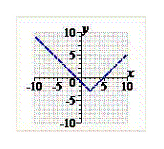
C)
D)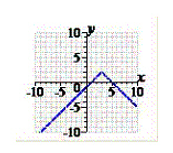
E)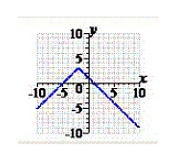
A)
B)
C)
D)
E)
Question
Match the correct equation with the given graph. 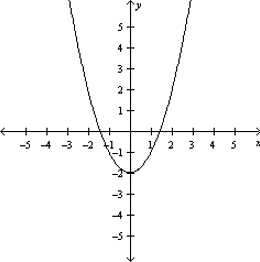
A)
B)
C)
D)
E)
A)
B)
C)
D)
E)
Question
A football quarterback throws a pass from the  -yardline,
  yards from the sideline. The pass is caught by the wide receiver at the
  -yardline,
  yards from the same sideline. How long is the pass (in yards)? Round your answer to two decimal places.
A) yards
yards
B) yards
yards
C) yards
yards
D) yards
yards
E) yards
yards
-yardline, yards from the sideline. The pass is caught by the wide receiver at the -yardline, yards from the same sideline. How long is the pass (in yards)? Round your answer to two decimal places.A)
yardsB)
yardsC)
yardsD)
yardsE)
yards Question
Question
Graph the equation .
A)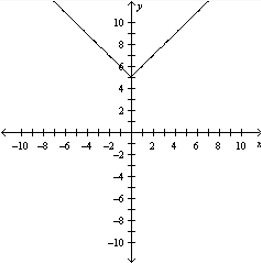
B)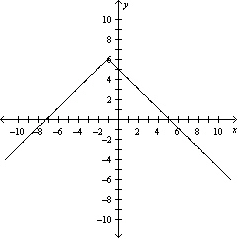
C)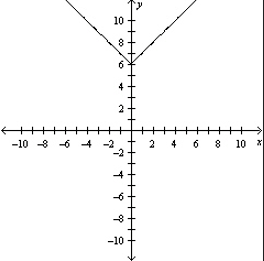
D)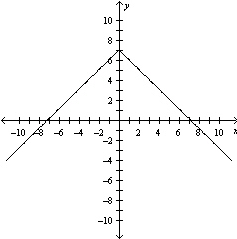
E)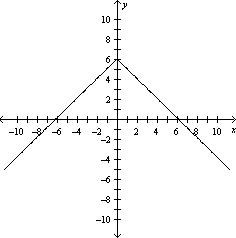
A)
B)
C)
D)
E)
Question
Compete the table and use the results to sketch the graph of the equation
A)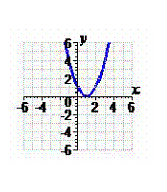
B)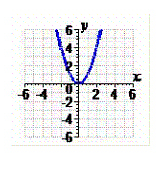
C)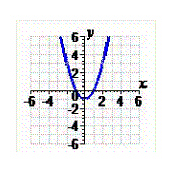
D)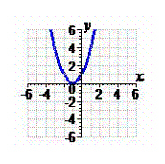
E)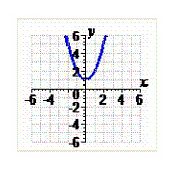
A)
B)
C)
D)
E)
Question
Question
Estimate the x - and y -intercepts of the graph. 
A)x -intercept: ,
,  y -intercept:
B)x -intercept: y -intercept:
  ,
, 
C)x -intercept: y -intercept:
D)x -intercept: y -intercept:
  ,
, 
E)x -intercept: ,
,  y -intercept:
A)x -intercept:
, y -intercept: B)x -intercept:
y -intercept: , C)x -intercept:
y -intercept: D)x -intercept:
y -intercept: , E)x -intercept:
, y -intercept: Question
Question
Sketch the graph of .
A)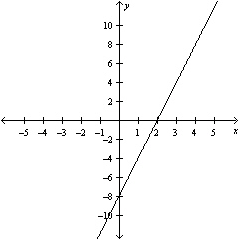
B)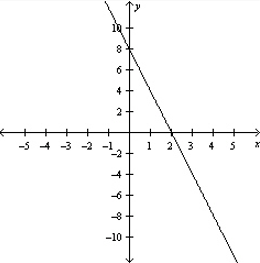
C)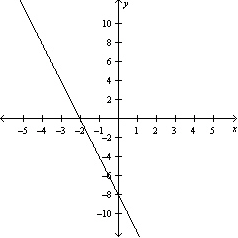
D)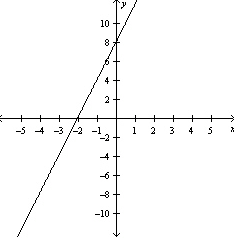
E)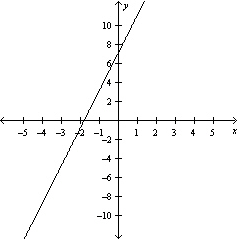
A)
B)
C)
D)
E)
Question
Question
Question
Question
Question
Sketch the graph of the equation and label three points on the graph.
A)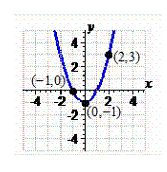
B)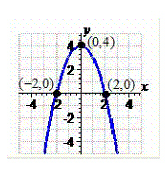
C)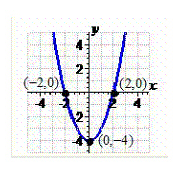
D)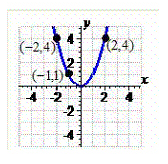
E)
A)
B)
C)
D)
E)
Question
A manufacturing plant purchases a new molding machine for . The depreciated value y after t years is given by , . Sketch the graph of this model.
A)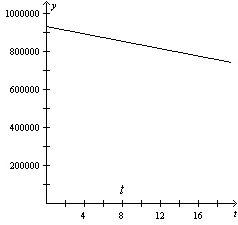
B)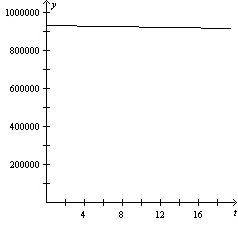
C)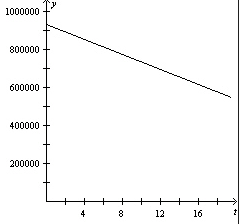
D)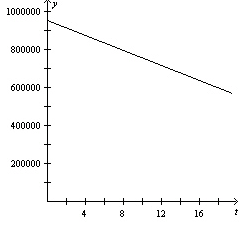
E)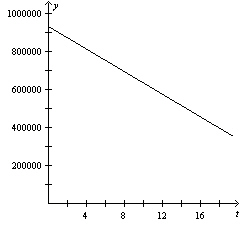
A)
B)
C)
D)
E)
Question
Identify the line in the figure that has slope  .
. 
A)
B)
C)
D)
E)none
. A)
B)
C)
D)
E)none
Question
Question
Sketch the graph of the equation and label three points on the graph.
A)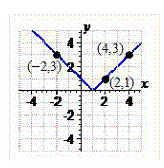
B)
C)
D)
E)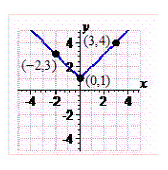
A)
B)
C)
D)
E)
Question
Sketch the graph of the line . Then find the slope of the line.
A)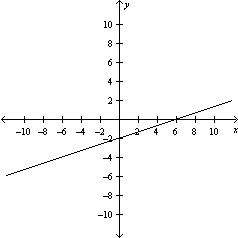
B)
C)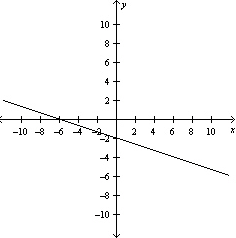
D)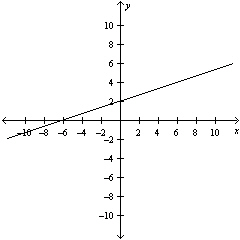
E)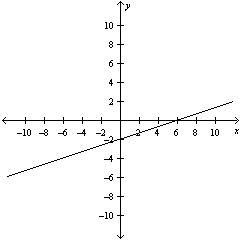
A)
B)
C)
D)
E)
Question
Question
Question
Your company purchases a new delivery van for . For tax purposes, the van will be depreciated over a seven year period. At the end of seven years, the value of the van is expected to be $5000 . The equation relating the depreciated value of the van, y , to the number of years, t , since it was purchased is given by . Sketch a graph of this equation.
A)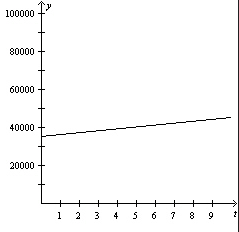
B)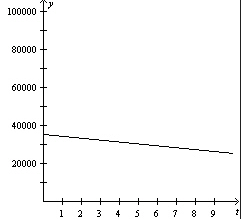
C)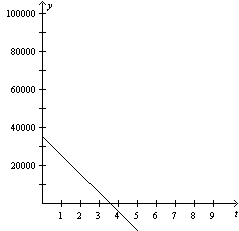
D)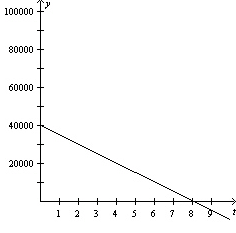
E)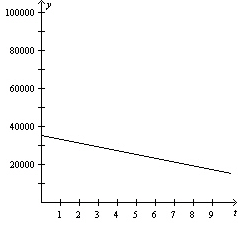
A)
B)
C)
D)
E)
Question
Question
Sketch the graph of .
A)
B)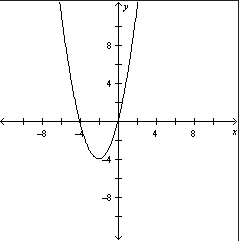
C)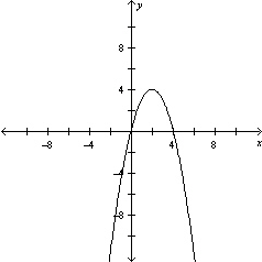
D)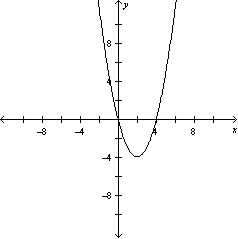
E)
A)
B)
C)
D)
E)
Question
Question
Your company purchases a new delivery van for . For tax purposes, the van will be depreciated over a seven year period. At the end of seven years, the value of the van is expected to be $9000 . The graph relating the depreciated value of the van, y , to the number of years, t , since it was purchased is shown below. What is the y- intercept of the graph, if any? 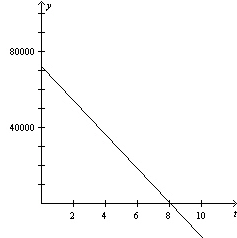
A) 53,000
B) 72,000
C)
D)
E)no y- intercept
A) 53,000
B) 72,000
C)
D)
E)no y- intercept
Question
Question
Estimate the slope of the line from the graph given below. 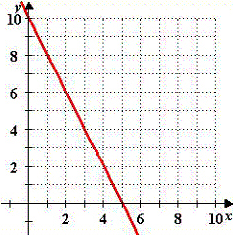
A)-3
B)-2
C)
D) -
E)2
A)-3
B)-2
C)
D) -
E)2
Question
Question
Question
Match the equation with its graph.
A)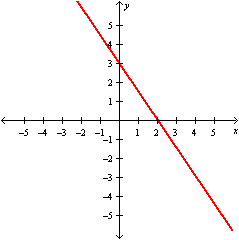
B)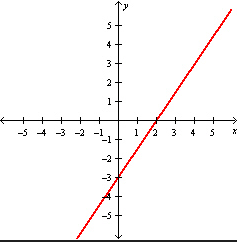
C)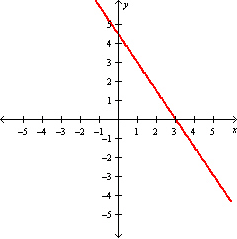
D)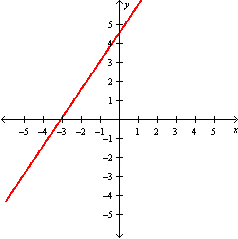
E)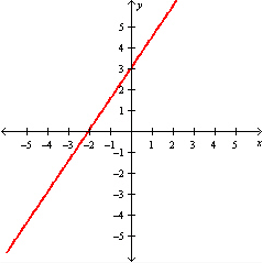
A)
B)
C)
D)
E)
Question
Sketch the graph of the line by plotting the x - and y -intercepts.
A)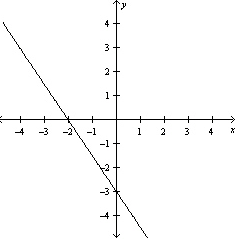
B)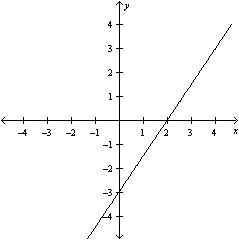
C)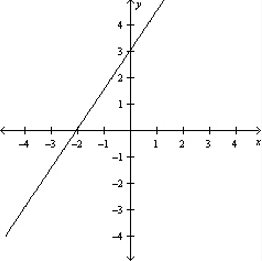
D)
E)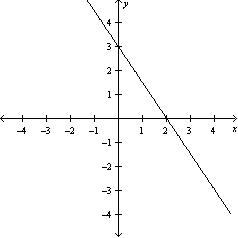
A)
B)
C)
D)
E)
Question
Question
Question
Question
Question
Question
Question
Question
Question
Question
Question
Question
Sketch the graph of the line through the point (1, 2)with slope  .
.
A)
B)
C)
D)
E)
.A)
B)
C)
D)
E)
Question
Question
The slope, or pitch, of a roof is such that is rises (or falls)6 feet for every 5 feet of horizontal distance. Determine the maximum height of the attic for a 30-foot wide house. Round your answer to two decimal places. 
A)36.00 feet
B)12.50 feet
C)15.00 feet
D)19.20 feet
E)18.00 feet
A)36.00 feet
B)12.50 feet
C)15.00 feet
D)19.20 feet
E)18.00 feet
Question
Question

Unlock Deck
Sign up to unlock the cards in this deck!
Unlock Deck
Unlock Deck
1/162
Play
Full screen (f)
Deck 3: Graphs and Functions
1
Determine the quadrant in which the point is located without plotting the point.
A)Quadrant III
B)Quadrant IV
C)Quadrant I
D)Quadrant II
A)Quadrant III
B)Quadrant IV
C)Quadrant I
D)Quadrant II
Quadrant IV
2
Plot the points on a rectangular coordinate system.
A)
B)
C)
D)
E)
A)
B)
C)
D)
E)
3
Find the distance between and . Round your answer to two decimal places.
A) 19.72
B) 45.65
C) 3.61
D) 22.83
E) 11.87
A) 19.72
B) 45.65
C) 3.61
D) 22.83
E) 11.87
22.83
4
Determine the coordinates of the point labeled 2 .
A)
B)
C)
D)
E)
A)
B)
C)
D)
E)
Unlock Deck
Unlock for access to all 162 flashcards in this deck.
Unlock Deck
k this deck
5
Determine all possible quadrants in which the point can be located. Assume and .
A)Quadrants
B)Quadrants II and III
C)Quadrants
D)All quadrants
E)Quadrants I and II
A)Quadrants
B)Quadrants II and III
C)Quadrants
D)All quadrants
E)Quadrants I and II
Unlock Deck
Unlock for access to all 162 flashcards in this deck.
Unlock Deck
k this deck
6
A right triangle has vertices at and . Find the length of the three line segments, AB , BC , AC . Round your answer to two decimal places.
A)
B)
C)
D)
E)
A)
B)
C)
D)
E)
Unlock Deck
Unlock for access to all 162 flashcards in this deck.
Unlock Deck
k this deck
7
Find the distance between and .
A) 4
B) 24
C)
D) 12
E)
A) 4
B) 24
C)
D) 12
E)
Unlock Deck
Unlock for access to all 162 flashcards in this deck.
Unlock Deck
k this deck
8
Find the coordinates of the point located 9 units to the right of the y -axis and 2 units above the x -axis.
A)
B)
C)
D)
E)
A)
B)
C)
D)
E)
Unlock Deck
Unlock for access to all 162 flashcards in this deck.
Unlock Deck
k this deck
9
Plot the points on a rectangular coordinate system.
A)
B)
C)
D)
E)
A)
B)
C)
D)
E)
Unlock Deck
Unlock for access to all 162 flashcards in this deck.
Unlock Deck
k this deck
10
Plot the points and connect them with line segments to form a figure.
A)
B)
C)
D)
E)
A)
B)
C)
D)
E)
Unlock Deck
Unlock for access to all 162 flashcards in this deck.
Unlock Deck
k this deck
11
Use the Distance Formula to determine whether the points and are collinear.
A)
B)
A)
B)
Unlock Deck
Unlock for access to all 162 flashcards in this deck.
Unlock Deck
k this deck
12
Find the perimeter of the triangle with the vertices and . Round your answer to two decimal places.
A) 17.71
B) 22.01
C) 24.71
D) 18.01
E) 19.71
A) 17.71
B) 22.01
C) 24.71
D) 18.01
E) 19.71
Unlock Deck
Unlock for access to all 162 flashcards in this deck.
Unlock Deck
k this deck
13
Find the coordinates of the vertices of the figure if it is shifted 3 units to the right and 3 units up.
A)
B)
C)
D)
E)
A)
B)
C)
D)
E)
Unlock Deck
Unlock for access to all 162 flashcards in this deck.
Unlock Deck
k this deck
14
Determine all possible quadrants in which the point can be located. Assume . y is a real number
A)Quadrants I and II
B)Quadrants III and IV
C)Quadrants IV and I
D)Quadrants II and III
E)Quadrants II and IV
A)Quadrants I and II
B)Quadrants III and IV
C)Quadrants IV and I
D)Quadrants II and III
E)Quadrants II and IV
Unlock Deck
Unlock for access to all 162 flashcards in this deck.
Unlock Deck
k this deck
15
Plot the points and . Find the square that is obtained by connecting the points with line segments.
A)
B)
C)
D)
E)
A)
B)
C)
D)
E)
Unlock Deck
Unlock for access to all 162 flashcards in this deck.
Unlock Deck
k this deck
16
Find the coordinates of the point located 2 units to the left of the y -axis and 9 units above the x -axis.
A)
B)
C)
D)
E)
A)
B)
C)
D)
E)
Unlock Deck
Unlock for access to all 162 flashcards in this deck.
Unlock Deck
k this deck
17
Determine which of the ordered pairs is a solution of the equation.
A)
B)
C)
D)
E)
A)
B)
C)
D)
E)
Unlock Deck
Unlock for access to all 162 flashcards in this deck.
Unlock Deck
k this deck
18
Plot the points and . Find the parallelogram that is obtained by connecting the points with line segments.
A)
B)
C)
D)
E)
A)
B)
C)
D)
E)
Unlock Deck
Unlock for access to all 162 flashcards in this deck.
Unlock Deck
k this deck
19
Determine which of the ordered pairs is a solution of the equation.
A)
B)
C)
D)
E)
A)
B)
C)
D)
E)
Unlock Deck
Unlock for access to all 162 flashcards in this deck.
Unlock Deck
k this deck
20
Determine the quadrant in which the point is located without plotting the point.
A)Quadrant III
B)Quadrant II
C)Quadrant I
D)Quadrant IV
A)Quadrant III
B)Quadrant II
C)Quadrant I
D)Quadrant IV
Unlock Deck
Unlock for access to all 162 flashcards in this deck.
Unlock Deck
k this deck
21
Find the x- and y- intercepts, if any, of .
A)x- intercept at 0 , y- intercept at -2
B)x- intercept at , y- intercept at 2
C)x- intercept at -2 , y- intercept at -2
D)x- intercept at , y- intercept at -2
E)no intercepts
A)x- intercept at 0 , y- intercept at -2
B)x- intercept at , y- intercept at 2
C)x- intercept at -2 , y- intercept at -2
D)x- intercept at , y- intercept at -2
E)no intercepts
Unlock Deck
Unlock for access to all 162 flashcards in this deck.
Unlock Deck
k this deck
22
Find the x - and y -intercepts of the graph of the equation .
A)x -intercept: y -intercept: 9
B)x -intercept: - y -intercept: 9
C)x -intercept: -7 y -intercept: 9
D)x -intercept: 7 y -intercept: 9
E)x -intercept: 9 y -intercept:
A)x -intercept: y -intercept: 9
B)x -intercept: - y -intercept: 9
C)x -intercept: -7 y -intercept: 9
D)x -intercept: 7 y -intercept: 9
E)x -intercept: 9 y -intercept:
Unlock Deck
Unlock for access to all 162 flashcards in this deck.
Unlock Deck
k this deck
23
Graph the equation .
A)
B)
C)
D)
E)
A)
B)
C)
D)
E)
Unlock Deck
Unlock for access to all 162 flashcards in this deck.
Unlock Deck
k this deck
24
Find the midpoint of the line segment joining the points and .
A)
B)
C)
D)
E)
A)
B)
C)
D)
E)
Unlock Deck
Unlock for access to all 162 flashcards in this deck.
Unlock Deck
k this deck
25
Estimate the x - and y -intercepts of the graph.
A)x -intercept: y -intercept:
B)x -intercept: y -intercept:
C)x -intercept: y -intercept:
D)x -intercept: y -intercept:
E)x -intercept: y -intercept:
A)x -intercept:
y -intercept: B)x -intercept:
y -intercept: C)x -intercept:
y -intercept: D)x -intercept:
y -intercept: E)x -intercept:
y -intercept: Unlock Deck
Unlock for access to all 162 flashcards in this deck.
Unlock Deck
k this deck
26
Sketch the graph of the equation and label three points on the graph.
A)
B)
C)
D)
E)
A)
B)
C)
D)
E)
Unlock Deck
Unlock for access to all 162 flashcards in this deck.
Unlock Deck
k this deck
27
Graph the equation .
A)
B)
C)
D)
E)
A)
B)
C)
D)
E)
Unlock Deck
Unlock for access to all 162 flashcards in this deck.
Unlock Deck
k this deck
28
Match the correct equation with the given graph.
A)
B)
C)
D)
E)
A)
B)
C)
D)
E)
Unlock Deck
Unlock for access to all 162 flashcards in this deck.
Unlock Deck
k this deck
29
Use a graphing calculator (with a standard viewing window)to graph the equation .
A)
B)
C)
D)
E)
A)
B)
C)
D)
E)
Unlock Deck
Unlock for access to all 162 flashcards in this deck.
Unlock Deck
k this deck
30
Graphically estimate the x- and y- intercepts, if any, of the graph.
A)x- intercept at , y- intercept at
B)x- intercept at , no y- intercepts
C)no x- intercepts, y- intercept at
D)x- intercept at , y- intercept at
E)no intercepts
A)x- intercept at
, y- intercept at B)x- intercept at
, no y- interceptsC)no x- intercepts, y- intercept at
D)x- intercept at
, y- intercept at E)no intercepts
Unlock Deck
Unlock for access to all 162 flashcards in this deck.
Unlock Deck
k this deck
31
Compete the table and use the results to sketch the graph of the equation .
A)
B)
C)
D)
E)
A)
B)
C)
D)
E)
Unlock Deck
Unlock for access to all 162 flashcards in this deck.
Unlock Deck
k this deck
32
Use a graphing calculator (with a standard viewing window)to graph the equation .
A)
B)
C)
D)
E)
A)
B)
C)
D)
E)
Unlock Deck
Unlock for access to all 162 flashcards in this deck.
Unlock Deck
k this deck
33
Match the correct equation with the given graph.
A)
B)
C)
D)
E)
A)
B)
C)
D)
E)
Unlock Deck
Unlock for access to all 162 flashcards in this deck.
Unlock Deck
k this deck
34
A football quarterback throws a pass from the -yardline, yards from the sideline. The pass is caught by the wide receiver at the -yardline, yards from the same sideline. How long is the pass (in yards)? Round your answer to two decimal places.
A) yards
B) yards
C) yards
D) yards
E) yards
-yardline, yards from the sideline. The pass is caught by the wide receiver at the -yardline, yards from the same sideline. How long is the pass (in yards)? Round your answer to two decimal places.A)
yardsB)
yardsC)
yardsD)
yardsE)
yards Unlock Deck
Unlock for access to all 162 flashcards in this deck.
Unlock Deck
k this deck
35
Find the x - and y -intercepts of the graph of the equation .
A)x -intercept: 2 y -intercept: 4
B)x -intercept: 28 y -intercept: -14
C)x -intercept: -14 y -intercept: 28
D)x -intercept: 14 y -intercept: 28
E)x -intercept: -28 y -intercept: -14
A)x -intercept: 2 y -intercept: 4
B)x -intercept: 28 y -intercept: -14
C)x -intercept: -14 y -intercept: 28
D)x -intercept: 14 y -intercept: 28
E)x -intercept: -28 y -intercept: -14
Unlock Deck
Unlock for access to all 162 flashcards in this deck.
Unlock Deck
k this deck
36
Graph the equation .
A)
B)
C)
D)
E)
A)
B)
C)
D)
E)
Unlock Deck
Unlock for access to all 162 flashcards in this deck.
Unlock Deck
k this deck
37
Compete the table and use the results to sketch the graph of the equation
A)
B)
C)
D)
E)
A)
B)
C)
D)
E)
Unlock Deck
Unlock for access to all 162 flashcards in this deck.
Unlock Deck
k this deck
38
Find the x- and y- intercepts, if any, of .
A)x- intercept at -45 , y- intercept at 18
B)x- intercept at 18 , y- intercept at 45
C)x- intercept at 45 , y- intercept at 18
D)x- intercept at -18, y- intercept at 45
E)no intercepts
A)x- intercept at -45 , y- intercept at 18
B)x- intercept at 18 , y- intercept at 45
C)x- intercept at 45 , y- intercept at 18
D)x- intercept at -18, y- intercept at 45
E)no intercepts
Unlock Deck
Unlock for access to all 162 flashcards in this deck.
Unlock Deck
k this deck
39
Estimate the x - and y -intercepts of the graph.
A)x -intercept: , y -intercept:
B)x -intercept: y -intercept: ,
C)x -intercept: y -intercept:
D)x -intercept: y -intercept: ,
E)x -intercept: , y -intercept:
A)x -intercept:
, y -intercept: B)x -intercept:
y -intercept: , C)x -intercept:
y -intercept: D)x -intercept:
y -intercept: , E)x -intercept:
, y -intercept: Unlock Deck
Unlock for access to all 162 flashcards in this deck.
Unlock Deck
k this deck
40
Find the x- and y- intercepts, if any, of .
A)x- intercept at , y- intercept at -7
B)x- intercept at -7 , y- intercept at -7
C)x- intercept at 10 , -4 , y- intercept at -4
D)x- intercept at , y- intercept at
E)no intercepts
A)x- intercept at , y- intercept at -7
B)x- intercept at -7 , y- intercept at -7
C)x- intercept at 10 , -4 , y- intercept at -4
D)x- intercept at , y- intercept at
E)no intercepts
Unlock Deck
Unlock for access to all 162 flashcards in this deck.
Unlock Deck
k this deck
41
Sketch the graph of .
A)
B)
C)
D)
E)
A)
B)
C)
D)
E)
Unlock Deck
Unlock for access to all 162 flashcards in this deck.
Unlock Deck
k this deck
42
Use the formula for slope to find the value of y such that the line through the points (1,-4) and (0,y) has slope of m=-2 .
A) y=4
B) y=-4
C) y=-2
D) y=2
E)
A) y=4
B) y=-4
C) y=-2
D) y=2
E)
Unlock Deck
Unlock for access to all 162 flashcards in this deck.
Unlock Deck
k this deck
43
Find the slope (if possible)of the line passing through the points and .
A)
B)
C) -
D) -
E)not possible
A)
B)
C) -
D) -
E)not possible
Unlock Deck
Unlock for access to all 162 flashcards in this deck.
Unlock Deck
k this deck
44
Find the slope (if possible)of the line passing through the points (-6,2) and .
A)
B)8
C)-8
D)
E)not possible
A)
B)8
C)-8
D)
E)not possible
Unlock Deck
Unlock for access to all 162 flashcards in this deck.
Unlock Deck
k this deck
45
Find the slope of the line passing through points and .
A)
B)
C)
D) -
E) 5
A)
B)
C)
D) -
E) 5
Unlock Deck
Unlock for access to all 162 flashcards in this deck.
Unlock Deck
k this deck
46
Sketch the graph of the equation and label three points on the graph.
A)
B)
C)
D)
E)
A)
B)
C)
D)
E)
Unlock Deck
Unlock for access to all 162 flashcards in this deck.
Unlock Deck
k this deck
47
A manufacturing plant purchases a new molding machine for . The depreciated value y after t years is given by , . Sketch the graph of this model.
A)
B)
C)
D)
E)
A)
B)
C)
D)
E)
Unlock Deck
Unlock for access to all 162 flashcards in this deck.
Unlock Deck
k this deck
48
Identify the line in the figure that has slope .
A)
B)
C)
D)
E)none
. A)
B)
C)
D)
E)none
Unlock Deck
Unlock for access to all 162 flashcards in this deck.
Unlock Deck
k this deck
49
State if the line passing through the points and rises, falls, is horizontal, or is vertical.
A)The line passing through the points and falls.
B)The line passing through the points and vertical.
C)The line passing through the points and horizontal.
D)The line passing through the points and rises.
A)The line passing through the points and falls.
B)The line passing through the points and vertical.
C)The line passing through the points and horizontal.
D)The line passing through the points and rises.
Unlock Deck
Unlock for access to all 162 flashcards in this deck.
Unlock Deck
k this deck
50
Sketch the graph of the equation and label three points on the graph.
A)
B)
C)
D)
E)
A)
B)
C)
D)
E)
Unlock Deck
Unlock for access to all 162 flashcards in this deck.
Unlock Deck
k this deck
51
Sketch the graph of the line . Then find the slope of the line.
A)
B)
C)
D)
E)
A)
B)
C)
D)
E)
Unlock Deck
Unlock for access to all 162 flashcards in this deck.
Unlock Deck
k this deck
52
The table shows the projected number N (in millions)of persons with pets in a certain country. A model for this data is where t represents time in years, with corresponding to the year 2010. According to the model, in what year will the number of pet owners exceed million?
A)
B)
C)
D)
E)
A)
B)
C)
D)
E)
Unlock Deck
Unlock for access to all 162 flashcards in this deck.
Unlock Deck
k this deck
53
State if the line passing through the points and rises, falls, is horizontal, or is vertical.
A)The line passing through the points and rises.
B)The line passing through the points and horizontal.
C)The line passing through the points and falls.
D)The line passing through the points and vertical.
A)The line passing through the points and rises.
B)The line passing through the points and horizontal.
C)The line passing through the points and falls.
D)The line passing through the points and vertical.
Unlock Deck
Unlock for access to all 162 flashcards in this deck.
Unlock Deck
k this deck
54
Your company purchases a new delivery van for . For tax purposes, the van will be depreciated over a seven year period. At the end of seven years, the value of the van is expected to be $5000 . The equation relating the depreciated value of the van, y , to the number of years, t , since it was purchased is given by . Sketch a graph of this equation.
A)
B)
C)
D)
E)
A)
B)
C)
D)
E)
Unlock Deck
Unlock for access to all 162 flashcards in this deck.
Unlock Deck
k this deck
55
State if the line passing through the points and rises, falls, is horizontal, or is vertical.
A)The line passing through the points and vertical.
B)The line passing through the points and horizontal.
C)The line passing through the points and rises.
D)The line passing through the points and falls.
A)The line passing through the points and vertical.
B)The line passing through the points and horizontal.
C)The line passing through the points and rises.
D)The line passing through the points and falls.
Unlock Deck
Unlock for access to all 162 flashcards in this deck.
Unlock Deck
k this deck
56
Sketch the graph of .
A)
B)
C)
D)
E)
A)
B)
C)
D)
E)
Unlock Deck
Unlock for access to all 162 flashcards in this deck.
Unlock Deck
k this deck
57
Find the slope of the line passing through points (0,0) and (-5,-8) .
A)
B)
C)
D)
E)
A)
B)
C)
D)
E)
Unlock Deck
Unlock for access to all 162 flashcards in this deck.
Unlock Deck
k this deck
58
Your company purchases a new delivery van for . For tax purposes, the van will be depreciated over a seven year period. At the end of seven years, the value of the van is expected to be $9000 . The graph relating the depreciated value of the van, y , to the number of years, t , since it was purchased is shown below. What is the y- intercept of the graph, if any?
A) 53,000
B) 72,000
C)
D)
E)no y- intercept
A) 53,000
B) 72,000
C)
D)
E)no y- intercept
Unlock Deck
Unlock for access to all 162 flashcards in this deck.
Unlock Deck
k this deck
59
Your company purchases a new delivery van for . For tax purposes, the van will be depreciated over a seven year period. At the end of seven years, the value of the van is expected to be $7000 . Find a linear equation that relates the depreciated value of the van, y , to the number of years, t , since it was purchased.
A)
B)
C)
D)
E)
A)
B)
C)
D)
E)
Unlock Deck
Unlock for access to all 162 flashcards in this deck.
Unlock Deck
k this deck
60
Estimate the slope of the line from the graph given below.
A)-3
B)-2
C)
D) -
E)2
A)-3
B)-2
C)
D) -
E)2
Unlock Deck
Unlock for access to all 162 flashcards in this deck.
Unlock Deck
k this deck
61
Write the equation of the line that passes through the point (1,-1) and has slope m=5 . Write the equation in general form.
A)
B)
C)
D)
E)
A)
B)
C)
D)
E)
Unlock Deck
Unlock for access to all 162 flashcards in this deck.
Unlock Deck
k this deck
62
Write the equation of the line that passes through the point and has slope . Write the equation in general form.
A)
B)
C)
D)
E)
A)
B)
C)
D)
E)
Unlock Deck
Unlock for access to all 162 flashcards in this deck.
Unlock Deck
k this deck
63
Match the equation with its graph.
A)
B)
C)
D)
E)
A)
B)
C)
D)
E)
Unlock Deck
Unlock for access to all 162 flashcards in this deck.
Unlock Deck
k this deck
64
Sketch the graph of the line by plotting the x - and y -intercepts.
A)
B)
C)
D)
E)
A)
B)
C)
D)
E)
Unlock Deck
Unlock for access to all 162 flashcards in this deck.
Unlock Deck
k this deck
65
Determine whether the lines and are parallel, perpendicular, or neither.
A)neither
B)parallel
C)perpendicular
A)neither
B)parallel
C)perpendicular
Unlock Deck
Unlock for access to all 162 flashcards in this deck.
Unlock Deck
k this deck
66
Use the formula for slope to find the value of y such that the line through the points (-2,2) and (1,y) has slope of m= .
A) y=-2
B) y=2
C) y=6
D) y=5
E)
A) y=-2
B) y=2
C) y=6
D) y=5
E)
Unlock Deck
Unlock for access to all 162 flashcards in this deck.
Unlock Deck
k this deck
67
Determine which of the lines and passing through the indicated pairs of points are parallel.
A)
B)
C)
D)all are parallel
E)none are parallel
A)
B)
C)
D)all are parallel
E)none are parallel
Unlock Deck
Unlock for access to all 162 flashcards in this deck.
Unlock Deck
k this deck
68
Determine which of the lines and passing through the indicated pairs of points are perpendicular.
A)
B)
C)
D)all are perpendicular
E)none are perpendicular
A)
B)
C)
D)all are perpendicular
E)none are perpendicular
Unlock Deck
Unlock for access to all 162 flashcards in this deck.
Unlock Deck
k this deck
69
Write the equation in slope-intercept form.
A)
B)
C)
D)
E)
A)
B)
C)
D)
E)
Unlock Deck
Unlock for access to all 162 flashcards in this deck.
Unlock Deck
k this deck
70
The point (1,2) is on a line with undefined slope. Find two additional points on the line.
A) (2,1) and (0,3)
B) (1,0) and (1,0)
C) (2,3) and (0,1)
D) (2,1) and
E) and
A) (2,1) and (0,3)
B) (1,0) and (1,0)
C) (2,3) and (0,1)
D) (2,1) and
E) and
Unlock Deck
Unlock for access to all 162 flashcards in this deck.
Unlock Deck
k this deck
71
Write in slope-intercept form.
A)
B)
C)
D)
E)
A)
B)
C)
D)
E)
Unlock Deck
Unlock for access to all 162 flashcards in this deck.
Unlock Deck
k this deck
72
Write in slope-intercept form.
A)
B)
C)
D)
E)
A)
B)
C)
D)
E)
Unlock Deck
Unlock for access to all 162 flashcards in this deck.
Unlock Deck
k this deck
73
Write an equation of the line that passes through and has a slope of .
A)
B)
C)
D)
E)
A)
B)
C)
D)
E)
Unlock Deck
Unlock for access to all 162 flashcards in this deck.
Unlock Deck
k this deck
74
Write the equation in slope-intercept form.
A)
B)
C)
D)
E)
A)
B)
C)
D)
E)
Unlock Deck
Unlock for access to all 162 flashcards in this deck.
Unlock Deck
k this deck
75
Write an equation in slope-intercept form of the line that passes through the point (0,9) and has a slope of .
A)
B)
C)
D)
E)
A)
B)
C)
D)
E)
Unlock Deck
Unlock for access to all 162 flashcards in this deck.
Unlock Deck
k this deck
76
Sketch the graph of the line through the point (1, 2)with slope .
A)
B)
C)
D)
E)
.A)
B)
C)
D)
E)
Unlock Deck
Unlock for access to all 162 flashcards in this deck.
Unlock Deck
k this deck
77
An access ramp to a freeway extends horizontally a distance of 280 feet while it rises a total of 10 feet. Find the slope of the access ramp.
A)270
B)
C) 28
D)290
E)
A)270
B)
C) 28
D)290
E)
Unlock Deck
Unlock for access to all 162 flashcards in this deck.
Unlock Deck
k this deck
78
The slope, or pitch, of a roof is such that is rises (or falls)6 feet for every 5 feet of horizontal distance. Determine the maximum height of the attic for a 30-foot wide house. Round your answer to two decimal places.
A)36.00 feet
B)12.50 feet
C)15.00 feet
D)19.20 feet
E)18.00 feet
A)36.00 feet
B)12.50 feet
C)15.00 feet
D)19.20 feet
E)18.00 feet
Unlock Deck
Unlock for access to all 162 flashcards in this deck.
Unlock Deck
k this deck
79
State the slope and a point on the graph for the point-slope equation .
A) 6 ;
B) 6 ;
C) 7 ;
D) ;
E) ;
A) 6 ;
B) 6 ;
C) 7 ;
D) ;
E) ;
Unlock Deck
Unlock for access to all 162 flashcards in this deck.
Unlock Deck
k this deck
80
The point (-4,-3) is on a line with slope 3. Find two additional points on the line.
A) (-3,0) and (-5,-6)
B) (-1,-2) and (-7,-4)
C) (-7,-4) and (-10,-4)
D) and
E) and
A) (-3,0) and (-5,-6)
B) (-1,-2) and (-7,-4)
C) (-7,-4) and (-10,-4)
D) and
E) and
Unlock Deck
Unlock for access to all 162 flashcards in this deck.
Unlock Deck
k this deck
Unlock Deck
Unlock for access to all 162 flashcards in this deck.


