Deck 10: Statistics
Full screen (f)
Question
The following line graph shows the expenses for two salespeople of the Leadwell Pencil Company. 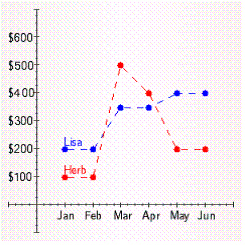 Which salesperson has more variability in his or her expenses?
A) The variability is the same.
B) Lisa
C) There is no way to tell from this graph.
D) Herb
Which salesperson has more variability in his or her expenses?A) The variability is the same.
B) Lisa
C) There is no way to tell from this graph.
D) Herb
Question
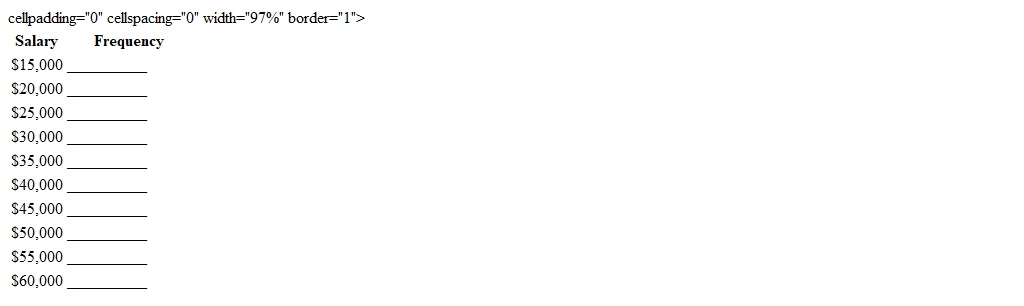
The wages of employees of a small accounting firm are as follows:  Find the frequency distribution for the following groupings of the salaries: $1-$20,000 $20,001-$30,000 $30,001-$40,000 $40,001-$50,000 Over $50,000. Select the correct answer.
A) $1-$20,000: 7 $20,001-$30,000: 3
$30,001-$40,000: 1
$40,001-$50,000: 2
Over $50,000: 0
B) $1-$20,000: 7 $20,001-$30,000: 3
$30,001-$40,000: 1
$40,001-$50,000: 1
Over $50,000: 1
C) $1-$20,000: 6 $20,001-$30,000: 3
$30,001-$40,000: 1
$40,001-$50,000: 2
Over $50,000: 1
D) $1-$20,000: 7 $20,001-$30,000: 3
$30,001-$40,000: 1
$40,001-$50,000: 2
Over $50,000: 1
E) $1-$20,000: 8 $20,001-$30,000: 2
$30,001-$40,000: 1
$40,001-$50,000: 1
Over $50,000: 1
Find the frequency distribution for the following groupings of the salaries: $1-$20,000 $20,001-$30,000 $30,001-$40,000 $40,001-$50,000 Over $50,000. Select the correct answer.A) $1-$20,000: 7 $20,001-$30,000: 3
$30,001-$40,000: 1
$40,001-$50,000: 2
Over $50,000: 0
B) $1-$20,000: 7 $20,001-$30,000: 3
$30,001-$40,000: 1
$40,001-$50,000: 1
Over $50,000: 1
C) $1-$20,000: 6 $20,001-$30,000: 3
$30,001-$40,000: 1
$40,001-$50,000: 2
Over $50,000: 1
D) $1-$20,000: 7 $20,001-$30,000: 3
$30,001-$40,000: 1
$40,001-$50,000: 2
Over $50,000: 1
E) $1-$20,000: 8 $20,001-$30,000: 2
$30,001-$40,000: 1
$40,001-$50,000: 1
Over $50,000: 1
Question
The following line graph shows the expenses for two salespeople of the Leadwell Pencil Company. 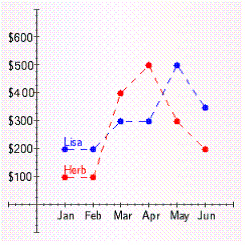 During which month did Herb incur the most expenses?
A) March
B) April
C) January
D) June
E) May
During which month did Herb incur the most expenses?A) March
B) April
C) January
D) June
E) May
Question
Question
Question
Question
FIGURE 1.  When a person in California renews the registration for an automobile, the bar graph in Figure 1 is included with the bill. If you weigh 170 pounds, how many drinks in 1 hour would you need to be definitely illegal to drive?
A) 1 drink
B) 6 drinks
C) 4 drinks
D) 5 drinks
E) 7 drinks
When a person in California renews the registration for an automobile, the bar graph in Figure 1 is included with the bill. If you weigh 170 pounds, how many drinks in 1 hour would you need to be definitely illegal to drive?A) 1 drink
B) 6 drinks
C) 4 drinks
D) 5 drinks
E) 7 drinks
Question
Question
10,000 respondents were asked the following question. If the election for U.S. Senate were being held today, for whom would you vote? Use the bar graph below to answer the questions that follow. 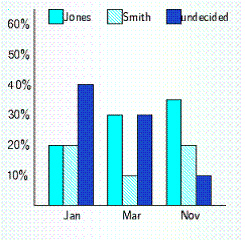 What percent of the voters favored Jones in January? In which month was the undecided vote the greatest? In which month was Jones s lead the greatest?
A) 80%, November, March
B) 20%, January, March
C) 80%, January, March
D) 20%, November, March
E) 20%, January, November
What percent of the voters favored Jones in January? In which month was the undecided vote the greatest? In which month was Jones s lead the greatest?A) 80%, November, March
B) 20%, January, March
C) 80%, January, March
D) 20%, November, March
E) 20%, January, November
Question
10,000 respondents were asked the following question. If the election for U.S. Senate were being held today, for whom would you vote? . Use the bar graph below to answer the questions that follow. 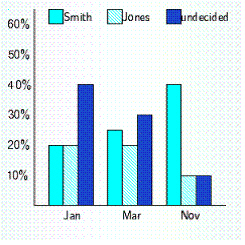 How many candidates were running for office? Who was the favorite in the election poll?
A) 3 candidates; Jones
B) 3 candidates; Smith
C) 3 candidates; undecided
D) 2 candidates; Smith
E) 2 candidates; Jones
How many candidates were running for office? Who was the favorite in the election poll?A) 3 candidates; Jones
B) 3 candidates; Smith
C) 3 candidates; undecided
D) 2 candidates; Smith
E) 2 candidates; Jones
Question
The graph below shows percentages of children in grades K-8 who received various types of care before and after school. 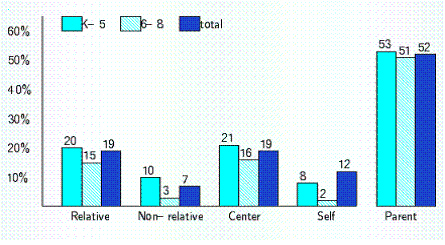 Among children in grades K-5 who received care on a regular basis from someone other than a parent before or after school, what was the least preferred method of child care?
A) relative
B) center
C) non-relative
D) self
E) parent
Among children in grades K-5 who received care on a regular basis from someone other than a parent before or after school, what was the least preferred method of child care?A) relative
B) center
C) non-relative
D) self
E) parent
Question
The gross profits for January at Tower Center for the five departments were: Appliance Department, $20,000 Automotive Department, $10,000 Clothing Department, $55,000 Grocery Department, $261,000 Nursery Department, $14,000 Use this information to determine the percentage of the gross profit in each region of the circle graph below. 
A) A = 2.8%, B = 2.8%, C = 15.3%, D = 72.5%, E = 3.9%
B) A = 94.4%, B = 97.2%, C = 84.7%, D = 27.5%, E = 96.1%
C) A = 5.6%, B = 2.8%, C = 72.5%, D = 15.3%, E = 3.9%
D) A = 72.5%, B = 2.8%, C = 15.3%, D = 5.6%, E = 3.9%
E) A = 5.6%, B = 72.5%, C = 15.3%, D = 2.8%, E = 3.9%
A) A = 2.8%, B = 2.8%, C = 15.3%, D = 72.5%, E = 3.9%
B) A = 94.4%, B = 97.2%, C = 84.7%, D = 27.5%, E = 96.1%
C) A = 5.6%, B = 2.8%, C = 72.5%, D = 15.3%, E = 3.9%
D) A = 72.5%, B = 2.8%, C = 15.3%, D = 5.6%, E = 3.9%
E) A = 5.6%, B = 72.5%, C = 15.3%, D = 2.8%, E = 3.9%
Question
FIGURE 1.  When a person in California renews the registration for an automobile, the bar graph in Figure 1 is included with the bill. In the gray zone, your chances of having an accident are 5 times higher than if you had no drinks. In the red zone, your chances of having an accident are 25 times higher. Suppose that you weigh 100 pounds and that you have 2 drinks in 2 hours. If you then drive, how much more likely are you to have an accident than if you had refrained from drinking?
A) 5 times as likely
B) 2 times as likely
C) 25 times as likely
D) 3 times as likely
E) just as likely
When a person in California renews the registration for an automobile, the bar graph in Figure 1 is included with the bill. In the gray zone, your chances of having an accident are 5 times higher than if you had no drinks. In the red zone, your chances of having an accident are 25 times higher. Suppose that you weigh 100 pounds and that you have 2 drinks in 2 hours. If you then drive, how much more likely are you to have an accident than if you had refrained from drinking?A) 5 times as likely
B) 2 times as likely
C) 25 times as likely
D) 3 times as likely
E) just as likely
Question
Question
The graph below shows percentages of children in grades K-8 who received various types of care before and after school.  Among children in grades K-8 who received care on a regular basis from someone other than a parent before or after school, what was the preferred method of child care?
A) center
B) parent
C) self
D) non-relative
E) relative
Among children in grades K-8 who received care on a regular basis from someone other than a parent before or after school, what was the preferred method of child care?A) center
B) parent
C) self
D) non-relative
E) relative
Question
According to the Specialty Coffee Association, the cost of a $1.77 latte includes $0.23 for the coffee bean and milk, $0.19 for dishes and equipment, $0.48 for rent, $0.16 for marketing and administrative costs, $0.62 for labor, and $0.09 profit. Find each of these amounts as a percentage of the cost of a latte. Use the percentages to find the proper number of degrees for each piece of the circle graph below. Round your answers to the nearest degree. 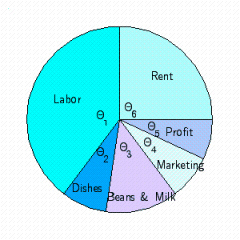
A) = 126,
  = 39,
= 39,  = 47,
= 47,  = 18,
= 18,  = 33,
= 33,  = 98.
= 98.
B) = 98,
= 98,  = 39,
= 39,  = 47,
= 47,  = 33,
= 33,  = 18,
= 18,  = 126.
C) = 126,
  = 11,
= 11,  = 13,
= 13,  = 9,
= 9,  = 5,
= 5,  = 27.
= 27.
D) = 126,
  = 39,
= 39,  = 47,
= 47,  = 33,
= 33,  = 18,
= 18,  = 98.
= 98.
E) = 126,
  = 39,
= 39,  = 33,
= 33,  = 47,
= 47,  = 18,
= 18,  = 98.
= 98.
A)
= 126, = 39, = 47, = 18, = 33, = 98.B)
= 98, = 39, = 47, = 33, = 18, = 126.C)
= 126, = 11, = 13, = 9, = 5, = 27.D)
= 126, = 39, = 47, = 33, = 18, = 98.E)
= 126, = 39, = 33, = 47, = 18, = 98. Question
The purchasing power of the dollar (1967 = $1) is (to the nearest cent): 1966, $1.03; 1968, $0.96; 1970, $0.86; 1972, $0.80; 1974, $0.68
Select the line graph that correctly represents the data.
A)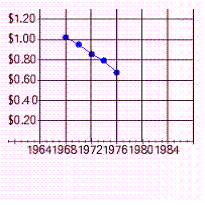
B)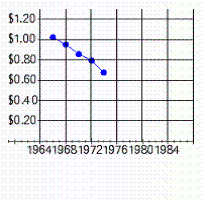
C)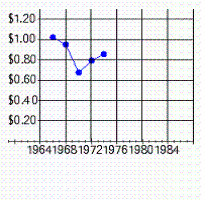
D)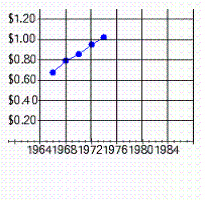
E)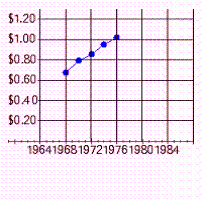
Select the line graph that correctly represents the data.
A)
B)
C)
D)
E)
Question
The amount of electricity used in a typical all-electric home is shown in the circle graph below. If, in a certain month, a home used 1,100 kwh (kilowatt-hours), find the amount of electricity used for the water heater from the graph. 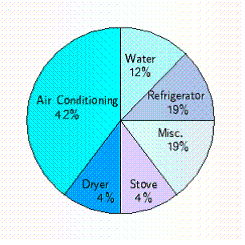 Round your answer to the nearest kwh.
A) 968 kwh
B) 1,056 kwh
C) 132 kwh
D) 110 kwh
E) 44 kwh
Round your answer to the nearest kwh.A) 968 kwh
B) 1,056 kwh
C) 132 kwh
D) 110 kwh
E) 44 kwh
Question
The wages of employees of a small accounting firm are as follows:  Find the frequency distribution for the salaries.
A) $15,000: 3, $20000: 2, $25,000: 3, $30,000: 2, $35,000: 1, $40,000: 0, $45,000: 0,
$50,000: 1, $55,000: 0, $60,000: 1
B) $15,000: 3, $20,000: 2, $25,000: 4, $30,000: 2, $35,000: 1, $40,000: 0, $45,000: 0,
$50,000: 0, $55,000: 0, $60,000: 1
C) $15,000: 3, $20,000: 2, $25,000: 3, $30,000: 2, $35,000: 1, $40,000: 0, $45,000: 0,
$50,000: 2, $55,000: 0, $60,000: 0
D) $15,000: 4, $20,000: 2, $25,000: 3, $30,000: 2, $35,000: 1, $40,000: 0, $45,000: 0,
$50,000: 1, ,$55,000: 0, $60,000: 0
E) $15,000: 3, $20,000: 2, $25,000: 3, $30,000: 2, $35,000: 1, $40,000: 0, $45,000: 0,
$50,000: 2, $55,000: 0, $60,000: 2
Find the frequency distribution for the salaries.A) $15,000: 3, $20000: 2, $25,000: 3, $30,000: 2, $35,000: 1, $40,000: 0, $45,000: 0,
$50,000: 1, $55,000: 0, $60,000: 1
B) $15,000: 3, $20,000: 2, $25,000: 4, $30,000: 2, $35,000: 1, $40,000: 0, $45,000: 0,
$50,000: 0, $55,000: 0, $60,000: 1
C) $15,000: 3, $20,000: 2, $25,000: 3, $30,000: 2, $35,000: 1, $40,000: 0, $45,000: 0,
$50,000: 2, $55,000: 0, $60,000: 0
D) $15,000: 4, $20,000: 2, $25,000: 3, $30,000: 2, $35,000: 1, $40,000: 0, $45,000: 0,
$50,000: 1, ,$55,000: 0, $60,000: 0
E) $15,000: 3, $20,000: 2, $25,000: 3, $30,000: 2, $35,000: 1, $40,000: 0, $45,000: 0,
$50,000: 2, $55,000: 0, $60,000: 2
Question
The heights of 20 students are as follows (rounded to the nearest inch): 66, 68, 65, 70, 67, 67, 68, 66, 69, 70, 68, 67, 67, 65, 69, 65, 67, 66, 69, 69 The bar graph below is drawn to scale. If the bar labeled A corresponds to the smallest recorded height and E corresponds to the largest, decide how many units tall each bar should be. Choose the correct heights for bars A and D . 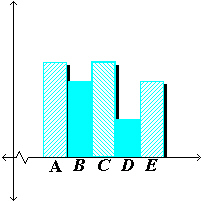
A) A : 4, D : 3
B) A : 2, D : 3,
C) A : 4, D : 2
D) A : 3, D : 2
E) A : 3, D : 3
A) A : 4, D : 3
B) A : 2, D : 3,
C) A : 4, D : 2
D) A : 3, D : 2
E) A : 3, D : 3
Question
The following line graph shows the expenses for two salespeople of the Leadwell Pencil Company. 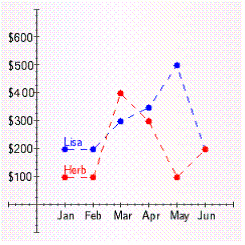 During which month did Herb incur the most expenses?
During which month did Herb incur the most expenses? Question
10,000 respondents were asked the following question. If the election for U.S. Senate were being held today, for whom would you vote? Use the bar graph below to answer the questions that follow. 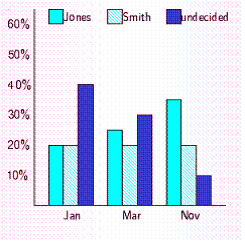 How many candidates were running for office? __________ Who was the favorite in the election poll? __________
How many candidates were running for office? __________ Who was the favorite in the election poll? __________ Question
According to the Specialty Coffee Association, the cost of a $1.75 latte includes $0.23 for the coffee bean and milk, $0.19 for dishes and equipment, $0.47 for rent, $0.19 for marketing and administrative costs, $0.59 for labor, and $0.08 profit. Find each of these amounts as a percentage of the cost of a latte. Use the percentages to find the proper number of degrees for each piece of the circle graph below. Enter your answers to the nearest degree without units. 
 = __________,
  = __________,
  = __________,
  = __________,
  = __________,
  = __________.
= __________, = __________, = __________, = __________, = __________, = __________. Question
Question
Match between columns
Question
The purchasing power of the dollar (1967 = $1) is (to the nearest cent) represented in the graph below. 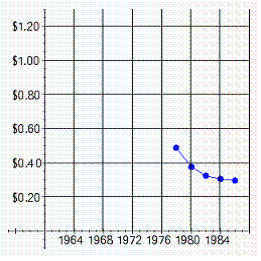 Find the purchasing power of the dollar in:
  : __________
  : __________
  : __________
Find the purchasing power of the dollar in: : __________ : __________ : __________ Question
Question
10,000 respondents were asked the following question. If the election for U.S. Senate were being held today, for whom would you vote? Use the bar graph below to answer the questions that follow.  What percent of the voters favored Jones in November? __________% In which month was the undecided vote the greatest? __________ In which month was Jones s lead the greatest? __________
What percent of the voters favored Jones in November? __________% In which month was the undecided vote the greatest? __________ In which month was Jones s lead the greatest? __________ Question
The wages of employees of a small accounting firm are as follows.
 Find the frequency distribution for the following groupings of the salaries: $1-$20,000 __________ $20,001-$30,000 __________ $30,001-$40,000 __________ $40,001-$50,000 __________ Over $50,000 __________
Find the frequency distribution for the following groupings of the salaries: $1-$20,000 __________ $20,001-$30,000 __________ $30,001-$40,000 __________ $40,001-$50,000 __________ Over $50,000 __________ Question
The heights of 20 students are as follows (rounded to the nearest inch). 66, 68, 65, 70, 67, 67, 70, 66, 69, 70, 68, 67, 67, 65, 69, 65, 67, 66, 69, 70 The bar graph below is drawn to scale. If the bar labeled A corresponds to the smallest recorded height and F corresponds to the largest, decide how many units tall each bar should be. Enter these numbers in the corresponding blanks below.  A = __________, B = __________ C = __________, D = __________ E = __________
A = __________, B = __________ C = __________, D = __________ E = __________ Question
FIGURE 1.  When a person in California renews the registration for an automobile, the bar graph in Figure 1 is included with the bill. If you weigh 90 pounds, how many drinks in 4 hours would you need to be definitely illegal to drive? __________ drinks
When a person in California renews the registration for an automobile, the bar graph in Figure 1 is included with the bill. If you weigh 90 pounds, how many drinks in 4 hours would you need to be definitely illegal to drive? __________ drinks Question
The gross profits for January at Tower Center for the five departments were: Appliance Department, $20,000 Automotive Department, $10,000 Clothing Department, $55,000 Grocery Department, $265,000 Nursery Department, $10,000 Use this information to determine the percentage of the gross profit in each region of the circle graph below. 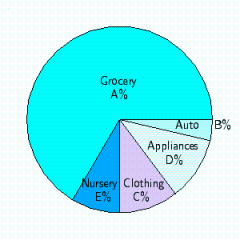 A = __________%, B = __________%, C = __________%, D = __________%, E = __________%.
A = __________%, B = __________%, C = __________%, D = __________%, E = __________%. Question
FIGURE 1. 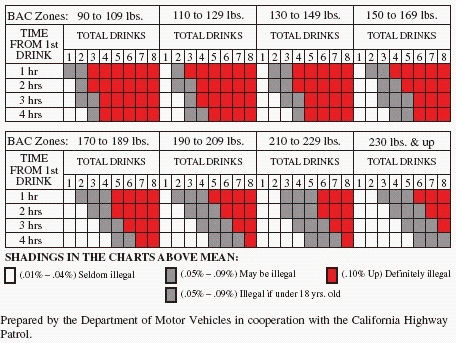 When a person in California renews the registration for an automobile, the bar graph in Figure 1 is included with the bill. In the gray zone, your chances of having an accident are 5 times higher than if you had no drinks. In the red zone, your chances of having an accident are 25 times higher. Suppose that you weigh 100 pounds and that you have 2 drinks in 1 hour. If you then drive, how much more likely are you to have an accident than if you had refrained from drinking? __________ times more likely
When a person in California renews the registration for an automobile, the bar graph in Figure 1 is included with the bill. In the gray zone, your chances of having an accident are 5 times higher than if you had no drinks. In the red zone, your chances of having an accident are 25 times higher. Suppose that you weigh 100 pounds and that you have 2 drinks in 1 hour. If you then drive, how much more likely are you to have an accident than if you had refrained from drinking? __________ times more likely Question
The wages of employees of a small accounting firm are as follows.
 Find the frequency distribution for the salaries.
Find the frequency distribution for the salaries. Question
The graph below shows percentages of children in grades K 8 who received various types of care before and after school. 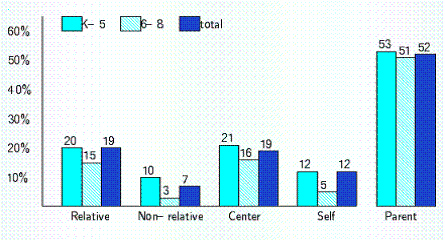 Among children in grades K-5 who received care on a regular basis from someone other than a parent before or after school, what was the least preferred method of child care?
Among children in grades K-5 who received care on a regular basis from someone other than a parent before or after school, what was the least preferred method of child care? Question
The following line graph shows the expenses for two salespeople of the Leadwell Pencil Company. 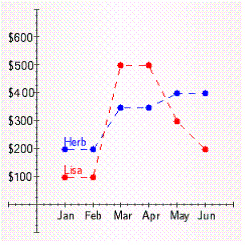 Which salesperson has more variability in his or her expenses?
Which salesperson has more variability in his or her expenses? Question
Question
The amount of electricity used in a typical all-electric home is shown in the circle graph below. If, in a certain month, a home used 1,400 kwh (kilowatt-hours), find the amount of electricity used for the stove from the graph. Round your answer to the nearest kwh. 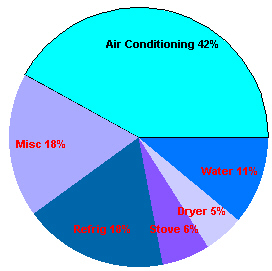
Question
Question
Question
The graph below shows percentages of children in grades K-8 who received various types of care before and after school.  Among children in grades 6-8 who received care on a regular basis from someone other than a parent before or after school, what was the preferred method of child care?
Among children in grades 6-8 who received care on a regular basis from someone other than a parent before or after school, what was the preferred method of child care?
Unlock Deck
Sign up to unlock the cards in this deck!
Unlock Deck
Unlock Deck
1/41
Play
Full screen (f)
Deck 10: Statistics
1
The following line graph shows the expenses for two salespeople of the Leadwell Pencil Company. Which salesperson has more variability in his or her expenses?
A) The variability is the same.
B) Lisa
C) There is no way to tell from this graph.
D) Herb
Which salesperson has more variability in his or her expenses?A) The variability is the same.
B) Lisa
C) There is no way to tell from this graph.
D) Herb
D
2
The wages of employees of a small accounting firm are as follows: Find the frequency distribution for the following groupings of the salaries: $1-$20,000 $20,001-$30,000 $30,001-$40,000 $40,001-$50,000 Over $50,000. Select the correct answer.
A) $1-$20,000: 7 $20,001-$30,000: 3
$30,001-$40,000: 1
$40,001-$50,000: 2
Over $50,000: 0
B) $1-$20,000: 7 $20,001-$30,000: 3
$30,001-$40,000: 1
$40,001-$50,000: 1
Over $50,000: 1
C) $1-$20,000: 6 $20,001-$30,000: 3
$30,001-$40,000: 1
$40,001-$50,000: 2
Over $50,000: 1
D) $1-$20,000: 7 $20,001-$30,000: 3
$30,001-$40,000: 1
$40,001-$50,000: 2
Over $50,000: 1
E) $1-$20,000: 8 $20,001-$30,000: 2
$30,001-$40,000: 1
$40,001-$50,000: 1
Over $50,000: 1
Find the frequency distribution for the following groupings of the salaries: $1-$20,000 $20,001-$30,000 $30,001-$40,000 $40,001-$50,000 Over $50,000. Select the correct answer.A) $1-$20,000: 7 $20,001-$30,000: 3
$30,001-$40,000: 1
$40,001-$50,000: 2
Over $50,000: 0
B) $1-$20,000: 7 $20,001-$30,000: 3
$30,001-$40,000: 1
$40,001-$50,000: 1
Over $50,000: 1
C) $1-$20,000: 6 $20,001-$30,000: 3
$30,001-$40,000: 1
$40,001-$50,000: 2
Over $50,000: 1
D) $1-$20,000: 7 $20,001-$30,000: 3
$30,001-$40,000: 1
$40,001-$50,000: 2
Over $50,000: 1
E) $1-$20,000: 8 $20,001-$30,000: 2
$30,001-$40,000: 1
$40,001-$50,000: 1
Over $50,000: 1
B
3
The following line graph shows the expenses for two salespeople of the Leadwell Pencil Company. During which month did Herb incur the most expenses?
A) March
B) April
C) January
D) June
E) May
During which month did Herb incur the most expenses?A) March
B) April
C) January
D) June
E) May
B
4
What is the definition of statistics ?
A) the mathematics of the collection, organization, and interpretation of numerical data
B) a set of intervals, usually adjacent and of equal width
C) a circular graph divided into sectors with areas proportional to the quantities represented
D) a graph representing a frequency distribution using horizontal or vertical bars of uniform width
E) a numerical datum
Unlock Deck
Unlock for access to all 41 flashcards in this deck.
Unlock Deck
k this deck
5
The gross profits for January at Tower Center for the five departments were: Appliance Department, $20,000
Automotive Department, $10,000
Clothing Department, $55,000
Grocery Department, $260,000
Nursery Department, $15,000
Find the percentages of the total earned by each department. Then, change each of the percentages to degrees.
A) Appliances: 10 degrees Automotive: 20 degrees
Clothing: 55 degrees
Grocery: 260 degrees
Nursery: 15 degrees
B) Appliances: 20 degrees Automotive: 10 degrees
Clothing: 55 degrees
Grocery: 15 degrees
Nursery: 260 degrees
C) Appliances: 2,000 degrees Automotive: 1,000 degrees
Clothing: 5,500 degrees
Grocery: 26,000 degrees
Nursery: 1,500 degrees
D) Appliances: 20,000 degrees Automotive: 10,000 degrees
Clothing: 55,000 degrees
Grocery: 260,000 degrees
Nursery: 15,000 degrees
E) Appliances: 20 degrees Automotive: 10 degrees
Clothing: 55 degrees
Grocery: 260 degrees
Nursery: 15 degrees
Unlock Deck
Unlock for access to all 41 flashcards in this deck.
Unlock Deck
k this deck
6
The gross profits for January at Tower Center for the five departments were: Appliance Department, $20,000
Automotive Department, $10,000
Clothing Department, $55,000
Grocery Department, $265,000
Nursery Department, $10,000
Change each of the profit amounts to a percentage, rounded to the nearest tenth of a percent.
A) Appliances: 5.6% Automotive: 2.8%
Clothing: 15.3%
Grocery: 2.8%
Nursery: 73.6%
B) Appliances: 94.4% Automotive: 97.2%
Clothing: 84.7%
Grocery: 26.4%
Nursery: 97.2%
C) Appliances: 2.8% Automotive: 5.6%
Clothing: 15.3%
Grocery: 73.6%
Nursery: 2.8%
D) Appliances: 20,000 Automotive: 10,000
Clothing: 55,000
Grocery: 265,000
Nursery: 10,000
E) Appliances: 5.6% Automotive: 2.8%
Clothing: 15.3%
Grocery: 73.6%
Nursery: 2.8%
Unlock Deck
Unlock for access to all 41 flashcards in this deck.
Unlock Deck
k this deck
7
FIGURE 1. When a person in California renews the registration for an automobile, the bar graph in Figure 1 is included with the bill. If you weigh 170 pounds, how many drinks in 1 hour would you need to be definitely illegal to drive?
A) 1 drink
B) 6 drinks
C) 4 drinks
D) 5 drinks
E) 7 drinks
When a person in California renews the registration for an automobile, the bar graph in Figure 1 is included with the bill. If you weigh 170 pounds, how many drinks in 1 hour would you need to be definitely illegal to drive?A) 1 drink
B) 6 drinks
C) 4 drinks
D) 5 drinks
E) 7 drinks
Unlock Deck
Unlock for access to all 41 flashcards in this deck.
Unlock Deck
k this deck
8
The heights of 20 students are as follows (rounded to the nearest inch): 65, 68, 65, 70, 67, 67, 68, 66, 69, 70, 68, 67, 67, 65, 69, 65, 67, 66, 69, 69
Prepare a frequency distribution for this data. Then, enter the number of data points in each category below. Select the correct matched list of heights and frequencies.
A) 65: 5 66: 1
67: 5
68: 3
69: 4
70: 2
B) 65: 5 66: 1
67: 6
68: 2
69: 4
70: 2
C) 65: 4 66: 2
67: 5
68: 3
69: 4
70: 2
D) 65: 5 66: 1
67: 5
68: 3
69: 4
70: 3
E) 65: 5 66: 1
67: 5
68: 3
69: 3
70: 3
Unlock Deck
Unlock for access to all 41 flashcards in this deck.
Unlock Deck
k this deck
9
10,000 respondents were asked the following question. If the election for U.S. Senate were being held today, for whom would you vote? Use the bar graph below to answer the questions that follow. What percent of the voters favored Jones in January? In which month was the undecided vote the greatest? In which month was Jones s lead the greatest?
A) 80%, November, March
B) 20%, January, March
C) 80%, January, March
D) 20%, November, March
E) 20%, January, November
What percent of the voters favored Jones in January? In which month was the undecided vote the greatest? In which month was Jones s lead the greatest?A) 80%, November, March
B) 20%, January, March
C) 80%, January, March
D) 20%, November, March
E) 20%, January, November
Unlock Deck
Unlock for access to all 41 flashcards in this deck.
Unlock Deck
k this deck
10
10,000 respondents were asked the following question. If the election for U.S. Senate were being held today, for whom would you vote? . Use the bar graph below to answer the questions that follow. How many candidates were running for office? Who was the favorite in the election poll?
A) 3 candidates; Jones
B) 3 candidates; Smith
C) 3 candidates; undecided
D) 2 candidates; Smith
E) 2 candidates; Jones
How many candidates were running for office? Who was the favorite in the election poll?A) 3 candidates; Jones
B) 3 candidates; Smith
C) 3 candidates; undecided
D) 2 candidates; Smith
E) 2 candidates; Jones
Unlock Deck
Unlock for access to all 41 flashcards in this deck.
Unlock Deck
k this deck
11
The graph below shows percentages of children in grades K-8 who received various types of care before and after school. Among children in grades K-5 who received care on a regular basis from someone other than a parent before or after school, what was the least preferred method of child care?
A) relative
B) center
C) non-relative
D) self
E) parent
Among children in grades K-5 who received care on a regular basis from someone other than a parent before or after school, what was the least preferred method of child care?A) relative
B) center
C) non-relative
D) self
E) parent
Unlock Deck
Unlock for access to all 41 flashcards in this deck.
Unlock Deck
k this deck
12
The gross profits for January at Tower Center for the five departments were: Appliance Department, $20,000 Automotive Department, $10,000 Clothing Department, $55,000 Grocery Department, $261,000 Nursery Department, $14,000 Use this information to determine the percentage of the gross profit in each region of the circle graph below.
A) A = 2.8%, B = 2.8%, C = 15.3%, D = 72.5%, E = 3.9%
B) A = 94.4%, B = 97.2%, C = 84.7%, D = 27.5%, E = 96.1%
C) A = 5.6%, B = 2.8%, C = 72.5%, D = 15.3%, E = 3.9%
D) A = 72.5%, B = 2.8%, C = 15.3%, D = 5.6%, E = 3.9%
E) A = 5.6%, B = 72.5%, C = 15.3%, D = 2.8%, E = 3.9%
A) A = 2.8%, B = 2.8%, C = 15.3%, D = 72.5%, E = 3.9%
B) A = 94.4%, B = 97.2%, C = 84.7%, D = 27.5%, E = 96.1%
C) A = 5.6%, B = 2.8%, C = 72.5%, D = 15.3%, E = 3.9%
D) A = 72.5%, B = 2.8%, C = 15.3%, D = 5.6%, E = 3.9%
E) A = 5.6%, B = 72.5%, C = 15.3%, D = 2.8%, E = 3.9%
Unlock Deck
Unlock for access to all 41 flashcards in this deck.
Unlock Deck
k this deck
13
FIGURE 1. When a person in California renews the registration for an automobile, the bar graph in Figure 1 is included with the bill. In the gray zone, your chances of having an accident are 5 times higher than if you had no drinks. In the red zone, your chances of having an accident are 25 times higher. Suppose that you weigh 100 pounds and that you have 2 drinks in 2 hours. If you then drive, how much more likely are you to have an accident than if you had refrained from drinking?
A) 5 times as likely
B) 2 times as likely
C) 25 times as likely
D) 3 times as likely
E) just as likely
When a person in California renews the registration for an automobile, the bar graph in Figure 1 is included with the bill. In the gray zone, your chances of having an accident are 5 times higher than if you had no drinks. In the red zone, your chances of having an accident are 25 times higher. Suppose that you weigh 100 pounds and that you have 2 drinks in 2 hours. If you then drive, how much more likely are you to have an accident than if you had refrained from drinking?A) 5 times as likely
B) 2 times as likely
C) 25 times as likely
D) 3 times as likely
E) just as likely
Unlock Deck
Unlock for access to all 41 flashcards in this deck.
Unlock Deck
k this deck
14
According to the Specialty Coffee Association, the cost of a $1.80 latte includes $0.24 for the coffee bean and milk, $0.19 for dishes and equipment, $0.45 for rent, $0.17 for marketing and administrative costs, $0.67 for labor, and $0.08 profit. Find each of these amounts as a percentage of the cost of a latte to the nearest tenth of a percent.
A) dishes and equipment: 10.6% coffee bean and milk: 24.0%
Marketing: 17.0%
Labor: 67.0%
Profit: 8.0%
Rent: 45.0%
B) dishes and equipment: 0.1% coffee bean and milk: 0.1%
Marketing: 0.1%
Labor: 0.4%
Profit: 0.0%
Rent: 0.3%
C) dishes and equipment: 10.6% coffee bean and milk: 86.7%
Marketing: 90.6%
Labor: 62.8%
Profit: 95.6%
Rent: 75.0%
D) dishes and equipment: 13.3% coffee bean and milk: 10.6%
Marketing: 9.4%
Labor: 37.2%
Profit: 4.4%
Rent: 25.0%
E) dishes and equipment: 10.6% coffee bean and milk: 13.3%
Marketing: 9.4%
Labor: 37.2%
Profit: 4.4%
Rent: 25.0%
Unlock Deck
Unlock for access to all 41 flashcards in this deck.
Unlock Deck
k this deck
15
The graph below shows percentages of children in grades K-8 who received various types of care before and after school. Among children in grades K-8 who received care on a regular basis from someone other than a parent before or after school, what was the preferred method of child care?
A) center
B) parent
C) self
D) non-relative
E) relative
Among children in grades K-8 who received care on a regular basis from someone other than a parent before or after school, what was the preferred method of child care?A) center
B) parent
C) self
D) non-relative
E) relative
Unlock Deck
Unlock for access to all 41 flashcards in this deck.
Unlock Deck
k this deck
16
According to the Specialty Coffee Association, the cost of a $1.77 latte includes $0.23 for the coffee bean and milk, $0.19 for dishes and equipment, $0.48 for rent, $0.16 for marketing and administrative costs, $0.62 for labor, and $0.09 profit. Find each of these amounts as a percentage of the cost of a latte. Use the percentages to find the proper number of degrees for each piece of the circle graph below. Round your answers to the nearest degree.
A) = 126, = 39, = 47, = 18, = 33, = 98.
B) = 98, = 39, = 47, = 33, = 18, = 126.
C) = 126, = 11, = 13, = 9, = 5, = 27.
D) = 126, = 39, = 47, = 33, = 18, = 98.
E) = 126, = 39, = 33, = 47, = 18, = 98.
A)
= 126, = 39, = 47, = 18, = 33, = 98.B)
= 98, = 39, = 47, = 33, = 18, = 126.C)
= 126, = 11, = 13, = 9, = 5, = 27.D)
= 126, = 39, = 47, = 33, = 18, = 98.E)
= 126, = 39, = 33, = 47, = 18, = 98. Unlock Deck
Unlock for access to all 41 flashcards in this deck.
Unlock Deck
k this deck
17
The purchasing power of the dollar (1967 = $1) is (to the nearest cent): 1966, $1.03; 1968, $0.96; 1970, $0.86; 1972, $0.80; 1974, $0.68
Select the line graph that correctly represents the data.
A)
B)
C)
D)
E)
Select the line graph that correctly represents the data.
A)
B)
C)
D)
E)
Unlock Deck
Unlock for access to all 41 flashcards in this deck.
Unlock Deck
k this deck
18
The amount of electricity used in a typical all-electric home is shown in the circle graph below. If, in a certain month, a home used 1,100 kwh (kilowatt-hours), find the amount of electricity used for the water heater from the graph. Round your answer to the nearest kwh.
A) 968 kwh
B) 1,056 kwh
C) 132 kwh
D) 110 kwh
E) 44 kwh
Round your answer to the nearest kwh.A) 968 kwh
B) 1,056 kwh
C) 132 kwh
D) 110 kwh
E) 44 kwh
Unlock Deck
Unlock for access to all 41 flashcards in this deck.
Unlock Deck
k this deck
19
The wages of employees of a small accounting firm are as follows: Find the frequency distribution for the salaries.
A) $15,000: 3, $20000: 2, $25,000: 3, $30,000: 2, $35,000: 1, $40,000: 0, $45,000: 0,
$50,000: 1, $55,000: 0, $60,000: 1
B) $15,000: 3, $20,000: 2, $25,000: 4, $30,000: 2, $35,000: 1, $40,000: 0, $45,000: 0,
$50,000: 0, $55,000: 0, $60,000: 1
C) $15,000: 3, $20,000: 2, $25,000: 3, $30,000: 2, $35,000: 1, $40,000: 0, $45,000: 0,
$50,000: 2, $55,000: 0, $60,000: 0
D) $15,000: 4, $20,000: 2, $25,000: 3, $30,000: 2, $35,000: 1, $40,000: 0, $45,000: 0,
$50,000: 1, ,$55,000: 0, $60,000: 0
E) $15,000: 3, $20,000: 2, $25,000: 3, $30,000: 2, $35,000: 1, $40,000: 0, $45,000: 0,
$50,000: 2, $55,000: 0, $60,000: 2
Find the frequency distribution for the salaries.A) $15,000: 3, $20000: 2, $25,000: 3, $30,000: 2, $35,000: 1, $40,000: 0, $45,000: 0,
$50,000: 1, $55,000: 0, $60,000: 1
B) $15,000: 3, $20,000: 2, $25,000: 4, $30,000: 2, $35,000: 1, $40,000: 0, $45,000: 0,
$50,000: 0, $55,000: 0, $60,000: 1
C) $15,000: 3, $20,000: 2, $25,000: 3, $30,000: 2, $35,000: 1, $40,000: 0, $45,000: 0,
$50,000: 2, $55,000: 0, $60,000: 0
D) $15,000: 4, $20,000: 2, $25,000: 3, $30,000: 2, $35,000: 1, $40,000: 0, $45,000: 0,
$50,000: 1, ,$55,000: 0, $60,000: 0
E) $15,000: 3, $20,000: 2, $25,000: 3, $30,000: 2, $35,000: 1, $40,000: 0, $45,000: 0,
$50,000: 2, $55,000: 0, $60,000: 2
Unlock Deck
Unlock for access to all 41 flashcards in this deck.
Unlock Deck
k this deck
20
The heights of 20 students are as follows (rounded to the nearest inch): 66, 68, 65, 70, 67, 67, 68, 66, 69, 70, 68, 67, 67, 65, 69, 65, 67, 66, 69, 69 The bar graph below is drawn to scale. If the bar labeled A corresponds to the smallest recorded height and E corresponds to the largest, decide how many units tall each bar should be. Choose the correct heights for bars A and D .
A) A : 4, D : 3
B) A : 2, D : 3,
C) A : 4, D : 2
D) A : 3, D : 2
E) A : 3, D : 3
A) A : 4, D : 3
B) A : 2, D : 3,
C) A : 4, D : 2
D) A : 3, D : 2
E) A : 3, D : 3
Unlock Deck
Unlock for access to all 41 flashcards in this deck.
Unlock Deck
k this deck
21
The following line graph shows the expenses for two salespeople of the Leadwell Pencil Company. During which month did Herb incur the most expenses?
During which month did Herb incur the most expenses? Unlock Deck
Unlock for access to all 41 flashcards in this deck.
Unlock Deck
k this deck
22
10,000 respondents were asked the following question. If the election for U.S. Senate were being held today, for whom would you vote? Use the bar graph below to answer the questions that follow. How many candidates were running for office? __________ Who was the favorite in the election poll? __________
How many candidates were running for office? __________ Who was the favorite in the election poll? __________ Unlock Deck
Unlock for access to all 41 flashcards in this deck.
Unlock Deck
k this deck
23
According to the Specialty Coffee Association, the cost of a $1.75 latte includes $0.23 for the coffee bean and milk, $0.19 for dishes and equipment, $0.47 for rent, $0.19 for marketing and administrative costs, $0.59 for labor, and $0.08 profit. Find each of these amounts as a percentage of the cost of a latte. Use the percentages to find the proper number of degrees for each piece of the circle graph below. Enter your answers to the nearest degree without units. = __________, = __________, = __________, = __________, = __________, = __________.
= __________, = __________, = __________, = __________, = __________, = __________. Unlock Deck
Unlock for access to all 41 flashcards in this deck.
Unlock Deck
k this deck
24
The gross profits for January at Tower Center for the five departments were:
Appliance Department, $20,000
Automotive Department, $10,000
Clothing Department, $55,000
Grocery Department, $265,000
Nursery Department, $10,000
Find the percentages of the total earned by each department. Then, change each of the percentages to degrees.
Appliances: __________ degrees
Automotive: __________ degrees
Clothing: __________ degrees
Grocery: __________ degrees
Nursery: __________ degrees
Unlock Deck
Unlock for access to all 41 flashcards in this deck.
Unlock Deck
k this deck
25
Match between columns
Unlock Deck
Unlock for access to all 41 flashcards in this deck.
Unlock Deck
k this deck
26
The purchasing power of the dollar (1967 = $1) is (to the nearest cent) represented in the graph below. Find the purchasing power of the dollar in: : __________ : __________ : __________
Find the purchasing power of the dollar in: : __________ : __________ : __________ Unlock Deck
Unlock for access to all 41 flashcards in this deck.
Unlock Deck
k this deck
27
The heights of 20 students are as follows (rounded to the nearest inch).
66, 68, 65, 70, 70, 70, 68, 66, 69, 70, 68, 67, 67, 65, 69, 65, 67, 66, 69, 69
Prepare a frequency distribution for this data. Then, enter the number of data points in each category below.
65: __________
66: __________
67: __________
68: __________
69: __________
70: __________
66, 68, 65, 70, 70, 70, 68, 66, 69, 70, 68, 67, 67, 65, 69, 65, 67, 66, 69, 69
Prepare a frequency distribution for this data. Then, enter the number of data points in each category below.
65: __________
66: __________
67: __________
68: __________
69: __________
70: __________
Unlock Deck
Unlock for access to all 41 flashcards in this deck.
Unlock Deck
k this deck
28
10,000 respondents were asked the following question. If the election for U.S. Senate were being held today, for whom would you vote? Use the bar graph below to answer the questions that follow. What percent of the voters favored Jones in November? __________% In which month was the undecided vote the greatest? __________ In which month was Jones s lead the greatest? __________
What percent of the voters favored Jones in November? __________% In which month was the undecided vote the greatest? __________ In which month was Jones s lead the greatest? __________ Unlock Deck
Unlock for access to all 41 flashcards in this deck.
Unlock Deck
k this deck
29
The wages of employees of a small accounting firm are as follows.
Find the frequency distribution for the following groupings of the salaries: $1-$20,000 __________ $20,001-$30,000 __________ $30,001-$40,000 __________ $40,001-$50,000 __________ Over $50,000 __________
Find the frequency distribution for the following groupings of the salaries: $1-$20,000 __________ $20,001-$30,000 __________ $30,001-$40,000 __________ $40,001-$50,000 __________ Over $50,000 __________ Unlock Deck
Unlock for access to all 41 flashcards in this deck.
Unlock Deck
k this deck
30
The heights of 20 students are as follows (rounded to the nearest inch). 66, 68, 65, 70, 67, 67, 70, 66, 69, 70, 68, 67, 67, 65, 69, 65, 67, 66, 69, 70 The bar graph below is drawn to scale. If the bar labeled A corresponds to the smallest recorded height and F corresponds to the largest, decide how many units tall each bar should be. Enter these numbers in the corresponding blanks below. A = __________, B = __________ C = __________, D = __________ E = __________
A = __________, B = __________ C = __________, D = __________ E = __________ Unlock Deck
Unlock for access to all 41 flashcards in this deck.
Unlock Deck
k this deck
31
FIGURE 1. When a person in California renews the registration for an automobile, the bar graph in Figure 1 is included with the bill. If you weigh 90 pounds, how many drinks in 4 hours would you need to be definitely illegal to drive? __________ drinks
When a person in California renews the registration for an automobile, the bar graph in Figure 1 is included with the bill. If you weigh 90 pounds, how many drinks in 4 hours would you need to be definitely illegal to drive? __________ drinks Unlock Deck
Unlock for access to all 41 flashcards in this deck.
Unlock Deck
k this deck
32
The gross profits for January at Tower Center for the five departments were: Appliance Department, $20,000 Automotive Department, $10,000 Clothing Department, $55,000 Grocery Department, $265,000 Nursery Department, $10,000 Use this information to determine the percentage of the gross profit in each region of the circle graph below. A = __________%, B = __________%, C = __________%, D = __________%, E = __________%.
A = __________%, B = __________%, C = __________%, D = __________%, E = __________%. Unlock Deck
Unlock for access to all 41 flashcards in this deck.
Unlock Deck
k this deck
33
FIGURE 1. When a person in California renews the registration for an automobile, the bar graph in Figure 1 is included with the bill. In the gray zone, your chances of having an accident are 5 times higher than if you had no drinks. In the red zone, your chances of having an accident are 25 times higher. Suppose that you weigh 100 pounds and that you have 2 drinks in 1 hour. If you then drive, how much more likely are you to have an accident than if you had refrained from drinking? __________ times more likely
When a person in California renews the registration for an automobile, the bar graph in Figure 1 is included with the bill. In the gray zone, your chances of having an accident are 5 times higher than if you had no drinks. In the red zone, your chances of having an accident are 25 times higher. Suppose that you weigh 100 pounds and that you have 2 drinks in 1 hour. If you then drive, how much more likely are you to have an accident than if you had refrained from drinking? __________ times more likely Unlock Deck
Unlock for access to all 41 flashcards in this deck.
Unlock Deck
k this deck
34
The wages of employees of a small accounting firm are as follows.
Find the frequency distribution for the salaries.
Find the frequency distribution for the salaries. Unlock Deck
Unlock for access to all 41 flashcards in this deck.
Unlock Deck
k this deck
35
The graph below shows percentages of children in grades K 8 who received various types of care before and after school. Among children in grades K-5 who received care on a regular basis from someone other than a parent before or after school, what was the least preferred method of child care?
Among children in grades K-5 who received care on a regular basis from someone other than a parent before or after school, what was the least preferred method of child care? Unlock Deck
Unlock for access to all 41 flashcards in this deck.
Unlock Deck
k this deck
36
The following line graph shows the expenses for two salespeople of the Leadwell Pencil Company. Which salesperson has more variability in his or her expenses?
Which salesperson has more variability in his or her expenses? Unlock Deck
Unlock for access to all 41 flashcards in this deck.
Unlock Deck
k this deck
37
According to the Specialty Coffee Association, the cost of a $1.73 latte includes $0.25 for the coffee bean and milk, $0.19 for dishes and equipment, $0.44 for rent, $0.18 for marketing and administrative costs, $0.59 for labor, and $0.08 profit.
Find each of these amounts as a percentage of the cost of a latte to the nearest tenth of a percent.
dishes and equipment: __________ %
coffee bean and milk: __________ %
marketing: __________ %
labor: __________ %
profit: __________ %
rent: __________ %
Find each of these amounts as a percentage of the cost of a latte to the nearest tenth of a percent.
dishes and equipment: __________ %
coffee bean and milk: __________ %
marketing: __________ %
labor: __________ %
profit: __________ %
rent: __________ %
Unlock Deck
Unlock for access to all 41 flashcards in this deck.
Unlock Deck
k this deck
38
The amount of electricity used in a typical all-electric home is shown in the circle graph below. If, in a certain month, a home used 1,400 kwh (kilowatt-hours), find the amount of electricity used for the stove from the graph. Round your answer to the nearest kwh.
Unlock Deck
Unlock for access to all 41 flashcards in this deck.
Unlock Deck
k this deck
39
The gross profits for January at Tower Center for the five departments were:
Appliance Department, $20,000
Automotive Department, $10,000
Clothing Department, $55,000
Grocery Department, $25,000
Nursery Department, $15,000
Find the percentages of the total earned by each department, change each of the percentages to degrees, to the nearest whole number, then draw a circle graph of these data.
Appliances: __________ degrees
Automotive: __________ degrees
Clothing: __________ degrees
Grocery: __________ degrees
Nursery: __________ degrees
Unlock Deck
Unlock for access to all 41 flashcards in this deck.
Unlock Deck
k this deck
40
The gross profits for January at Tower Center for the five departments were:
Appliance Department, $20,000
Automotive Department, $10,000
Clothing Department, $56,000
Grocery Department, $260,000
Nursery Department, $14,000
Change each of the profit amounts to a percentage, rounded to the nearest tenth of a percent.
Appliances: __________ %
Automotive: __________ %
Clothing: __________ %
Grocery: __________ %
Nursery: __________ %
Unlock Deck
Unlock for access to all 41 flashcards in this deck.
Unlock Deck
k this deck
41
The graph below shows percentages of children in grades K-8 who received various types of care before and after school. Among children in grades 6-8 who received care on a regular basis from someone other than a parent before or after school, what was the preferred method of child care?
Among children in grades 6-8 who received care on a regular basis from someone other than a parent before or after school, what was the preferred method of child care? Unlock Deck
Unlock for access to all 41 flashcards in this deck.
Unlock Deck
k this deck
Unlock Deck
Unlock for access to all 41 flashcards in this deck.


