Deck 4: Biomolecular Principles: Proteins
Full screen (f)
Question
Question
Penicillin is hydrolyzed and thereby rendered inactive by penicillinase (also known as β-lactamase), an enzyme present in some resistant bacteria. The mass of this enzyme in Staphylococcus aureus is 29.6 kd. The amount of penicillin hydrolyzed in 1 minute in a 10-mL solution containing 10−9 g of purified penicillinase was measured as a function of the concentration of penicillin. Assume that the concentration of penicillin does not change appreciably during the assay. [Note that kilodalton is the unit for MW for biological molecules. A dalton is another name for atomic mass unit. For example, a protein with a mass of 15 kd means that the MW is 15,000 g/mol.] ![Penicillin is hydrolyzed and thereby rendered inactive by penicillinase (also known as β-lactamase), an enzyme present in some resistant bacteria. The mass of this enzyme in Staphylococcus aureus is 29.6 kd. The amount of penicillin hydrolyzed in 1 minute in a 10-mL solution containing 10−9 g of purified penicillinase was measured as a function of the concentration of penicillin. Assume that the concentration of penicillin does not change appreciably during the assay. [Note that kilodalton is the unit for MW for biological molecules. A dalton is another name for atomic mass unit. For example, a protein with a mass of 15 kd means that the MW is 15,000 g/mol.] a. Plot V0 versus [S] for these data. Does penicillinase appear to obey Michaelis-Menten kinetics? If so, what is the value of Km? b. What is the value of Vmax? Indicate on the plot how you determined Km and Vmax. c. Write the Michaelis-Menten equation and show the derivation of the Lineweaver-Burke equation. d. Plot 1/V0 versus 1/[S]. e. Determine Km and Vmax using the Lineweaver-Burke plot. Indicate on the plot how you determined Km and Vmax. f. Assume there is one active site per enzyme molecule. What is the turnover number of penicillinase under these experimental conditions? g. How much time does it take for the penicillinase to hydrolyze one penicillin molecule?<div style=padding-top: 35px>](https://storage.examlex.com/SM1184/11ec7385_02bd_7d21_9432_477de0cadf1d_SM1184_00.jpg)
a. Plot V0 versus [S] for these data. Does penicillinase appear to obey Michaelis-Menten kinetics? If so, what is the value of Km?
b. What is the value of Vmax? Indicate on the plot how you determined Km and Vmax.
c. Write the Michaelis-Menten equation and show the derivation of the Lineweaver-Burke equation.
d. Plot 1/V0 versus 1/[S].
e. Determine Km and Vmax using the Lineweaver-Burke plot. Indicate on
the plot how you determined Km and Vmax.
f. Assume there is one active site per enzyme molecule. What is the
turnover number of penicillinase under these experimental conditions?
g. How much time does it take for the penicillinase to hydrolyze one
penicillin molecule?
Question
Question
Glutamic acid (1 of the 20 amino acids) has a side-chain carboxyl group 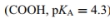 as shown in Figures 4.7 and 4.8.
a. Write the chemical equation for the dissociation of the side-chain COOH. Label the weak acid and the conjugate base.
b. The Henderson-Hasselbalch equation can be used to determine the ionization status of a weak acid: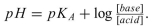 Use the Henderson-Hasselbalch equation to determine whether the glutamic acid side-chain carboxyl group is protonated or deprotonated at physiolo- gical pH.
as shown in Figures 4.7 and 4.8. a. Write the chemical equation for the dissociation of the side-chain COOH. Label the weak acid and the conjugate base.
b. The Henderson-Hasselbalch equation can be used to determine the ionization status of a weak acid:
Use the Henderson-Hasselbalch equation to determine whether the glutamic acid side-chain carboxyl group is protonated or deprotonated at physiolo- gical pH. Question
Question
Question
Question
Question
The value of Km was determined for three enzymes as shown below. Which of the enzymes has high affinity for its substrate and why? 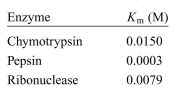
Question
Question
Cells have surface receptors that can recognize and bind to the tripeptide RGD (Arg-Gly-Asp). Tissue engineers sometimes use this adhesive peptide to render synthetic biomaterials attractive to cells.
a. Draw the chemical structure of the RGD peptide.
b. Write the acid ionization chemical equation for each ionizable group. Use the Henderson-Hasselbalch equation to determine the ionization state of each ionizable group at pH 7.4. Be sure to consider ALL the ionizable
c. What is the net charge of the RGD peptide at physiological pH?
Question
Question
Question
Question
The concentration of a product, P, is measured by ultraviolet-visible spec- troscopy (UV-VIS) as a function of time. The data are tabulated here. Estimate the initial reaction rate, V0. 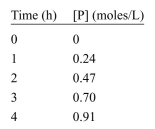

Unlock Deck
Sign up to unlock the cards in this deck!
Unlock Deck
Unlock Deck
1/15
Play
Full screen (f)
Deck 4: Biomolecular Principles: Proteins
1
Describe the hydrophobic effect and how it contributes to an energetically favorable protein folding reaction.
The chemical properties in the structure of most common 20 amino acids are often separated into groups. The non-polar amino acids have side chains that do not dissolve easily in water, whereas the polar amino acids have side chains that dissolve in water. The molecules, which are non-polar do not melt easily in water and are referred as hydrophobic. The process of eliminating the hydrophobic molecules from water is known as hydrophobic effect. It is important in the formation of the three-dimensional structure of proteins.
In addition, tertiary structure of the protein molecule refers to three-dimensional structure, which includes electrostatic forces. The intermolecular forces, such as hydrogen bonding and vanderwaal's interactions produce connections between the fragments of a polypeptide. They are able to calculate by examining the chemical structure of every participating amino acid. The folding of the ?-helices and ?-sheets are determined by the non-specific hydrophobic interactions.
Thus, the amino acids, which have the property to ? - helix, are mostly hydrophobic in nature. In protein folding if there is decrease in overall free energy in solution the polypeptides will fold into constant structures.
Hence, forming of three-dimensional structure by folding of a polypeptide chain should be an energetically favorable process (?G 0). This can be explained by thermodynamic modeling.
2
Penicillin is hydrolyzed and thereby rendered inactive by penicillinase (also known as β-lactamase), an enzyme present in some resistant bacteria. The mass of this enzyme in Staphylococcus aureus is 29.6 kd. The amount of penicillin hydrolyzed in 1 minute in a 10-mL solution containing 10−9 g of purified penicillinase was measured as a function of the concentration of penicillin. Assume that the concentration of penicillin does not change appreciably during the assay. [Note that kilodalton is the unit for MW for biological molecules. A dalton is another name for atomic mass unit. For example, a protein with a mass of 15 kd means that the MW is 15,000 g/mol.]
a. Plot V0 versus [S] for these data. Does penicillinase appear to obey Michaelis-Menten kinetics? If so, what is the value of Km?
b. What is the value of Vmax? Indicate on the plot how you determined Km and Vmax.
c. Write the Michaelis-Menten equation and show the derivation of the Lineweaver-Burke equation.
d. Plot 1/V0 versus 1/[S].
e. Determine Km and Vmax using the Lineweaver-Burke plot. Indicate on
the plot how you determined Km and Vmax.
f. Assume there is one active site per enzyme molecule. What is the
turnover number of penicillinase under these experimental conditions?
g. How much time does it take for the penicillinase to hydrolyze one
penicillin molecule?
THE MICHAELIS-MENTEN EQUATION
The Michaelis-Menten equation is used to study enzyme kinetics.
Michaelis-Menten equation is given by Here
Here  is the velocity of the chemical reaction,
  denotes the concentration of the substrate,
  is the saturation reaction rate and
  is Michaelis-Menten constant which is related to the binding affinity of the substrate to the enzyme.
 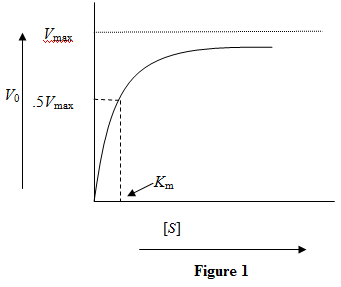 Figure 1: Reaction velocity versus substrate concentration for a particular enzyme-substrate pair
a)
The binding affinity of a substrate with an enzyme is measured in terms of It equals the substrate concentration when the reaction velocity is half the saturation reaction velocity. A lower value of
  indicates a higher binding affinity.
So, for two substrates binding to the same enzyme, the curve will be steeper for the substrate with higher binding affinity.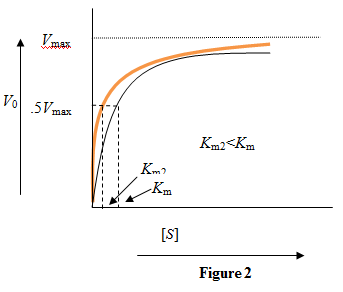 Figure 2: Reaction velocity versus substrate concentration for two substrates with a given enzyme. The orange color curve is for the substrate with higher binding affinity.
While the Michaelis-Menten constant gets reduced due to higher binding affinity, the saturation velocity, which depends on the enzyme concentration, remains the same.
b)
The maximum reaction rate depends directly on the amount of enzyme. Doubling the enzyme concentration will double the maximum reaction velocity.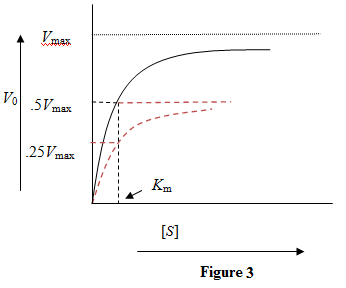 Figure 3: Kinetic curve with doubled concentration of enzyme. The curve in red shows the kinetic curve when the enzyme concentration was not doubled.
Doubling the enzyme concentration doubles the maximum reaction velocity while the value remains unaffected.
The Michaelis-Menten equation is used to study enzyme kinetics.
Michaelis-Menten equation is given by
Here is the velocity of the chemical reaction, denotes the concentration of the substrate, is the saturation reaction rate and is Michaelis-Menten constant which is related to the binding affinity of the substrate to the enzyme. Figure 1: Reaction velocity versus substrate concentration for a particular enzyme-substrate pair a)
The binding affinity of a substrate with an enzyme is measured in terms of
It equals the substrate concentration when the reaction velocity is half the saturation reaction velocity. A lower value of indicates a higher binding affinity.So, for two substrates binding to the same enzyme, the curve will be steeper for the substrate with higher binding affinity.
Figure 2: Reaction velocity versus substrate concentration for two substrates with a given enzyme. The orange color curve is for the substrate with higher binding affinity.While the Michaelis-Menten constant gets reduced due to higher binding affinity, the saturation velocity, which depends on the enzyme concentration, remains the same.
b)
The maximum reaction rate depends directly on the amount of enzyme. Doubling the enzyme concentration will double the maximum reaction velocity.
Figure 3: Kinetic curve with doubled concentration of enzyme. The curve in red shows the kinetic curve when the enzyme concentration was not doubled.Doubling the enzyme concentration doubles the maximum reaction velocity while the
value remains unaffected. 3
Describe the difference between the lock-and-key model and the induced fit model, then give a reason why the induced fit model may be more appropriate in describing enzyme mechanism.
Enzymes are large biological molecules that catalyze thousands of chemical inter-conversions in a cell. The molecule, which speeds up the chemical reaction without being consumed or produced in the reaction, is a catalyst. In the polymerization of DNA, RNA, and protein synthesis, a variety of enzymes are necessary. Enzymes increase the rate of the reaction by a millions of times faster than those of similar un-catalysed reactions. In the presence of the enzyme a reaction can occur within seconds or minutes. Thus, the reaction would undergo thousands of years to finish under enzyme-free conditions.
Enzymes are generally very specific as to the reaction and the substrates they catalyse in the reactions. Enzymes will attain specificity by identifying the substrates through the conformational entropy. The area at which the enzyme joins to the substrate is called the active site.
• The lock and key model is primarily used to explain the specificity of an enzyme that bind to the substrate. Enzymes work by physical involvement with substrates. The physical interaction alters the chemical environment of the substrate, in such a way that the energy barrier related with the change of the substrate to products is decreased. The mechanism of enzyme-substrate interaction, used to be explained as similar to a lock and key. It involves the physical structure of the enzyme, correct geometric shape, and size to fit into the pocket of the substrate. The three-dimensional configuration and feasible chemical environment inside the active site provide a suitable fit, for only one substrate.
• An induced fit model is more accurate that allows the enzyme to shape around a substrate with proper chemical properties. In induced fit model, a conformational change takes place both in enzyme and substrate due to the alteration in the conformation of the substrate. Thus, it is the initial step in its adaptation into the reaction product.
4
Glutamic acid (1 of the 20 amino acids) has a side-chain carboxyl group as shown in Figures 4.7 and 4.8.
a. Write the chemical equation for the dissociation of the side-chain COOH. Label the weak acid and the conjugate base.
b. The Henderson-Hasselbalch equation can be used to determine the ionization status of a weak acid: Use the Henderson-Hasselbalch equation to determine whether the glutamic acid side-chain carboxyl group is protonated or deprotonated at physiolo- gical pH.
as shown in Figures 4.7 and 4.8. a. Write the chemical equation for the dissociation of the side-chain COOH. Label the weak acid and the conjugate base.
b. The Henderson-Hasselbalch equation can be used to determine the ionization status of a weak acid:
Use the Henderson-Hasselbalch equation to determine whether the glutamic acid side-chain carboxyl group is protonated or deprotonated at physiolo- gical pH. Unlock Deck
Unlock for access to all 15 flashcards in this deck.
Unlock Deck
k this deck
5
Describe some ways that drugs might act as enzyme inhibitors.
Unlock Deck
Unlock for access to all 15 flashcards in this deck.
Unlock Deck
k this deck
6
Enzymes function as catalysts in biochemical reactions.
a. How does an enzyme speed up a reaction?
b. Is the Gibbs free energy of a reaction affected in the presence of an enzyme? Explain.
a. How does an enzyme speed up a reaction?
b. Is the Gibbs free energy of a reaction affected in the presence of an enzyme? Explain.
Unlock Deck
Unlock for access to all 15 flashcards in this deck.
Unlock Deck
k this deck
7
Using a biochemistry textbook, or online resources, determine which of the following proteins has quaternary structure: α-chymotrypsin, hemoglobin, insulin, myoglobin, and trypsin.
Unlock Deck
Unlock for access to all 15 flashcards in this deck.
Unlock Deck
k this deck
8
The Michaelis-Menten equation (Equation 4.2) provides information about enzyme kinetics.
a.
a. Draw a schematic of a plot of the Michaelis-Menten equation for a particular enzyme substrate pair. Be sure to label the x- and y-axes. Indicate the Vmax and Km values on the graph.
b. On your plot, also show the kinetic curve (V0 vs. [S]) for the same enzyme with a substrate for which the enzyme has a lower affinity than the substrate in
c. On your plot, also show the kinetic curve for the situation described in (a) but with an increased quantity of enzyme. Assume that the enzyme concentration is two times higher than in (a).
Unlock Deck
Unlock for access to all 15 flashcards in this deck.
Unlock Deck
k this deck
9
The value of Km was determined for three enzymes as shown below. Which of the enzymes has high affinity for its substrate and why?
Unlock Deck
Unlock for access to all 15 flashcards in this deck.
Unlock Deck
k this deck
10
Carbonic anhydrase is an enzyme important to the management of CO2 (car- bon dioxide). About 11% of the blood's CO2 is transported by hemoglobin. Most of the CO2 that enters the erythrocytes (red blood cells) dissolves in the cytoplasm (cellular fluid). It then combines with water molecules to form carbonic acid, which immediately disassociates into hydrogen ions and bicarbonate. This reaction is sped up about 250 times by the enzyme car- bonic anhydrase (Km = 1000 µM) that is located in the erythrocytes. Most of the CO2 is converted into bicarbonate as soon as it enters red blood cells, thus keeping the CO2 level in the cell lower than that of the interstitial fluid. This lowering of intracellular level is important as the concentration gradient between the interstitial fluid and the surrounding tissue increases the diffu- sion efficiency of CO2, allowing it to be removed quickly from tissues. In a reaction vessel (which simulates body conditions) it was found that, in the presence of carbonic anhydrase, 5% of the initial 0.840993 M of CO2 was converted after 2 seconds. How much CO2 will be converted after 10, 30, and 60 seconds? State any simplifying assumptions.
Unlock Deck
Unlock for access to all 15 flashcards in this deck.
Unlock Deck
k this deck
11
Cells have surface receptors that can recognize and bind to the tripeptide RGD (Arg-Gly-Asp). Tissue engineers sometimes use this adhesive peptide to render synthetic biomaterials attractive to cells.
a. Draw the chemical structure of the RGD peptide.
b. Write the acid ionization chemical equation for each ionizable group. Use the Henderson-Hasselbalch equation to determine the ionization state of each ionizable group at pH 7.4. Be sure to consider ALL the ionizable
c. What is the net charge of the RGD peptide at physiological pH?
a. Draw the chemical structure of the RGD peptide.
b. Write the acid ionization chemical equation for each ionizable group. Use the Henderson-Hasselbalch equation to determine the ionization state of each ionizable group at pH 7.4. Be sure to consider ALL the ionizable
c. What is the net charge of the RGD peptide at physiological pH?
Unlock Deck
Unlock for access to all 15 flashcards in this deck.
Unlock Deck
k this deck
12
Describe the varying levels of structure for proteins. How do scientists exper- imentally determine the protein structure?
Unlock Deck
Unlock for access to all 15 flashcards in this deck.
Unlock Deck
k this deck
13
Select one of the enzymes involved in DNA replication (see Chapter 2).
a. Describe the function of the enzyme.
b. Search the National Center for Biotechnology Information (NCBI) STRUCTURE database for a three-dimensional structure of the enzyme. Print a copy of the enzyme structure and attach it to your homework set. (http://www.ncbi.nlm.nih.gov/Structure/).
c. How do you think the structure of this enzyme facilitates its function?
d. Note: To print the file, open the structure file in Cn3D and select the view that you want to save. Select "File/Export PNG" and it will ask you for a file name and folder location that you want to save. When it is saved, you can go to the saved folder and double click on the file name; it should open up in a default image viewer. When the image is visible then and select "print."
a. Describe the function of the enzyme.
b. Search the National Center for Biotechnology Information (NCBI) STRUCTURE database for a three-dimensional structure of the enzyme. Print a copy of the enzyme structure and attach it to your homework set. (http://www.ncbi.nlm.nih.gov/Structure/).
c. How do you think the structure of this enzyme facilitates its function?
d. Note: To print the file, open the structure file in Cn3D and select the view that you want to save. Select "File/Export PNG" and it will ask you for a file name and folder location that you want to save. When it is saved, you can go to the saved folder and double click on the file name; it should open up in a default image viewer. When the image is visible then
Unlock Deck
Unlock for access to all 15 flashcards in this deck.
Unlock Deck
k this deck
14
What is remarkable about post-translational modification of proteins?
Unlock Deck
Unlock for access to all 15 flashcards in this deck.
Unlock Deck
k this deck
15
The concentration of a product, P, is measured by ultraviolet-visible spec- troscopy (UV-VIS) as a function of time. The data are tabulated here. Estimate the initial reaction rate, V0.
Unlock Deck
Unlock for access to all 15 flashcards in this deck.
Unlock Deck
k this deck
Unlock Deck
Unlock for access to all 15 flashcards in this deck.


