Deck 24: Landscape Ecology and Ecosystem Management
Full screen (f)
Question
Question
Question
Question
Question
Refer to the figure.
 A graduate student interested in using a habitat map of North America finds that it is too large of a file for his school's Geographic Information System (GIS) computers to handle.
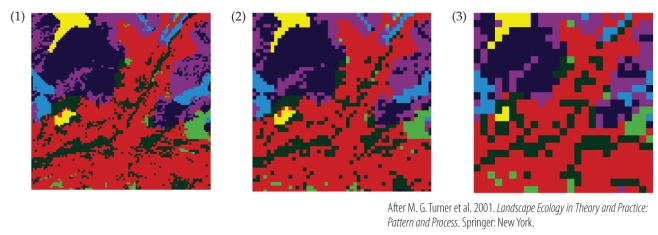
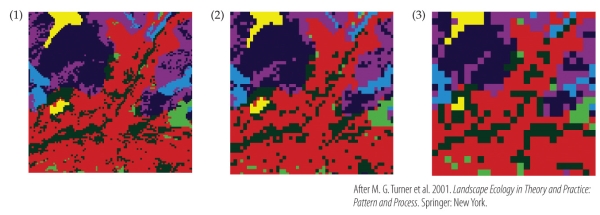
-To reduce the file size, the graduate student changes the pixel size of the file from 30 x 30 m (Panel 1) to 1000 x 1000 m (Panel 3). This student has successfully altered the _______ but in the process has lost _______.
A) extent; detail
B) grain; detail
C) scale; accuracy
D) range; precision
A graduate student interested in using a habitat map of North America finds that it is too large of a file for his school's Geographic Information System (GIS) computers to handle. -To reduce the file size, the graduate student changes the pixel size of the file from 30 x 30 m (Panel 1) to 1000 x 1000 m (Panel 3). This student has successfully altered the _______ but in the process has lost _______.
A) extent; detail
B) grain; detail
C) scale; accuracy
D) range; precision
Question
Refer to the figure.
 A graduate student interested in using a habitat map of North America finds that it is too large of a file for his school's Geographic Information System (GIS) computers to handle.
-What is the correct order of the panels from the least accurate representation of reality to the most accurate representation of reality?
A) Panel 1, Panel 2, Panel 3
B) Panel 2, Panel 1, Panel 3
C) Panel 3, Panel 2, Panel 1
D) Panel 1, Panel 3, Panel 2
A graduate student interested in using a habitat map of North America finds that it is too large of a file for his school's Geographic Information System (GIS) computers to handle. -What is the correct order of the panels from the least accurate representation of reality to the most accurate representation of reality?
A) Panel 1, Panel 2, Panel 3
B) Panel 2, Panel 1, Panel 3
C) Panel 3, Panel 2, Panel 1
D) Panel 1, Panel 3, Panel 2
Question
Question
Refer to the figure.
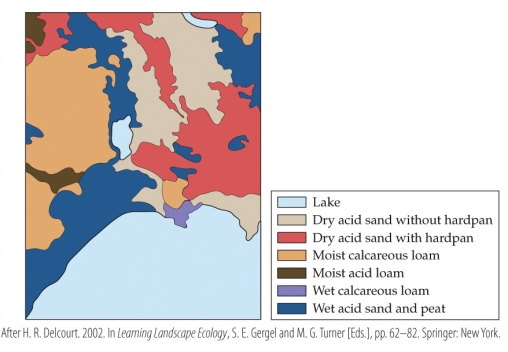 The figure shows soil types in a part of Michigan's Upper Peninsula. Assume that the top of the map is north.
- According to the map, the _______ soil type is most common on the northwestern edge of the large lake, and the _______ soil type is most common on its northeastern edge.
A) moist calcareous loam; dry acid sand
B) wet acid sand and peat; moist calcareous loam
C) wet acid sand and peat; dry acid sand without hardpan
D) dry acid sand with hardpan; dry acid sand without hardpan
The figure shows soil types in a part of Michigan's Upper Peninsula. Assume that the top of the map is north.- According to the map, the _______ soil type is most common on the northwestern edge of the large lake, and the _______ soil type is most common on its northeastern edge.
A) moist calcareous loam; dry acid sand
B) wet acid sand and peat; moist calcareous loam
C) wet acid sand and peat; dry acid sand without hardpan
D) dry acid sand with hardpan; dry acid sand without hardpan
Question
Refer to the figure.
 The figure shows soil types in a part of Michigan's Upper Peninsula. Assume that the top of the map is north.
-Where would you most likely find moist calcareous loam?
A) On the north edge of the landscape
B) On the east edge of the landscape
C) On the south edge of the landscape
D) On the west edge of the landscape
The figure shows soil types in a part of Michigan's Upper Peninsula. Assume that the top of the map is north. -Where would you most likely find moist calcareous loam?
A) On the north edge of the landscape
B) On the east edge of the landscape
C) On the south edge of the landscape
D) On the west edge of the landscape
Question
Question
Question
Question
Question
Refer to the figure.
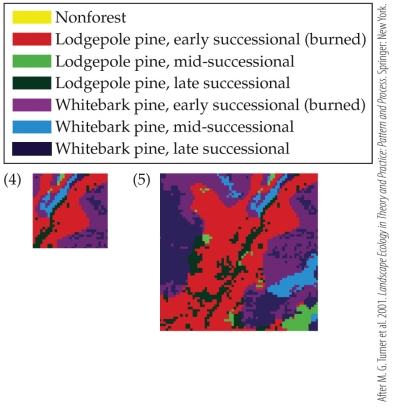 In Panel 4, the _______ is _______ than it is in Panel 5.
A) grain; smaller
B) grain; larger
C) extent; smaller
D) structure; smaller
In Panel 4, the _______ is _______ than it is in Panel 5.A) grain; smaller
B) grain; larger
C) extent; smaller
D) structure; smaller
Question
Question
Question
Question
Question
Question
Question
Refer to the figure.
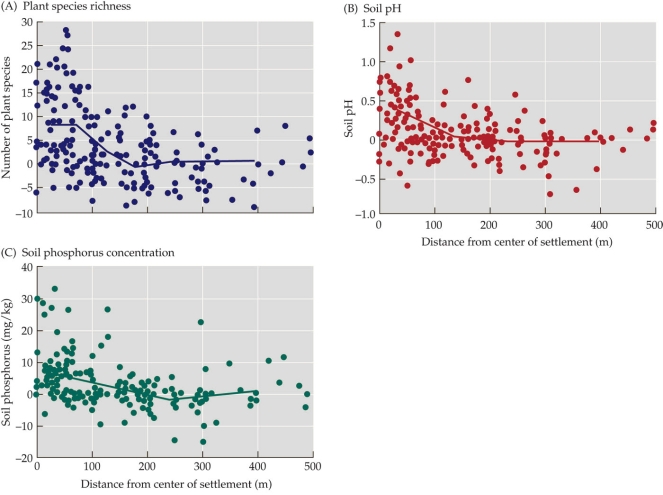 The figure shows various aspects of the legacy of Roman farming systems in central France. Based on the figure, which statement is true?
A) All locales within 100 meters of the center of a settlement site have greater than average plant species richness.
B) Soils near the center of a settlement site tend to be less acidic than those farther away.
C) Phosphorus content tends to be higher near the center of settlement sites.
D) Plant species richness and distance from settlement are directly proportional.
The figure shows various aspects of the legacy of Roman farming systems in central France. Based on the figure, which statement is true?A) All locales within 100 meters of the center of a settlement site have greater than average plant species richness.
B) Soils near the center of a settlement site tend to be less acidic than those farther away.
C) Phosphorus content tends to be higher near the center of settlement sites.
D) Plant species richness and distance from settlement are directly proportional.
Question
Question
Question
Question
Refer to the figure.
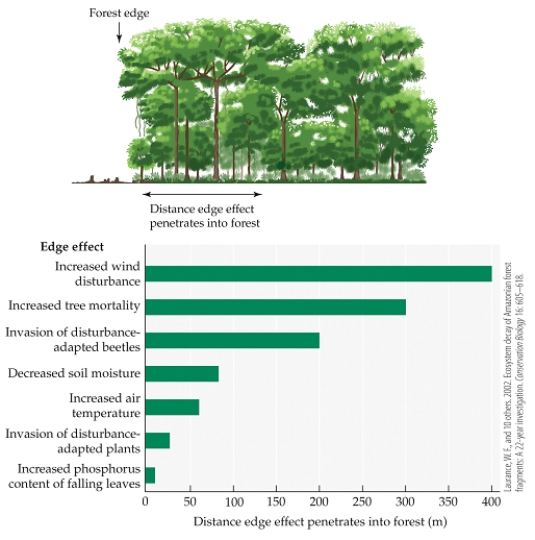 The figure shows the extent of different edge effects in Amazon rainforest fragments.
- Based on the figure, which difference would you expect to find 150 meters from the edge of a forest fragment, as compared to an area in the deep interior of the fragment?
A) A decrease in soil moisture
B) Increased air temperature
C) Increased tree mortality
D) Decreased relative humidity
The figure shows the extent of different edge effects in Amazon rainforest fragments.- Based on the figure, which difference would you expect to find 150 meters from the edge of a forest fragment, as compared to an area in the deep interior of the fragment?
A) A decrease in soil moisture
B) Increased air temperature
C) Increased tree mortality
D) Decreased relative humidity
Question
Refer to the figure.
 The figure shows the extent of different edge effects in Amazon rainforest fragments.
-Suppose a forest fragment is 600 m × 600 m. What fraction of the fragment would experience decreased relative humidity?
A) 11/36
B) 4/9
C) 1/2
D) 5/9
The figure shows the extent of different edge effects in Amazon rainforest fragments. -Suppose a forest fragment is 600 m × 600 m. What fraction of the fragment would experience decreased relative humidity?
A) 11/36
B) 4/9
C) 1/2
D) 5/9
Question
Question
Question
Question
Question
Refer to the figure.
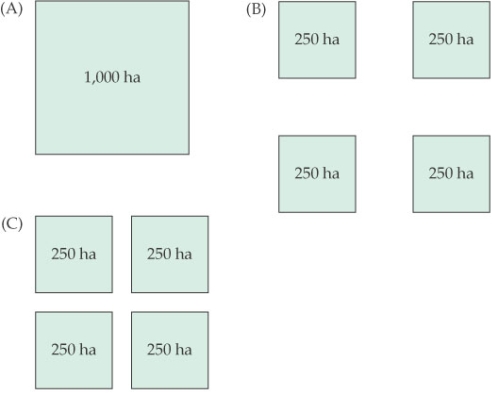 In the figure, what is the correct ranking, from best to worst, of these three arrangements of core natural areas in terms of their value as conservation sites?
A) A is better than B, which is better than C.
B) A is better than C, which is better than B.
C) B is better than A, which is better than C.
D) C is better than A, which is better than B.
In the figure, what is the correct ranking, from best to worst, of these three arrangements of core natural areas in terms of their value as conservation sites?A) A is better than B, which is better than C.
B) A is better than C, which is better than B.
C) B is better than A, which is better than C.
D) C is better than A, which is better than B.
Question
Question
Question
Question
Refer to the figure.
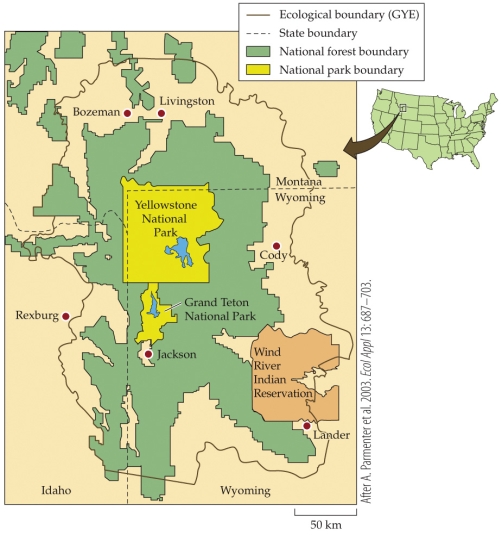 Yellowstone is considered a highly effective biological reserve because of which of the following combinations of characteristics?
A) It is large, has buffer zones, and is compact in its shape.
B) It is small, has buffer zones, and is linear in its shape.
C) It is small, lacks buffer zones, and is linear in shape.
D) It is large, lacks buffer zones, and is compact in its shape.
Yellowstone is considered a highly effective biological reserve because of which of the following combinations of characteristics?A) It is large, has buffer zones, and is compact in its shape.
B) It is small, has buffer zones, and is linear in its shape.
C) It is small, lacks buffer zones, and is linear in shape.
D) It is large, lacks buffer zones, and is compact in its shape.
Question
Question
Question
Question
Question
Question
Question
Question
Refer to the figure.
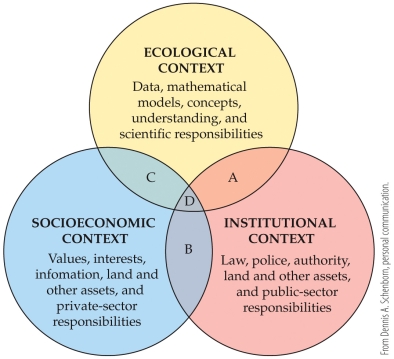 If a field biologist with the National Park Service is working to collect data on a particular species, which of the following best describes that interaction?
A) B, zone of social obligations
B) C, zone of informal decisions
C) A, zone of regulatory or management authority
D) D, zone of win-win partnerships
If a field biologist with the National Park Service is working to collect data on a particular species, which of the following best describes that interaction?A) B, zone of social obligations
B) C, zone of informal decisions
C) A, zone of regulatory or management authority
D) D, zone of win-win partnerships
Question
Question
Question
Refer to the figure.
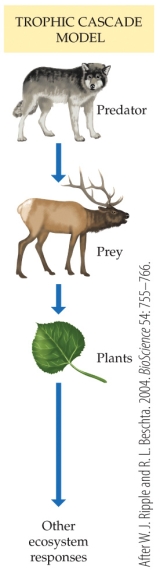 When wolves first returned to Yellowstone, coyote populations were reduced by nearly 50%. What impact do you think this would have had, for example, on foxes?
A) They would be driven to extinction.
B) Their population would remain unchanged, as wolves were killing coyote, not foxes.
C) Their population would increase due to less competition from coyote for small mammals.
D) Their population would be reduced similarly to that of the coyotes.
When wolves first returned to Yellowstone, coyote populations were reduced by nearly 50%. What impact do you think this would have had, for example, on foxes?A) They would be driven to extinction.
B) Their population would remain unchanged, as wolves were killing coyote, not foxes.
C) Their population would increase due to less competition from coyote for small mammals.
D) Their population would be reduced similarly to that of the coyotes.
Question
Refer to the figure.
Figure 1
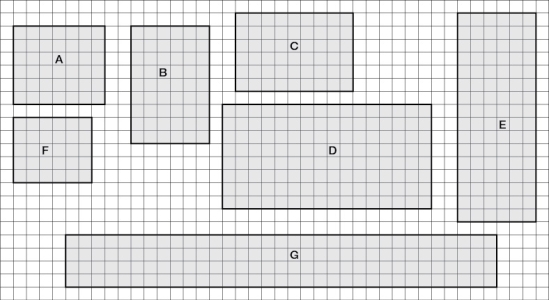
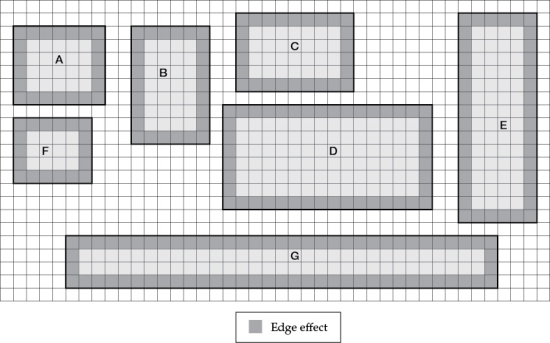
 You are working with a town to develop a conservation strategy for parks (tracts) of protected land in a suburban area (parks A-G). These seven areas are depicted in Figure 1. Each square in the grid indicates an area of 1 km2.
-Refer to Figure 1 to familiarize yourself with the key aspects of the protected areas and answer the following questions:
a) Determine the overall size of each park (in km2) and create a table of these data (this will be referred to as Table 1).
b) Based on the total area, what percent of the available land is currently protected?
c) Based solely on the size of each park, which park would you expect to have the highest species richness? Why?
d) Based solely on size and shape of each park, which park would you expect would have the most potential for preserving viable populations of a threatened species? Why?
Figure 1
You are working with a town to develop a conservation strategy for parks (tracts) of protected land in a suburban area (parks A-G). These seven areas are depicted in Figure 1. Each square in the grid indicates an area of 1 km2. -Refer to Figure 1 to familiarize yourself with the key aspects of the protected areas and answer the following questions:
a) Determine the overall size of each park (in km2) and create a table of these data (this will be referred to as Table 1).
b) Based on the total area, what percent of the available land is currently protected?
c) Based solely on the size of each park, which park would you expect to have the highest species richness? Why?
d) Based solely on size and shape of each park, which park would you expect would have the most potential for preserving viable populations of a threatened species? Why?
Question
Refer to the figure.
Figure 1
 You are working with a town to develop a conservation strategy for parks (tracts) of protected land in a suburban area (parks A-G). These seven areas are depicted in Figure 1. Each square in the grid indicates an area of 1 km2.
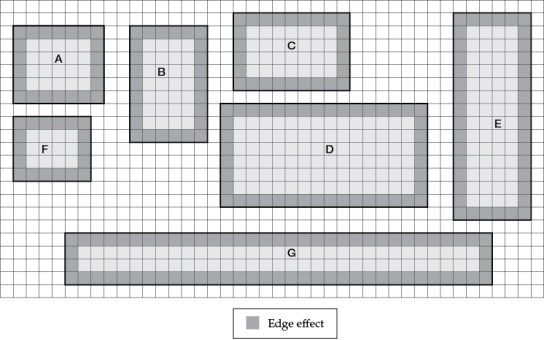
- Refer to Figure 1 to familiarize yourself with the key aspects of the protected areas. Suppose the parks are susceptible to edge effects in the form of increased air temperature. Air temperature penetrates 1 km into the parks. Areas of the park that are more than 1 km from an edge are unaffected, and air temperature does not increase in those areas.Answer the following questions:
a) Using Figure 1, create a new figure (this will be referred to as Figure 2) indicating the locations within each of the parks that would be affected by edge effects.
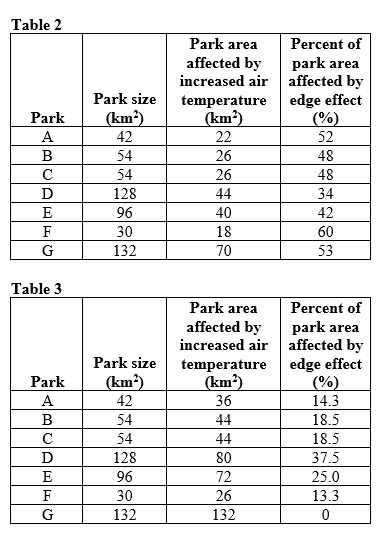
b) Summarize how this edge effect would affect each of the parks (A-G) by creating a table (this will be referred to as Table 2). Based on the size (km2) of each park and the edge effects you sketched for Figure 2, determine for each park: 1) the area affected by increased air temperatures (in km2), and 2), based on the total area of each park and the area that would be affected by edge effects, the (%) of each park area affected by edge effect.
c) Which park would be most affected by edge effects in terms of total area affected? Which park would be most affected by edge effects in terms of percent of park area? Which park would be least affected by edge effects in terms of total area affected? Which park would be least affected by edge effects in terms of percent of park area?
Figure 1
You are working with a town to develop a conservation strategy for parks (tracts) of protected land in a suburban area (parks A-G). These seven areas are depicted in Figure 1. Each square in the grid indicates an area of 1 km2.- Refer to Figure 1 to familiarize yourself with the key aspects of the protected areas. Suppose the parks are susceptible to edge effects in the form of increased air temperature. Air temperature penetrates 1 km into the parks. Areas of the park that are more than 1 km from an edge are unaffected, and air temperature does not increase in those areas.Answer the following questions:
a) Using Figure 1, create a new figure (this will be referred to as Figure 2) indicating the locations within each of the parks that would be affected by edge effects.
b) Summarize how this edge effect would affect each of the parks (A-G) by creating a table (this will be referred to as Table 2). Based on the size (km2) of each park and the edge effects you sketched for Figure 2, determine for each park: 1) the area affected by increased air temperatures (in km2), and 2), based on the total area of each park and the area that would be affected by edge effects, the (%) of each park area affected by edge effect.
c) Which park would be most affected by edge effects in terms of total area affected? Which park would be most affected by edge effects in terms of percent of park area? Which park would be least affected by edge effects in terms of total area affected? Which park would be least affected by edge effects in terms of percent of park area?
Question
Refer to the figure.
Figure 1
 You are working with a town to develop a conservation strategy for parks (tracts) of protected land in a suburban area (parks A-G). These seven areas are depicted in Figure 1. Each square in the grid indicates an area of 1 km2.
-Refer to Figure 1 to familiarize yourself with the key aspects of the protected areas. Suppose the parks are susceptible to edge effects in the form of increased tree mortality and that this edge effect penetrates 2 km into the parks. Areas of the park that are more than 2 km from an edge are unaffected, and tree mortality does not increase in those areas.Answer the following questions:
a) Using Figure 1, create a new figure (this will be referred to as Figure 3) indicating the areas of the parks that would be affected by the edge effect of increased tree mortality.
b) Summarize how this edge effect would affect each of the parks (A-G) by creating a new table (this will be referred to as Table 3). Based on the size (km2) of each park and the edge effects you sketched in for Figure 3, determine how much area within each park would be affected by increased tree mortality (in km2). Based on the total area of each park and the area that would be affected by edge effects, determine the area of each park (in %) that would not be affected by edge effects.
c) In which park would the most land area (in km2) be affected by the increased tree mortality? In which park would the least land area be affected by increased tree mortality (km2)? Which park would have the lowest percent unaffected area? Which park would have the highest percent unaffected area?
Figure 1
You are working with a town to develop a conservation strategy for parks (tracts) of protected land in a suburban area (parks A-G). These seven areas are depicted in Figure 1. Each square in the grid indicates an area of 1 km2. -Refer to Figure 1 to familiarize yourself with the key aspects of the protected areas. Suppose the parks are susceptible to edge effects in the form of increased tree mortality and that this edge effect penetrates 2 km into the parks. Areas of the park that are more than 2 km from an edge are unaffected, and tree mortality does not increase in those areas.Answer the following questions:
a) Using Figure 1, create a new figure (this will be referred to as Figure 3) indicating the areas of the parks that would be affected by the edge effect of increased tree mortality.
b) Summarize how this edge effect would affect each of the parks (A-G) by creating a new table (this will be referred to as Table 3). Based on the size (km2) of each park and the edge effects you sketched in for Figure 3, determine how much area within each park would be affected by increased tree mortality (in km2). Based on the total area of each park and the area that would be affected by edge effects, determine the area of each park (in %) that would not be affected by edge effects.
c) In which park would the most land area (in km2) be affected by the increased tree mortality? In which park would the least land area be affected by increased tree mortality (km2)? Which park would have the lowest percent unaffected area? Which park would have the highest percent unaffected area?
Question
Refer to the figure.
Figure 1
 You are working with a town to develop a conservation strategy for parks (tracts) of protected land in a suburban area (parks A-G). These seven areas are depicted in Figure 1. Each square in the grid indicates an area of 1 km2.
-Refer to Figure 1 to familiarize yourself with the key aspects of the protected areas. Based on how forests in the park respond to edge effects, do you think that increased temperature alone could explain the biotic response (tree mortality) to edges seen in these examples? Why or why not?
Figure 1
You are working with a town to develop a conservation strategy for parks (tracts) of protected land in a suburban area (parks A-G). These seven areas are depicted in Figure 1. Each square in the grid indicates an area of 1 km2. -Refer to Figure 1 to familiarize yourself with the key aspects of the protected areas. Based on how forests in the park respond to edge effects, do you think that increased temperature alone could explain the biotic response (tree mortality) to edges seen in these examples? Why or why not?
Question
Refer to the figure and tables.
Figure 1

 You are working with a town to develop a conservation strategy for parks (tracts) of protected land in a suburban area (parks A-G). These seven areas are depicted in Figure 1. Each square in the grid indicates an area of 1 km2.
-Refer to Figure 1 to familiarize yourself with the key aspects of the protected areas. Based on the data for edge effects you collected in Tables 2 and 3, are the patterns consistent with the expected impact of edges on parks of different shapes and sizes? What assumptions have you made in this analysis?
Figure 1
You are working with a town to develop a conservation strategy for parks (tracts) of protected land in a suburban area (parks A-G). These seven areas are depicted in Figure 1. Each square in the grid indicates an area of 1 km2. -Refer to Figure 1 to familiarize yourself with the key aspects of the protected areas. Based on the data for edge effects you collected in Tables 2 and 3, are the patterns consistent with the expected impact of edges on parks of different shapes and sizes? What assumptions have you made in this analysis?
Question
Refer to the figures.
Figure 1
 Figure 2
 You are working with a town to develop a conservation strategy for parks (tracts) of protected land in a suburban area (parks A-G). These seven areas are depicted in Figure 1. Each square in the grid indicates an area of 1 km2.
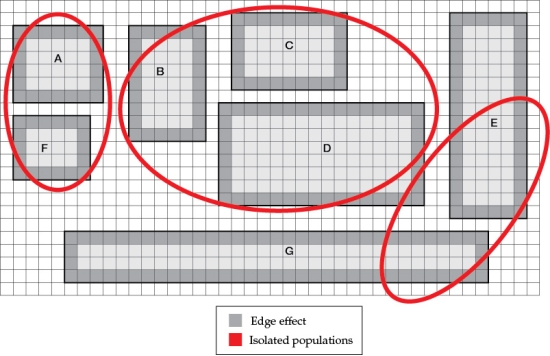
-Refer to Figure 1 to familiarize yourself with the key aspects of the protected areas. Suppose a species of bird lives in the parks in this area. These birds will fly among forest patches, but will only cross a maximum of 3 km of disturbed forest. The forest habitat that the birds require is disturbed by an edge effect that penetrates 1 km into the forest. Based on this information about the birds' movement preferences and the extent of edge effects, which patches could the birds move among? How many isolated populations of this bird species would you expect to find among the parks, and which parks would form each of the newly isolated populations? On Figure 2, circle the isolated populations (this will be referred to as Figure 4).
Figure 1
Figure 2 You are working with a town to develop a conservation strategy for parks (tracts) of protected land in a suburban area (parks A-G). These seven areas are depicted in Figure 1. Each square in the grid indicates an area of 1 km2. -Refer to Figure 1 to familiarize yourself with the key aspects of the protected areas. Suppose a species of bird lives in the parks in this area. These birds will fly among forest patches, but will only cross a maximum of 3 km of disturbed forest. The forest habitat that the birds require is disturbed by an edge effect that penetrates 1 km into the forest. Based on this information about the birds' movement preferences and the extent of edge effects, which patches could the birds move among? How many isolated populations of this bird species would you expect to find among the parks, and which parks would form each of the newly isolated populations? On Figure 2, circle the isolated populations (this will be referred to as Figure 4).
Question
Refer to the figures.
Figure 1
 Figure 2
 Figure 4
 You are working with a town to develop a conservation strategy for parks (tracts) of protected land in a suburban area (parks A-G). These seven areas are depicted in Figure 1. Each square in the grid indicates an area of 1 km2.
- Refer to Figure 1 to familiarize yourself with the key aspects of the protected areas. Suppose you are the park manager in this area, and you have the option to build a limited number of habitat corridors to connect different parks to one another and reconnect the populations of birds that have been isolated from one another by the 1 km edge effect. However, your budget is limited. What is the minimum number of habitat corridors that would be required to reconnect the isolated populations of birds you (see Figure 4)? Where would you create these corridors, and why? On Figure 2, indicate the areas you would choose to create habitat corridors (this will be referred to as Figure 5).
Figure 1
Figure 2 Figure 4 You are working with a town to develop a conservation strategy for parks (tracts) of protected land in a suburban area (parks A-G). These seven areas are depicted in Figure 1. Each square in the grid indicates an area of 1 km2.- Refer to Figure 1 to familiarize yourself with the key aspects of the protected areas. Suppose you are the park manager in this area, and you have the option to build a limited number of habitat corridors to connect different parks to one another and reconnect the populations of birds that have been isolated from one another by the 1 km edge effect. However, your budget is limited. What is the minimum number of habitat corridors that would be required to reconnect the isolated populations of birds you (see Figure 4)? Where would you create these corridors, and why? On Figure 2, indicate the areas you would choose to create habitat corridors (this will be referred to as Figure 5).
Question
Refer to the figures.
Figure 1
 Figure 2
 You are working with a town to develop a conservation strategy for parks (tracts) of protected land in a suburban area (parks A-G). These seven areas are depicted in Figure 1. Each square in the grid indicates an area of 1 km2.
- Refer to Figure 1 to familiarize yourself with the key aspects of the protected areas. Suppose a highly virulent pathogen has invaded park B. The pathogen infects the birds in the undisturbed habitat in the park and is spread through direct contact among individuals. Based on the birds' movement preferences, what could you do to contain the spread of this pathogen? (Assume the protected areas are as pictured in Figure 2, with the edge effects of increased air temperature).
Figure 1
Figure 2 You are working with a town to develop a conservation strategy for parks (tracts) of protected land in a suburban area (parks A-G). These seven areas are depicted in Figure 1. Each square in the grid indicates an area of 1 km2.- Refer to Figure 1 to familiarize yourself with the key aspects of the protected areas. Suppose a highly virulent pathogen has invaded park B. The pathogen infects the birds in the undisturbed habitat in the park and is spread through direct contact among individuals. Based on the birds' movement preferences, what could you do to contain the spread of this pathogen? (Assume the protected areas are as pictured in Figure 2, with the edge effects of increased air temperature).
Question
Refer to the figures.
Figure 1
 Figure 2
 You are working with a town to develop a conservation strategy for parks (tracts) of protected land in a suburban area (parks A-G). These seven areas are depicted in Figure 1. Each square in the grid indicates an area of 1 km2.
-Refer to Figure 1 to familiarize yourself with the key aspects of the protected areas. Suppose a highly virulent pathogen has invaded park B. The pathogen infects the birds in the undisturbed habitat in the park and is spread through direct contact among individuals. As the park manager, what are your two primary goals in responding to this pathogen? The actions that you decide to take to control the spread of the deadly pathogen are an example of what aspect of conservation biology? Who are the stakeholders?
Figure 1
Figure 2 You are working with a town to develop a conservation strategy for parks (tracts) of protected land in a suburban area (parks A-G). These seven areas are depicted in Figure 1. Each square in the grid indicates an area of 1 km2. -Refer to Figure 1 to familiarize yourself with the key aspects of the protected areas. Suppose a highly virulent pathogen has invaded park B. The pathogen infects the birds in the undisturbed habitat in the park and is spread through direct contact among individuals. As the park manager, what are your two primary goals in responding to this pathogen? The actions that you decide to take to control the spread of the deadly pathogen are an example of what aspect of conservation biology? Who are the stakeholders?
Question
Refer to the figures.
Figure 1
 Figure 2
 You are working with a town to develop a conservation strategy for parks (tracts) of protected land in a suburban area (parks A-G). These seven areas are depicted in Figure 1. Each square in the grid indicates an area of 1 km2.
- Refer to Figure 1 to familiarize yourself with the key aspects of the protected areas. Suppose a species of bird lives in the parks in this area. These birds will fly among forest patches, but will only cross a maximum of 3 km of disturbed forest. The forest habitat that the birds require is disturbed by an edge effect that penetrates 1 km into the forest. Suppose for these analyses you assess landscape characteristics for each 1 km2 quadrat. If you decided instead to increase the size of your quadrats to 10 km2, could you change the scale of your analysis with the data you have? Would this be an appropriate scale for a study of the movement preferences of the bird species?
Figure 1
Figure 2 You are working with a town to develop a conservation strategy for parks (tracts) of protected land in a suburban area (parks A-G). These seven areas are depicted in Figure 1. Each square in the grid indicates an area of 1 km2.- Refer to Figure 1 to familiarize yourself with the key aspects of the protected areas. Suppose a species of bird lives in the parks in this area. These birds will fly among forest patches, but will only cross a maximum of 3 km of disturbed forest. The forest habitat that the birds require is disturbed by an edge effect that penetrates 1 km into the forest. Suppose for these analyses you assess landscape characteristics for each 1 km2 quadrat. If you decided instead to increase the size of your quadrats to 10 km2, could you change the scale of your analysis with the data you have? Would this be an appropriate scale for a study of the movement preferences of the bird species?
Question
Question
Question
Refer to the figure.
 You are the lead researcher studying continental migratory patterns of the sandhill crane (Antigone canadensis) to track their overall movements across the landscape. Although you would like to know roughly what habitat they land in, accuracy on a 0.5 km2 area will suffice. Given this information, which of the following images (1-6) would most efficient to use for analyzing these migratory routes of the sandhill crane?
A) Image 6
B) Image 5
C) Image 1
D) Image 3
You are the lead researcher studying continental migratory patterns of the sandhill crane (Antigone canadensis) to track their overall movements across the landscape. Although you would like to know roughly what habitat they land in, accuracy on a 0.5 km2 area will suffice. Given this information, which of the following images (1-6) would most efficient to use for analyzing these migratory routes of the sandhill crane?A) Image 6
B) Image 5
C) Image 1
D) Image 3
Question
Question
Question
Refer to the photo.
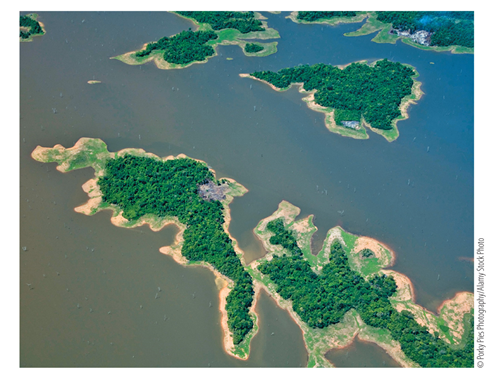 Consider the forest fragmentation that took place in the formation of Lago Guri. What effect would this have on the trophic cascades in this habitat?
A) Trophic cascades would create more trophic levels.
B) Trophic cascades would stop entirely due to a loss of generalists.
C) Trophic cascades would be altered due to the likely loss of top predators.
D) It would encourage greater numbers of trophic cascades due to the influx of new top predators.
Consider the forest fragmentation that took place in the formation of Lago Guri. What effect would this have on the trophic cascades in this habitat?A) Trophic cascades would create more trophic levels.
B) Trophic cascades would stop entirely due to a loss of generalists.
C) Trophic cascades would be altered due to the likely loss of top predators.
D) It would encourage greater numbers of trophic cascades due to the influx of new top predators.
Question
Refer to the figure.
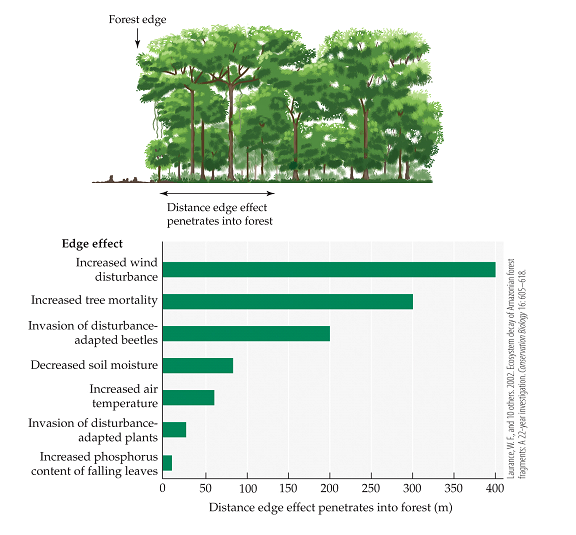 The figure shows the persistence of edge effects in Amazon rainforest fragments. Suppose a forest fragment is 500 m × 500 m. What fraction of the fragment would experience decreased relative humidity due to edge effects?
A) 1/25
B) 4/25
C) 16/25
D) 20/25
The figure shows the persistence of edge effects in Amazon rainforest fragments. Suppose a forest fragment is 500 m × 500 m. What fraction of the fragment would experience decreased relative humidity due to edge effects?A) 1/25
B) 4/25
C) 16/25
D) 20/25
Question
Question
Question
Question
Question
Question
Question
Question
Refer to the figure.
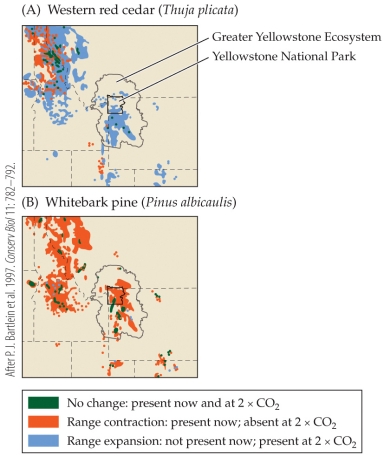 The figure shows the projected changes in distribution of two tree species if carbon dioxide concentrations double. What would the most widespread effect be on western red cedar after such an increase in carbon dioxide?
A) No change
B) Range expansion
C) Range contraction
D) Extinction
The figure shows the projected changes in distribution of two tree species if carbon dioxide concentrations double. What would the most widespread effect be on western red cedar after such an increase in carbon dioxide?A) No change
B) Range expansion
C) Range contraction
D) Extinction

Unlock Deck
Sign up to unlock the cards in this deck!
Unlock Deck
Unlock Deck
1/71
Play
Full screen (f)
Deck 24: Landscape Ecology and Ecosystem Management
1
During the middle of the twentieth century, the increased elk population in the Greater Yellowstone Ecosystem led to a(n) _______ in the beaver population. The primary reason was that _______.
A) increase; elk were competing with beaver predators
B) increase; elk diseases were also affecting the beaver predators
C) decrease; elk diseases were also affecting beavers
D) decrease; elk were eating preferred food plants of the beavers
A) increase; elk were competing with beaver predators
B) increase; elk diseases were also affecting the beaver predators
C) decrease; elk diseases were also affecting beavers
D) decrease; elk were eating preferred food plants of the beavers
D
2
Landscape ecology is the study of
A) how organisms interact with their environment.
B) the causes and consequences of spatial variation across a range of scales.
C) ecosystems.
D) the environmental effects of human activities.
A) how organisms interact with their environment.
B) the causes and consequences of spatial variation across a range of scales.
C) ecosystems.
D) the environmental effects of human activities.
B
3
A landscape is an area that must be
A) spatially heterogeneous with respect to at least one element or feature.
B) at least 1 ha in area.
C) shaped as a quadrilateral.
D) sampled via aerial photography.
A) spatially heterogeneous with respect to at least one element or feature.
B) at least 1 ha in area.
C) shaped as a quadrilateral.
D) sampled via aerial photography.
A
4
A researcher is studying hellbenders (Cryptobranchus alleganiensis) in their study area, which encompasses the Great Smoky Mountains National Park. As such, the researcher only uses GIS files that are specific to the park rather than state-wide or nationwide files. The researcher is considering which of the following aspects of landscape analysis?
A) Scale
B) Extent
C) Grain
D) Composition
A) Scale
B) Extent
C) Grain
D) Composition
Unlock Deck
Unlock for access to all 71 flashcards in this deck.
Unlock Deck
k this deck
5
Refer to the figure.
A graduate student interested in using a habitat map of North America finds that it is too large of a file for his school's Geographic Information System (GIS) computers to handle.
-To reduce the file size, the graduate student changes the pixel size of the file from 30 x 30 m (Panel 1) to 1000 x 1000 m (Panel 3). This student has successfully altered the _______ but in the process has lost _______.
A) extent; detail
B) grain; detail
C) scale; accuracy
D) range; precision
A graduate student interested in using a habitat map of North America finds that it is too large of a file for his school's Geographic Information System (GIS) computers to handle. -To reduce the file size, the graduate student changes the pixel size of the file from 30 x 30 m (Panel 1) to 1000 x 1000 m (Panel 3). This student has successfully altered the _______ but in the process has lost _______.
A) extent; detail
B) grain; detail
C) scale; accuracy
D) range; precision
Unlock Deck
Unlock for access to all 71 flashcards in this deck.
Unlock Deck
k this deck
6
Refer to the figure.
A graduate student interested in using a habitat map of North America finds that it is too large of a file for his school's Geographic Information System (GIS) computers to handle.
-What is the correct order of the panels from the least accurate representation of reality to the most accurate representation of reality?
A) Panel 1, Panel 2, Panel 3
B) Panel 2, Panel 1, Panel 3
C) Panel 3, Panel 2, Panel 1
D) Panel 1, Panel 3, Panel 2
A graduate student interested in using a habitat map of North America finds that it is too large of a file for his school's Geographic Information System (GIS) computers to handle. -What is the correct order of the panels from the least accurate representation of reality to the most accurate representation of reality?
A) Panel 1, Panel 2, Panel 3
B) Panel 2, Panel 1, Panel 3
C) Panel 3, Panel 2, Panel 1
D) Panel 1, Panel 3, Panel 2
Unlock Deck
Unlock for access to all 71 flashcards in this deck.
Unlock Deck
k this deck
7
The composite of heterogeneous elements of a landscape is known as a(n)
A) structure.
B) mosaic.
C) grain.
D) extent.
A) structure.
B) mosaic.
C) grain.
D) extent.
Unlock Deck
Unlock for access to all 71 flashcards in this deck.
Unlock Deck
k this deck
8
Refer to the figure.
The figure shows soil types in a part of Michigan's Upper Peninsula. Assume that the top of the map is north.
- According to the map, the _______ soil type is most common on the northwestern edge of the large lake, and the _______ soil type is most common on its northeastern edge.
A) moist calcareous loam; dry acid sand
B) wet acid sand and peat; moist calcareous loam
C) wet acid sand and peat; dry acid sand without hardpan
D) dry acid sand with hardpan; dry acid sand without hardpan
The figure shows soil types in a part of Michigan's Upper Peninsula. Assume that the top of the map is north.- According to the map, the _______ soil type is most common on the northwestern edge of the large lake, and the _______ soil type is most common on its northeastern edge.
A) moist calcareous loam; dry acid sand
B) wet acid sand and peat; moist calcareous loam
C) wet acid sand and peat; dry acid sand without hardpan
D) dry acid sand with hardpan; dry acid sand without hardpan
Unlock Deck
Unlock for access to all 71 flashcards in this deck.
Unlock Deck
k this deck
9
Refer to the figure.
The figure shows soil types in a part of Michigan's Upper Peninsula. Assume that the top of the map is north.
-Where would you most likely find moist calcareous loam?
A) On the north edge of the landscape
B) On the east edge of the landscape
C) On the south edge of the landscape
D) On the west edge of the landscape
The figure shows soil types in a part of Michigan's Upper Peninsula. Assume that the top of the map is north. -Where would you most likely find moist calcareous loam?
A) On the north edge of the landscape
B) On the east edge of the landscape
C) On the south edge of the landscape
D) On the west edge of the landscape
Unlock Deck
Unlock for access to all 71 flashcards in this deck.
Unlock Deck
k this deck
10
Rodent activity has led to _______ losses of nuts along the edges of macadamia nut plantations that are next to _______.
A) increased; forests
B) increased; other agricultural areas
C) decreased; forests
D) decreased; other agricultural areas
A) increased; forests
B) increased; other agricultural areas
C) decreased; forests
D) decreased; other agricultural areas
Unlock Deck
Unlock for access to all 71 flashcards in this deck.
Unlock Deck
k this deck
11
Which aspect of a landscape would most likely be estimated by means of a diversity index?
A) Structure
B) Composition
C) Extent
D) Fragmentation
A) Structure
B) Composition
C) Extent
D) Fragmentation
Unlock Deck
Unlock for access to all 71 flashcards in this deck.
Unlock Deck
k this deck
12
In studies of landscapes, the size of the smallest homogenous unit of study that determines the resolution at which the landscape is viewed is called the
A) extent.
B) composition.
C) scope.
D) grain.
A) extent.
B) composition.
C) scope.
D) grain.
Unlock Deck
Unlock for access to all 71 flashcards in this deck.
Unlock Deck
k this deck
13
Suppose a two-dimensional landscape image consists of 20,000 square pixels. If the size of each pixel were cut in half, _______ as many pixels would be needed to portray the same landscape. Such a decrease in the pixel size would represent a change in the _______ of the landscape.
A) twice; grain
B) twice; extent
C) four times; extent
D) four times; grain
A) twice; grain
B) twice; extent
C) four times; extent
D) four times; grain
Unlock Deck
Unlock for access to all 71 flashcards in this deck.
Unlock Deck
k this deck
14
Refer to the figure.
In Panel 4, the _______ is _______ than it is in Panel 5.
A) grain; smaller
B) grain; larger
C) extent; smaller
D) structure; smaller
In Panel 4, the _______ is _______ than it is in Panel 5.A) grain; smaller
B) grain; larger
C) extent; smaller
D) structure; smaller
Unlock Deck
Unlock for access to all 71 flashcards in this deck.
Unlock Deck
k this deck
15
Henry and colleagues' studies of the behavior of the bat Rhinophylla pumilio showed that these bats
A) were likely to visit fragments of forest that had abundant food resources.
B) did not like landscapes with low grain.
C) were less likely to visit highly connected forest fragments than they were to visit isolated forest fragments.
D) were less likely to visit isolated forest fragments than they were to visit highly connected forest fragments.
Unlock Deck
Unlock for access to all 71 flashcards in this deck.
Unlock Deck
k this deck
16
Weathers and colleagues found that inputs of sulfur are _______ at the forest edge than in the forest interior. The primary reason for this difference is that _______.
A) higher; denser canopies in the forest edge intercept more airborne particles of sulfur
B) higher; decomposers in the forest interior take up the sulfur
C) lower; denser canopies in the forest edge intercept more airborne particles of sulfur
D) lower; chemical reactions are faster at the edge
A) higher; denser canopies in the forest edge intercept more airborne particles of sulfur
B) higher; decomposers in the forest interior take up the sulfur
C) lower; denser canopies in the forest edge intercept more airborne particles of sulfur
D) lower; chemical reactions are faster at the edge
Unlock Deck
Unlock for access to all 71 flashcards in this deck.
Unlock Deck
k this deck
17
Schtickzelle and Baguette studied movement patterns in the bog fritillary butterfly and found that
A) female butterflies could not cross boundaries between habitat patches.
B) isolation of habitat patches had a negative effect on the willingness of a female to travel between patches.
C) female butterflies did not cross boundaries between aggregated patches.
D) habitat fragmentation had a positive effect on the distance female butterflies were willing to travel.
Unlock Deck
Unlock for access to all 71 flashcards in this deck.
Unlock Deck
k this deck
18
Which statement about moose browsing on Isle Royale is false?
A) It is an example of how biological processes influence landscape patterns.
B) It is an example of how landscape patterns influence biological processes.
C) High rates of browsing depress net primary productivity only via direct effects.
D) High rates of browsing depress net primary productivity via indirect effects.
Unlock Deck
Unlock for access to all 71 flashcards in this deck.
Unlock Deck
k this deck
19
Which statement about the 1988 forest fires in Yellowstone National Park is false?
A) The fires are an example of a disturbance.
B) The fires burned trees from all parts of the landscape more or less evenly.
C) The fires will likely influence the composition of the landscape for many decades to come.
D) Such extensive fires have occurred in Yellowstone about every 100-500 years.
A) The fires are an example of a disturbance.
B) The fires burned trees from all parts of the landscape more or less evenly.
C) The fires will likely influence the composition of the landscape for many decades to come.
D) Such extensive fires have occurred in Yellowstone about every 100-500 years.
Unlock Deck
Unlock for access to all 71 flashcards in this deck.
Unlock Deck
k this deck
20
According to studies by Dambrine and colleagues, forest plant communities are still being affected by disturbances created by settlements from the time of the Roman Empire. Regions near settlements have _______ than average species richness due to _______.
A) higher; higher soil pH
B) higher; lower phosphorus levels
C) lower; higher soil pH
D) lower; higher phosphorus levels
A) higher; higher soil pH
B) higher; lower phosphorus levels
C) lower; higher soil pH
D) lower; higher phosphorus levels
Unlock Deck
Unlock for access to all 71 flashcards in this deck.
Unlock Deck
k this deck
21
Refer to the figure.
The figure shows various aspects of the legacy of Roman farming systems in central France. Based on the figure, which statement is true?
A) All locales within 100 meters of the center of a settlement site have greater than average plant species richness.
B) Soils near the center of a settlement site tend to be less acidic than those farther away.
C) Phosphorus content tends to be higher near the center of settlement sites.
D) Plant species richness and distance from settlement are directly proportional.
The figure shows various aspects of the legacy of Roman farming systems in central France. Based on the figure, which statement is true?A) All locales within 100 meters of the center of a settlement site have greater than average plant species richness.
B) Soils near the center of a settlement site tend to be less acidic than those farther away.
C) Phosphorus content tends to be higher near the center of settlement sites.
D) Plant species richness and distance from settlement are directly proportional.
Unlock Deck
Unlock for access to all 71 flashcards in this deck.
Unlock Deck
k this deck
22
If the average number of plant species at a distance from the settlement sites is 22, then the average number of species near the center of the settlement sites is _______.
A) 8
B) 15
C) 30
D) 42
A) 8
B) 15
C) 30
D) 42
Unlock Deck
Unlock for access to all 71 flashcards in this deck.
Unlock Deck
k this deck
23
Terborgh and colleagues' studies showed that _______ were more abundant on the small and medium-sized islands in Lago Guri in Venezuela than in the remaining intact forest.
A) porcupines
B) large snakes
C) wild cats
D) raptors
A) porcupines
B) large snakes
C) wild cats
D) raptors
Unlock Deck
Unlock for access to all 71 flashcards in this deck.
Unlock Deck
k this deck
24
The studies by Allen and colleagues point to habitat fragmentation as a cause of the high prevalence of Lyme disease in the northeastern United States. This disease most likely spread because fragmentation has led to a(n) _______ in the population of _______.
A) increase; squirrels
B) increase; white-footed mice
C) increase; possums
D) decrease; white-footed mice
A) increase; squirrels
B) increase; white-footed mice
C) increase; possums
D) decrease; white-footed mice
Unlock Deck
Unlock for access to all 71 flashcards in this deck.
Unlock Deck
k this deck
25
Refer to the figure.
The figure shows the extent of different edge effects in Amazon rainforest fragments.
- Based on the figure, which difference would you expect to find 150 meters from the edge of a forest fragment, as compared to an area in the deep interior of the fragment?
A) A decrease in soil moisture
B) Increased air temperature
C) Increased tree mortality
D) Decreased relative humidity
The figure shows the extent of different edge effects in Amazon rainforest fragments.- Based on the figure, which difference would you expect to find 150 meters from the edge of a forest fragment, as compared to an area in the deep interior of the fragment?
A) A decrease in soil moisture
B) Increased air temperature
C) Increased tree mortality
D) Decreased relative humidity
Unlock Deck
Unlock for access to all 71 flashcards in this deck.
Unlock Deck
k this deck
26
Refer to the figure.
The figure shows the extent of different edge effects in Amazon rainforest fragments.
-Suppose a forest fragment is 600 m × 600 m. What fraction of the fragment would experience decreased relative humidity?
A) 11/36
B) 4/9
C) 1/2
D) 5/9
The figure shows the extent of different edge effects in Amazon rainforest fragments. -Suppose a forest fragment is 600 m × 600 m. What fraction of the fragment would experience decreased relative humidity?
A) 11/36
B) 4/9
C) 1/2
D) 5/9
Unlock Deck
Unlock for access to all 71 flashcards in this deck.
Unlock Deck
k this deck
27
In a large national forest of the western United States, a massive logging operation fragments a once contiguous forest into several hundred smaller blocks of varying sizes. Which of the following organisms would you expect to be most affected by this fragmentation?
A) Ants
B) Rodents
C) Mule deer
D) Mountain lions
A) Ants
B) Rodents
C) Mule deer
D) Mountain lions
Unlock Deck
Unlock for access to all 71 flashcards in this deck.
Unlock Deck
k this deck
28
Which statement about edge effects is true?
A) They are never barriers to dispersal.
B) They always inhibit dispersal.
C) Abiotic conditions usually do not change at the boundary.
D) They can consist of biotic changes associated with a boundary.
A) They are never barriers to dispersal.
B) They always inhibit dispersal.
C) Abiotic conditions usually do not change at the boundary.
D) They can consist of biotic changes associated with a boundary.
Unlock Deck
Unlock for access to all 71 flashcards in this deck.
Unlock Deck
k this deck
29
Which biotic change is usually associated with edge effects in forests in the Pacific Northwest?
A) Lower than average rate of decomposition
B) A higher than average quantity of woody debris on the forest floor
C) Higher than average temperature
D) Higher than average wind speeds
A) Lower than average rate of decomposition
B) A higher than average quantity of woody debris on the forest floor
C) Higher than average temperature
D) Higher than average wind speeds
Unlock Deck
Unlock for access to all 71 flashcards in this deck.
Unlock Deck
k this deck
30
Which statement about Madagascar is false?
A) It is a global priority for conservation.
B) It is home to many species of endemic lemurs.
C) Its biota is imperiled because little of the original forest remains.
D) Use of core natural areas imperils its biodiversity.
A) It is a global priority for conservation.
B) It is home to many species of endemic lemurs.
C) Its biota is imperiled because little of the original forest remains.
D) Use of core natural areas imperils its biodiversity.
Unlock Deck
Unlock for access to all 71 flashcards in this deck.
Unlock Deck
k this deck
31
Refer to the figure.
In the figure, what is the correct ranking, from best to worst, of these three arrangements of core natural areas in terms of their value as conservation sites?
A) A is better than B, which is better than C.
B) A is better than C, which is better than B.
C) B is better than A, which is better than C.
D) C is better than A, which is better than B.
In the figure, what is the correct ranking, from best to worst, of these three arrangements of core natural areas in terms of their value as conservation sites?A) A is better than B, which is better than C.
B) A is better than C, which is better than B.
C) B is better than A, which is better than C.
D) C is better than A, which is better than B.
Unlock Deck
Unlock for access to all 71 flashcards in this deck.
Unlock Deck
k this deck
32
Suppose that you have 900 km2 to devote to a core natural area. All other things being equal, which arrangement would best foster the preservation of biodiversity?
(1) A single area that is 30 km × 30 km
(2) A single area that is 10 km × 90 km
(3) Two areas that are each 10 km × 45 km
A) Arrangement 1
B) Arrangement 2
C) Arrangement 3
D) Arrangements 1 and 2 are equally good, and both are better than 3.
(1) A single area that is 30 km × 30 km
(2) A single area that is 10 km × 90 km
(3) Two areas that are each 10 km × 45 km
A) Arrangement 1
B) Arrangement 2
C) Arrangement 3
D) Arrangements 1 and 2 are equally good, and both are better than 3.
Unlock Deck
Unlock for access to all 71 flashcards in this deck.
Unlock Deck
k this deck
33
Assuming all other factors are equal, which statement about reserve design is false?
A) A reserve surrounded by a buffer area can foster biodiversity more successfully than one without a buffer area.
B) One large reserve can foster biodiversity more successfully than a few small reserves of the same total area.
C) Several reserves far apart can foster biodiversity more successfully than the same number of reserves close together.
D) Several connected reserves can foster biodiversity more successfully than several disconnected reserves.
Unlock Deck
Unlock for access to all 71 flashcards in this deck.
Unlock Deck
k this deck
34
Which of the following would be most suited for some degree of human activity, such as selective logging?
A) Biological reserves
B) Buffer zones
C) Core natural areas
D) National parks
A) Biological reserves
B) Buffer zones
C) Core natural areas
D) National parks
Unlock Deck
Unlock for access to all 71 flashcards in this deck.
Unlock Deck
k this deck
35
Refer to the figure.
Yellowstone is considered a highly effective biological reserve because of which of the following combinations of characteristics?
A) It is large, has buffer zones, and is compact in its shape.
B) It is small, has buffer zones, and is linear in its shape.
C) It is small, lacks buffer zones, and is linear in shape.
D) It is large, lacks buffer zones, and is compact in its shape.
Yellowstone is considered a highly effective biological reserve because of which of the following combinations of characteristics?A) It is large, has buffer zones, and is compact in its shape.
B) It is small, has buffer zones, and is linear in its shape.
C) It is small, lacks buffer zones, and is linear in shape.
D) It is large, lacks buffer zones, and is compact in its shape.
Unlock Deck
Unlock for access to all 71 flashcards in this deck.
Unlock Deck
k this deck
36
Under what circumstances would disconnected reserves most likely be superior to connected ones as conservation sites?
A) When the prospect for the spread of virulent disease is high
B) When the reserves are surrounded by buffer zones
C) When the resident organisms have limited dispersal ability
D) When funding for setting up reserves is low
A) When the prospect for the spread of virulent disease is high
B) When the reserves are surrounded by buffer zones
C) When the resident organisms have limited dispersal ability
D) When funding for setting up reserves is low
Unlock Deck
Unlock for access to all 71 flashcards in this deck.
Unlock Deck
k this deck
37
Which statement about habitat corridors is false?
A) They may facilitate the movement of pathogens.
B) They may facilitate the movement of species that we want to protect.
C) They were included in the plans of Kremen and colleagues for the design of Masoala National Park.
D) Researchers found that they greatly decreased predation of indigo buntings at the Savannah River Ecological Laboratory.
Unlock Deck
Unlock for access to all 71 flashcards in this deck.
Unlock Deck
k this deck
38
In the studies by Haddad and colleagues at the Savannah River Ecological Laboratory, habitat corridors were shown to increase the movements of pollinators and to enhance fruit production. What was the control used in these experiments?
A) Pesticides that prevented pollinators from entering certain corridors
B) Winged patches with extensions that resembled corridors but did not lead anywhere
C) An electric fence that stopped the movement of pollinators
D) GIS to monitor the movements of the pollinators
A) Pesticides that prevented pollinators from entering certain corridors
B) Winged patches with extensions that resembled corridors but did not lead anywhere
C) An electric fence that stopped the movement of pollinators
D) GIS to monitor the movements of the pollinators
Unlock Deck
Unlock for access to all 71 flashcards in this deck.
Unlock Deck
k this deck
39
Janzen's work converting pasturelands to tropical dry forest is an example of
A) ecological restoration.
B) limiting edge effects.
C) ecosystem management.
D) ecosystem facilitation.
A) ecological restoration.
B) limiting edge effects.
C) ecosystem management.
D) ecosystem facilitation.
Unlock Deck
Unlock for access to all 71 flashcards in this deck.
Unlock Deck
k this deck
40
Compared with traditional management practices, ecosystem management emphasizes
A) single-issue polarization.
B) predictability and control.
C) the possibility of shifting practices if circumstances warrant.
D) reductionism.
A) single-issue polarization.
B) predictability and control.
C) the possibility of shifting practices if circumstances warrant.
D) reductionism.
Unlock Deck
Unlock for access to all 71 flashcards in this deck.
Unlock Deck
k this deck
41
Which statement about adaptive management is false?
A) The first step is almost always the development of a management plan.
B) It is an iterative process.
C) Monitoring is a vital component.
D) Its practices have been applied to real ecosystems.
A) The first step is almost always the development of a management plan.
B) It is an iterative process.
C) Monitoring is a vital component.
D) Its practices have been applied to real ecosystems.
Unlock Deck
Unlock for access to all 71 flashcards in this deck.
Unlock Deck
k this deck
42
Which statement about the role of humans in ecosystems and ecosystem management is false?
A) Humans are an integral part of ecosystems.
B) Ecosystem management does not take economic considerations into account.
C) People need to preserve natural ecosystems for many reasons.
D) Ecosystem management includes educating the public about the vital roles natural ecosystems perform.
A) Humans are an integral part of ecosystems.
B) Ecosystem management does not take economic considerations into account.
C) People need to preserve natural ecosystems for many reasons.
D) Ecosystem management includes educating the public about the vital roles natural ecosystems perform.
Unlock Deck
Unlock for access to all 71 flashcards in this deck.
Unlock Deck
k this deck
43
Refer to the figure.
If a field biologist with the National Park Service is working to collect data on a particular species, which of the following best describes that interaction?
A) B, zone of social obligations
B) C, zone of informal decisions
C) A, zone of regulatory or management authority
D) D, zone of win-win partnerships
If a field biologist with the National Park Service is working to collect data on a particular species, which of the following best describes that interaction?A) B, zone of social obligations
B) C, zone of informal decisions
C) A, zone of regulatory or management authority
D) D, zone of win-win partnerships
Unlock Deck
Unlock for access to all 71 flashcards in this deck.
Unlock Deck
k this deck
44
The recovery of the wolf in the upper Midwest regions of Minnesota, Wisconsin, and the Upper Peninsula of Michigan during the 1990s and 2000s was such a success, the idea of allowing the hunting of grey wolves has been considered in order to reduce depredations. Such a decision is an example of
A) ecosystem management.
B) adaptive management.
C) development of a monitoring plan.
D) ecological restoration.
A) ecosystem management.
B) adaptive management.
C) development of a monitoring plan.
D) ecological restoration.
Unlock Deck
Unlock for access to all 71 flashcards in this deck.
Unlock Deck
k this deck
45
Which change did not occur after wolves were reintroduced to the Greater Yellowstone Ecosystem?
A) Changes in elk behavior that made them less vulnerable to wolf predation
B) Increased recruitment of aspen in some areas
C) A decrease in beaver population size
D) Recovery of riparian functions
A) Changes in elk behavior that made them less vulnerable to wolf predation
B) Increased recruitment of aspen in some areas
C) A decrease in beaver population size
D) Recovery of riparian functions
Unlock Deck
Unlock for access to all 71 flashcards in this deck.
Unlock Deck
k this deck
46
Refer to the figure.
When wolves first returned to Yellowstone, coyote populations were reduced by nearly 50%. What impact do you think this would have had, for example, on foxes?
A) They would be driven to extinction.
B) Their population would remain unchanged, as wolves were killing coyote, not foxes.
C) Their population would increase due to less competition from coyote for small mammals.
D) Their population would be reduced similarly to that of the coyotes.
When wolves first returned to Yellowstone, coyote populations were reduced by nearly 50%. What impact do you think this would have had, for example, on foxes?A) They would be driven to extinction.
B) Their population would remain unchanged, as wolves were killing coyote, not foxes.
C) Their population would increase due to less competition from coyote for small mammals.
D) Their population would be reduced similarly to that of the coyotes.
Unlock Deck
Unlock for access to all 71 flashcards in this deck.
Unlock Deck
k this deck
47
Refer to the figure.
Figure 1
You are working with a town to develop a conservation strategy for parks (tracts) of protected land in a suburban area (parks A-G). These seven areas are depicted in Figure 1. Each square in the grid indicates an area of 1 km2.
-Refer to Figure 1 to familiarize yourself with the key aspects of the protected areas and answer the following questions:
a) Determine the overall size of each park (in km2) and create a table of these data (this will be referred to as Table 1).
b) Based on the total area, what percent of the available land is currently protected?
c) Based solely on the size of each park, which park would you expect to have the highest species richness? Why?
d) Based solely on size and shape of each park, which park would you expect would have the most potential for preserving viable populations of a threatened species? Why?
Figure 1
You are working with a town to develop a conservation strategy for parks (tracts) of protected land in a suburban area (parks A-G). These seven areas are depicted in Figure 1. Each square in the grid indicates an area of 1 km2. -Refer to Figure 1 to familiarize yourself with the key aspects of the protected areas and answer the following questions:
a) Determine the overall size of each park (in km2) and create a table of these data (this will be referred to as Table 1).
b) Based on the total area, what percent of the available land is currently protected?
c) Based solely on the size of each park, which park would you expect to have the highest species richness? Why?
d) Based solely on size and shape of each park, which park would you expect would have the most potential for preserving viable populations of a threatened species? Why?
Unlock Deck
Unlock for access to all 71 flashcards in this deck.
Unlock Deck
k this deck
48
Refer to the figure.
Figure 1
You are working with a town to develop a conservation strategy for parks (tracts) of protected land in a suburban area (parks A-G). These seven areas are depicted in Figure 1. Each square in the grid indicates an area of 1 km2.
- Refer to Figure 1 to familiarize yourself with the key aspects of the protected areas. Suppose the parks are susceptible to edge effects in the form of increased air temperature. Air temperature penetrates 1 km into the parks. Areas of the park that are more than 1 km from an edge are unaffected, and air temperature does not increase in those areas.Answer the following questions:
a) Using Figure 1, create a new figure (this will be referred to as Figure 2) indicating the locations within each of the parks that would be affected by edge effects.
b) Summarize how this edge effect would affect each of the parks (A-G) by creating a table (this will be referred to as Table 2). Based on the size (km2) of each park and the edge effects you sketched for Figure 2, determine for each park: 1) the area affected by increased air temperatures (in km2), and 2), based on the total area of each park and the area that would be affected by edge effects, the (%) of each park area affected by edge effect.
c) Which park would be most affected by edge effects in terms of total area affected? Which park would be most affected by edge effects in terms of percent of park area? Which park would be least affected by edge effects in terms of total area affected? Which park would be least affected by edge effects in terms of percent of park area?
Figure 1
You are working with a town to develop a conservation strategy for parks (tracts) of protected land in a suburban area (parks A-G). These seven areas are depicted in Figure 1. Each square in the grid indicates an area of 1 km2.- Refer to Figure 1 to familiarize yourself with the key aspects of the protected areas. Suppose the parks are susceptible to edge effects in the form of increased air temperature. Air temperature penetrates 1 km into the parks. Areas of the park that are more than 1 km from an edge are unaffected, and air temperature does not increase in those areas.Answer the following questions:
a) Using Figure 1, create a new figure (this will be referred to as Figure 2) indicating the locations within each of the parks that would be affected by edge effects.
b) Summarize how this edge effect would affect each of the parks (A-G) by creating a table (this will be referred to as Table 2). Based on the size (km2) of each park and the edge effects you sketched for Figure 2, determine for each park: 1) the area affected by increased air temperatures (in km2), and 2), based on the total area of each park and the area that would be affected by edge effects, the (%) of each park area affected by edge effect.
c) Which park would be most affected by edge effects in terms of total area affected? Which park would be most affected by edge effects in terms of percent of park area? Which park would be least affected by edge effects in terms of total area affected? Which park would be least affected by edge effects in terms of percent of park area?
Unlock Deck
Unlock for access to all 71 flashcards in this deck.
Unlock Deck
k this deck
49
Refer to the figure.
Figure 1
You are working with a town to develop a conservation strategy for parks (tracts) of protected land in a suburban area (parks A-G). These seven areas are depicted in Figure 1. Each square in the grid indicates an area of 1 km2.
-Refer to Figure 1 to familiarize yourself with the key aspects of the protected areas. Suppose the parks are susceptible to edge effects in the form of increased tree mortality and that this edge effect penetrates 2 km into the parks. Areas of the park that are more than 2 km from an edge are unaffected, and tree mortality does not increase in those areas.Answer the following questions:
a) Using Figure 1, create a new figure (this will be referred to as Figure 3) indicating the areas of the parks that would be affected by the edge effect of increased tree mortality.
b) Summarize how this edge effect would affect each of the parks (A-G) by creating a new table (this will be referred to as Table 3). Based on the size (km2) of each park and the edge effects you sketched in for Figure 3, determine how much area within each park would be affected by increased tree mortality (in km2). Based on the total area of each park and the area that would be affected by edge effects, determine the area of each park (in %) that would not be affected by edge effects.
c) In which park would the most land area (in km2) be affected by the increased tree mortality? In which park would the least land area be affected by increased tree mortality (km2)? Which park would have the lowest percent unaffected area? Which park would have the highest percent unaffected area?
Figure 1
You are working with a town to develop a conservation strategy for parks (tracts) of protected land in a suburban area (parks A-G). These seven areas are depicted in Figure 1. Each square in the grid indicates an area of 1 km2. -Refer to Figure 1 to familiarize yourself with the key aspects of the protected areas. Suppose the parks are susceptible to edge effects in the form of increased tree mortality and that this edge effect penetrates 2 km into the parks. Areas of the park that are more than 2 km from an edge are unaffected, and tree mortality does not increase in those areas.Answer the following questions:
a) Using Figure 1, create a new figure (this will be referred to as Figure 3) indicating the areas of the parks that would be affected by the edge effect of increased tree mortality.
b) Summarize how this edge effect would affect each of the parks (A-G) by creating a new table (this will be referred to as Table 3). Based on the size (km2) of each park and the edge effects you sketched in for Figure 3, determine how much area within each park would be affected by increased tree mortality (in km2). Based on the total area of each park and the area that would be affected by edge effects, determine the area of each park (in %) that would not be affected by edge effects.
c) In which park would the most land area (in km2) be affected by the increased tree mortality? In which park would the least land area be affected by increased tree mortality (km2)? Which park would have the lowest percent unaffected area? Which park would have the highest percent unaffected area?
Unlock Deck
Unlock for access to all 71 flashcards in this deck.
Unlock Deck
k this deck
50
Refer to the figure.
Figure 1
You are working with a town to develop a conservation strategy for parks (tracts) of protected land in a suburban area (parks A-G). These seven areas are depicted in Figure 1. Each square in the grid indicates an area of 1 km2.
-Refer to Figure 1 to familiarize yourself with the key aspects of the protected areas. Based on how forests in the park respond to edge effects, do you think that increased temperature alone could explain the biotic response (tree mortality) to edges seen in these examples? Why or why not?
Figure 1
You are working with a town to develop a conservation strategy for parks (tracts) of protected land in a suburban area (parks A-G). These seven areas are depicted in Figure 1. Each square in the grid indicates an area of 1 km2. -Refer to Figure 1 to familiarize yourself with the key aspects of the protected areas. Based on how forests in the park respond to edge effects, do you think that increased temperature alone could explain the biotic response (tree mortality) to edges seen in these examples? Why or why not?
Unlock Deck
Unlock for access to all 71 flashcards in this deck.
Unlock Deck
k this deck
51
Refer to the figure and tables.
Figure 1
You are working with a town to develop a conservation strategy for parks (tracts) of protected land in a suburban area (parks A-G). These seven areas are depicted in Figure 1. Each square in the grid indicates an area of 1 km2.
-Refer to Figure 1 to familiarize yourself with the key aspects of the protected areas. Based on the data for edge effects you collected in Tables 2 and 3, are the patterns consistent with the expected impact of edges on parks of different shapes and sizes? What assumptions have you made in this analysis?
Figure 1
You are working with a town to develop a conservation strategy for parks (tracts) of protected land in a suburban area (parks A-G). These seven areas are depicted in Figure 1. Each square in the grid indicates an area of 1 km2. -Refer to Figure 1 to familiarize yourself with the key aspects of the protected areas. Based on the data for edge effects you collected in Tables 2 and 3, are the patterns consistent with the expected impact of edges on parks of different shapes and sizes? What assumptions have you made in this analysis?
Unlock Deck
Unlock for access to all 71 flashcards in this deck.
Unlock Deck
k this deck
52
Refer to the figures.
Figure 1
Figure 2
You are working with a town to develop a conservation strategy for parks (tracts) of protected land in a suburban area (parks A-G). These seven areas are depicted in Figure 1. Each square in the grid indicates an area of 1 km2.
-Refer to Figure 1 to familiarize yourself with the key aspects of the protected areas. Suppose a species of bird lives in the parks in this area. These birds will fly among forest patches, but will only cross a maximum of 3 km of disturbed forest. The forest habitat that the birds require is disturbed by an edge effect that penetrates 1 km into the forest. Based on this information about the birds' movement preferences and the extent of edge effects, which patches could the birds move among? How many isolated populations of this bird species would you expect to find among the parks, and which parks would form each of the newly isolated populations? On Figure 2, circle the isolated populations (this will be referred to as Figure 4).
Figure 1
Figure 2 You are working with a town to develop a conservation strategy for parks (tracts) of protected land in a suburban area (parks A-G). These seven areas are depicted in Figure 1. Each square in the grid indicates an area of 1 km2. -Refer to Figure 1 to familiarize yourself with the key aspects of the protected areas. Suppose a species of bird lives in the parks in this area. These birds will fly among forest patches, but will only cross a maximum of 3 km of disturbed forest. The forest habitat that the birds require is disturbed by an edge effect that penetrates 1 km into the forest. Based on this information about the birds' movement preferences and the extent of edge effects, which patches could the birds move among? How many isolated populations of this bird species would you expect to find among the parks, and which parks would form each of the newly isolated populations? On Figure 2, circle the isolated populations (this will be referred to as Figure 4).
Unlock Deck
Unlock for access to all 71 flashcards in this deck.
Unlock Deck
k this deck
53
Refer to the figures.
Figure 1
Figure 2
Figure 4
You are working with a town to develop a conservation strategy for parks (tracts) of protected land in a suburban area (parks A-G). These seven areas are depicted in Figure 1. Each square in the grid indicates an area of 1 km2.
- Refer to Figure 1 to familiarize yourself with the key aspects of the protected areas. Suppose you are the park manager in this area, and you have the option to build a limited number of habitat corridors to connect different parks to one another and reconnect the populations of birds that have been isolated from one another by the 1 km edge effect. However, your budget is limited. What is the minimum number of habitat corridors that would be required to reconnect the isolated populations of birds you (see Figure 4)? Where would you create these corridors, and why? On Figure 2, indicate the areas you would choose to create habitat corridors (this will be referred to as Figure 5).
Figure 1
Figure 2 Figure 4 You are working with a town to develop a conservation strategy for parks (tracts) of protected land in a suburban area (parks A-G). These seven areas are depicted in Figure 1. Each square in the grid indicates an area of 1 km2.- Refer to Figure 1 to familiarize yourself with the key aspects of the protected areas. Suppose you are the park manager in this area, and you have the option to build a limited number of habitat corridors to connect different parks to one another and reconnect the populations of birds that have been isolated from one another by the 1 km edge effect. However, your budget is limited. What is the minimum number of habitat corridors that would be required to reconnect the isolated populations of birds you (see Figure 4)? Where would you create these corridors, and why? On Figure 2, indicate the areas you would choose to create habitat corridors (this will be referred to as Figure 5).
Unlock Deck
Unlock for access to all 71 flashcards in this deck.
Unlock Deck
k this deck
54
Refer to the figures.
Figure 1
Figure 2
You are working with a town to develop a conservation strategy for parks (tracts) of protected land in a suburban area (parks A-G). These seven areas are depicted in Figure 1. Each square in the grid indicates an area of 1 km2.
- Refer to Figure 1 to familiarize yourself with the key aspects of the protected areas. Suppose a highly virulent pathogen has invaded park B. The pathogen infects the birds in the undisturbed habitat in the park and is spread through direct contact among individuals. Based on the birds' movement preferences, what could you do to contain the spread of this pathogen? (Assume the protected areas are as pictured in Figure 2, with the edge effects of increased air temperature).
Figure 1
Figure 2 You are working with a town to develop a conservation strategy for parks (tracts) of protected land in a suburban area (parks A-G). These seven areas are depicted in Figure 1. Each square in the grid indicates an area of 1 km2.- Refer to Figure 1 to familiarize yourself with the key aspects of the protected areas. Suppose a highly virulent pathogen has invaded park B. The pathogen infects the birds in the undisturbed habitat in the park and is spread through direct contact among individuals. Based on the birds' movement preferences, what could you do to contain the spread of this pathogen? (Assume the protected areas are as pictured in Figure 2, with the edge effects of increased air temperature).
Unlock Deck
Unlock for access to all 71 flashcards in this deck.
Unlock Deck
k this deck
55
Refer to the figures.
Figure 1
Figure 2
You are working with a town to develop a conservation strategy for parks (tracts) of protected land in a suburban area (parks A-G). These seven areas are depicted in Figure 1. Each square in the grid indicates an area of 1 km2.
-Refer to Figure 1 to familiarize yourself with the key aspects of the protected areas. Suppose a highly virulent pathogen has invaded park B. The pathogen infects the birds in the undisturbed habitat in the park and is spread through direct contact among individuals. As the park manager, what are your two primary goals in responding to this pathogen? The actions that you decide to take to control the spread of the deadly pathogen are an example of what aspect of conservation biology? Who are the stakeholders?
Figure 1
Figure 2 You are working with a town to develop a conservation strategy for parks (tracts) of protected land in a suburban area (parks A-G). These seven areas are depicted in Figure 1. Each square in the grid indicates an area of 1 km2. -Refer to Figure 1 to familiarize yourself with the key aspects of the protected areas. Suppose a highly virulent pathogen has invaded park B. The pathogen infects the birds in the undisturbed habitat in the park and is spread through direct contact among individuals. As the park manager, what are your two primary goals in responding to this pathogen? The actions that you decide to take to control the spread of the deadly pathogen are an example of what aspect of conservation biology? Who are the stakeholders?
Unlock Deck
Unlock for access to all 71 flashcards in this deck.
Unlock Deck
k this deck
56
Refer to the figures.
Figure 1
Figure 2
You are working with a town to develop a conservation strategy for parks (tracts) of protected land in a suburban area (parks A-G). These seven areas are depicted in Figure 1. Each square in the grid indicates an area of 1 km2.
- Refer to Figure 1 to familiarize yourself with the key aspects of the protected areas. Suppose a species of bird lives in the parks in this area. These birds will fly among forest patches, but will only cross a maximum of 3 km of disturbed forest. The forest habitat that the birds require is disturbed by an edge effect that penetrates 1 km into the forest. Suppose for these analyses you assess landscape characteristics for each 1 km2 quadrat. If you decided instead to increase the size of your quadrats to 10 km2, could you change the scale of your analysis with the data you have? Would this be an appropriate scale for a study of the movement preferences of the bird species?
Figure 1
Figure 2 You are working with a town to develop a conservation strategy for parks (tracts) of protected land in a suburban area (parks A-G). These seven areas are depicted in Figure 1. Each square in the grid indicates an area of 1 km2.- Refer to Figure 1 to familiarize yourself with the key aspects of the protected areas. Suppose a species of bird lives in the parks in this area. These birds will fly among forest patches, but will only cross a maximum of 3 km of disturbed forest. The forest habitat that the birds require is disturbed by an edge effect that penetrates 1 km into the forest. Suppose for these analyses you assess landscape characteristics for each 1 km2 quadrat. If you decided instead to increase the size of your quadrats to 10 km2, could you change the scale of your analysis with the data you have? Would this be an appropriate scale for a study of the movement preferences of the bird species?
Unlock Deck
Unlock for access to all 71 flashcards in this deck.
Unlock Deck
k this deck
57
The landscape of the Amazon rainforest has become more fragmented over the past half century. Thus, we would say that its _______ has changed.
A) composition
B) structure
C) extent
D) grain
A) composition
B) structure
C) extent
D) grain
Unlock Deck
Unlock for access to all 71 flashcards in this deck.
Unlock Deck
k this deck
58
Suppose a two-dimensional landscape image consists of 40,000 square pixels. If the size of each pixel were cut in half, _______ pixels would be needed to portray the same landscape.
A) 10,000
B) 20,000
C) 80,000
D) 160,000
A) 10,000
B) 20,000
C) 80,000
D) 160,000
Unlock Deck
Unlock for access to all 71 flashcards in this deck.
Unlock Deck
k this deck
59
Refer to the figure.
You are the lead researcher studying continental migratory patterns of the sandhill crane (Antigone canadensis) to track their overall movements across the landscape. Although you would like to know roughly what habitat they land in, accuracy on a 0.5 km2 area will suffice. Given this information, which of the following images (1-6) would most efficient to use for analyzing these migratory routes of the sandhill crane?
A) Image 6
B) Image 5
C) Image 1
D) Image 3
You are the lead researcher studying continental migratory patterns of the sandhill crane (Antigone canadensis) to track their overall movements across the landscape. Although you would like to know roughly what habitat they land in, accuracy on a 0.5 km2 area will suffice. Given this information, which of the following images (1-6) would most efficient to use for analyzing these migratory routes of the sandhill crane?A) Image 6
B) Image 5
C) Image 1
D) Image 3
Unlock Deck
Unlock for access to all 71 flashcards in this deck.
Unlock Deck
k this deck
60
In central France, the legacy of Roman settlements persists after 2,000 years. As one moves closer to the center of the settlement sites, the pH of the soil _______, the amount of phosphates in the soil _______, and the number of species _______.
A) increases; increases; increases
B) increases; increases; decreases
C) decreases; increases; increases
D) decreases; decreases; decreases
A) increases; increases; increases
B) increases; increases; decreases
C) decreases; increases; increases
D) decreases; decreases; decreases
Unlock Deck
Unlock for access to all 71 flashcards in this deck.
Unlock Deck
k this deck
61
Habitat fragmentation tends to _______ the rate of inbreeding and _______ the effects of genetic drift.
A) increase; increase
B) increase; decrease
C) decrease; increase
D) decrease; decrease
A) increase; increase
B) increase; decrease
C) decrease; increase
D) decrease; decrease
Unlock Deck
Unlock for access to all 71 flashcards in this deck.
Unlock Deck
k this deck
62
Refer to the photo.
Consider the forest fragmentation that took place in the formation of Lago Guri. What effect would this have on the trophic cascades in this habitat?
A) Trophic cascades would create more trophic levels.
B) Trophic cascades would stop entirely due to a loss of generalists.
C) Trophic cascades would be altered due to the likely loss of top predators.
D) It would encourage greater numbers of trophic cascades due to the influx of new top predators.
Consider the forest fragmentation that took place in the formation of Lago Guri. What effect would this have on the trophic cascades in this habitat?A) Trophic cascades would create more trophic levels.
B) Trophic cascades would stop entirely due to a loss of generalists.
C) Trophic cascades would be altered due to the likely loss of top predators.
D) It would encourage greater numbers of trophic cascades due to the influx of new top predators.
Unlock Deck
Unlock for access to all 71 flashcards in this deck.
Unlock Deck
k this deck
63
Refer to the figure.
The figure shows the persistence of edge effects in Amazon rainforest fragments. Suppose a forest fragment is 500 m × 500 m. What fraction of the fragment would experience decreased relative humidity due to edge effects?
A) 1/25
B) 4/25
C) 16/25
D) 20/25
The figure shows the persistence of edge effects in Amazon rainforest fragments. Suppose a forest fragment is 500 m × 500 m. What fraction of the fragment would experience decreased relative humidity due to edge effects?A) 1/25
B) 4/25
C) 16/25
D) 20/25
Unlock Deck
Unlock for access to all 71 flashcards in this deck.
Unlock Deck
k this deck
64
Assuming all other factors are equal, which statement about the success of core natural areas as a conservation measure is false?
A) Areas with compact shapes are superior to areas with less compact shapes.
B) One large reserve is superior to a few small reserves with the same total area.
C) Several reserves far apart are superior to the same number of reserves close together.
D) Reserves connected by habitat corridors are superior to unconnected reserves.
Unlock Deck
Unlock for access to all 71 flashcards in this deck.
Unlock Deck
k this deck
65
Suppose that you have 64 km2 to devote to a core natural area or areas. All other things being equal, which arrangement would best foster the preservation of biodiversity?
1) A single area that is 2 km × 32 km
2) A single area that is 4 km × 16 km
3) Two areas that are each 2 km × 16 km
A) Arrangement 1
B) Arrangement 2
C) Arrangement 3
D) Arrangements 1 and 2 are equally good, and both are better than 3.
1) A single area that is 2 km × 32 km
2) A single area that is 4 km × 16 km
3) Two areas that are each 2 km × 16 km
A) Arrangement 1
B) Arrangement 2
C) Arrangement 3
D) Arrangements 1 and 2 are equally good, and both are better than 3.
Unlock Deck
Unlock for access to all 71 flashcards in this deck.
Unlock Deck
k this deck
66
Three different core areas designed to protect an endangered beetle each have a buffer zone associated with them. In buffer zone A, the birth rate of the beetle is 0.04, and its death rate is 0.08. In buffer zone B, the birth rate of the beetle is 0.16, and the death rate is 0.2. In buffer zone C, the birth rate is 0.07, and the death rate is 0.05. Which of these buffer zones is most likely to be effective in protecting the beetle (all other factors being equal)?
A) Zone A
B) Zone B
C) Zone C
D) Zones B and C would be equally effective, and both better than A.
A) Zone A
B) Zone B
C) Zone C
D) Zones B and C would be equally effective, and both better than A.
Unlock Deck
Unlock for access to all 71 flashcards in this deck.
Unlock Deck
k this deck
67
A possible negative consequence of establishing habitat corridors is that they
A) may facilitate the movement of non-target native species.
B) may facilitate the movement of invasive species.
C) have never been demonstrated to be effective in assisting the movement of the target species.
D) may facilitate greater gene flow.
A) may facilitate the movement of non-target native species.
B) may facilitate the movement of invasive species.
C) have never been demonstrated to be effective in assisting the movement of the target species.
D) may facilitate greater gene flow.
Unlock Deck
Unlock for access to all 71 flashcards in this deck.
Unlock Deck
k this deck
68
The reintroduction of otters (Lontra canadensis) into Great Smoky Mountains National Park by park biologists was based on sound scientific decisions. However, the release also raised concerns and controversy with trout fishermen who worried that the otters would greatly reduce trout populations. In such a scenario, who are the stakeholders?
A) The fishermen only
B) The park biologists only
C) The fishermen, park biologists, and the otters
D) The fishermen and the park biologists
A) The fishermen only
B) The park biologists only
C) The fishermen, park biologists, and the otters
D) The fishermen and the park biologists
Unlock Deck
Unlock for access to all 71 flashcards in this deck.
Unlock Deck
k this deck
69
Which statement about adaptive management is true?
A) The first step is almost always the gathering of scientific data.
B) It is not an iterative process.
C) Monitoring is a less integral component.
D) GIS data are required.
A) The first step is almost always the gathering of scientific data.
B) It is not an iterative process.
C) Monitoring is a less integral component.
D) GIS data are required.
Unlock Deck
Unlock for access to all 71 flashcards in this deck.
Unlock Deck
k this deck
70
Which of the following is not a predicted result from the doubling of the atmospheric concentration of carbon dioxide in Yellowstone National Park?
A) Higher temperatures
B) Increased rainfall
C) More frequent fires
D) Upslope and northward migration of species
A) Higher temperatures
B) Increased rainfall
C) More frequent fires
D) Upslope and northward migration of species
Unlock Deck
Unlock for access to all 71 flashcards in this deck.
Unlock Deck
k this deck
71
Refer to the figure.
The figure shows the projected changes in distribution of two tree species if carbon dioxide concentrations double. What would the most widespread effect be on western red cedar after such an increase in carbon dioxide?
A) No change
B) Range expansion
C) Range contraction
D) Extinction
The figure shows the projected changes in distribution of two tree species if carbon dioxide concentrations double. What would the most widespread effect be on western red cedar after such an increase in carbon dioxide?A) No change
B) Range expansion
C) Range contraction
D) Extinction
Unlock Deck
Unlock for access to all 71 flashcards in this deck.
Unlock Deck
k this deck
Unlock Deck
Unlock for access to all 71 flashcards in this deck.


